目录
[一、了解Apache EChart](#一、了解Apache EChart)
[1.1 什么是Apache Echart](#1.1 什么是Apache Echart)
[1.2 为什么要使用图表](#1.2 为什么要使用图表)
[1.3 常见的图表以及特点](#1.3 常见的图表以及特点)
[二、Apache EChart的基本使用](#二、Apache EChart的基本使用)
[2.1 下载echarts.js](#2.1 下载echarts.js)
[2.2 echart基本使用案例](#2.2 echart基本使用案例)
[3.1 柱状图(type:'bar')](#3.1 柱状图(type:'bar'))
[3.2 折线图(type:'line')](#3.2 折线图(type:'line'))
[3.3 饼图(type:'pie')](#3.3 饼图(type:'pie'))
[3.4 散点图(type:'scatter')](#3.4 散点图(type:'scatter'))
一、了解Apache EChart
1.1 什么是Apache Echart

1.2 为什么要使用图表
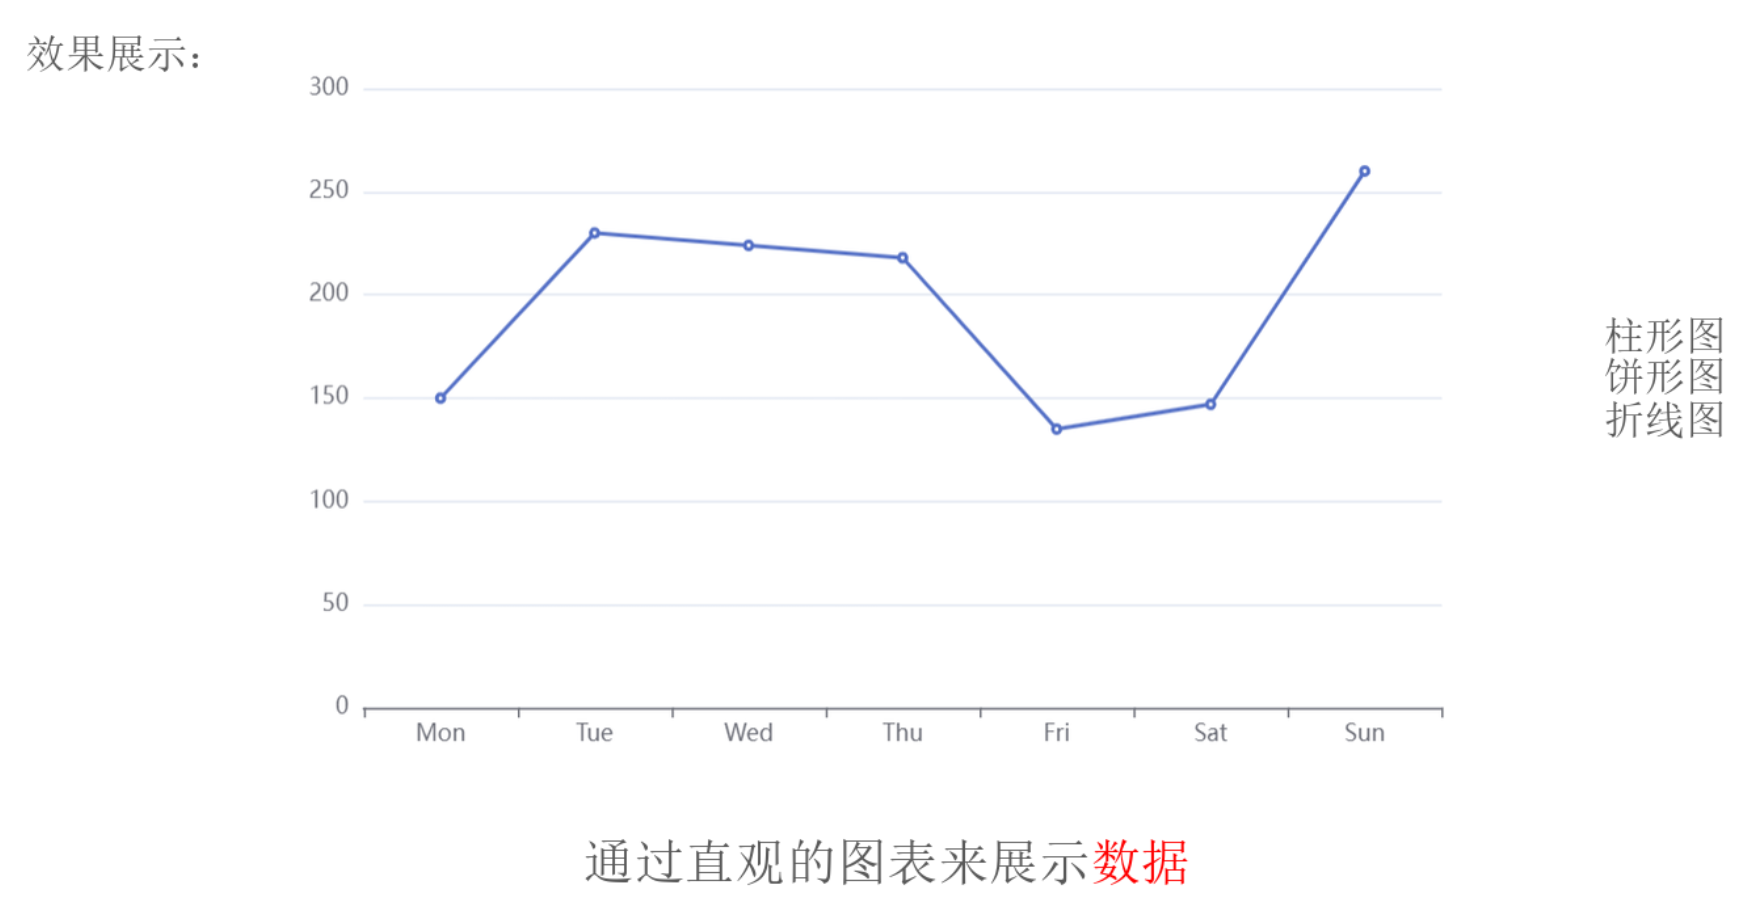
- 可视化效果:图表将数据转换为图形,使复杂的数据变得直观易懂。
- 提高用户体验:图表简化了数据解读过程,提升了用户对信息的理解速度。
- 简化数据解读:通过图形化展示,用户可以快速识别数据的关键趋势和模式。
- 促进沟通:图表有助于在团队成员间进行更有效的沟通,易于分享和理解数据。
1.3 常见的图表以及特点
柱状图:

特点:
- 柱状图使用垂直或水平的矩形条(柱子)来表示不同类别之间的数值比较。
- 每个柱子的高度或长度代表其对应的数值大小。
- 柱状图清晰地展示了不同分类之间的差异,使得数据对比更加直观。
折线图:

特点:
- 折线图使用一系列数据点连接成线段,用于显示数据随时间变化的趋势。
- 它能够有效地展示数据的趋势和模式,特别是在一段时间内的变化趋势。
- 折线图中的每个点代表一个数据值,线段则表示这些数据值之间的连续性。
饼图:

特点:
- 饼图通过将圆形分割成不同的扇形区域来表示各个部分占总体的比例。
- 每个扇形的面积与它所代表的部分在总和中的比例相对应。
- 饼图适合于展示各个组成部分在整体中的占比情况。
散点图:

特点:
- 散点图使用二维坐标系中的点来表示数据集中的每一对数值。
- 点的位置反映了两个变量之间的关系,通常用于探索变量之间的相关性。
- 如果数据点聚集在一起,则表明变量之间可能存在某种关系;如果数据点分布广泛,则表明变量之间没有明显的关系。
二、Apache EChart的基本使用
2.1 下载echarts.js
通过官网进行下载或者npm下载
bash
npm install echarts2.2 echart基本使用案例
html
<template>
  <div id="app">
    <div id="main" style="width: 600px;height:400px;"></div>
  </div>
</template>

<script>
import * as echarts from 'echarts';

export default {
  name: 'App',
  mounted() {
    // 基于准备好的dom,初始化echarts实例
    var myChart = echarts.init(document.getElementById('main'));

    // 绘制图表
    myChart.setOption({
      title: {
        text: 'ECharts 入门示例'
      },
      tooltip: {},
      xAxis: {
        data: ['衬衫', '羊毛衫', '雪纺衫', '裤子', '高跟鞋', '袜子']
      },
      yAxis: {},
      series: [
        {
          name: '销量',
          type: 'bar',
          data: [5, 20, 36, 10, 10, 20]
        }
      ]
    });
  }
}
</script>
效果展示:
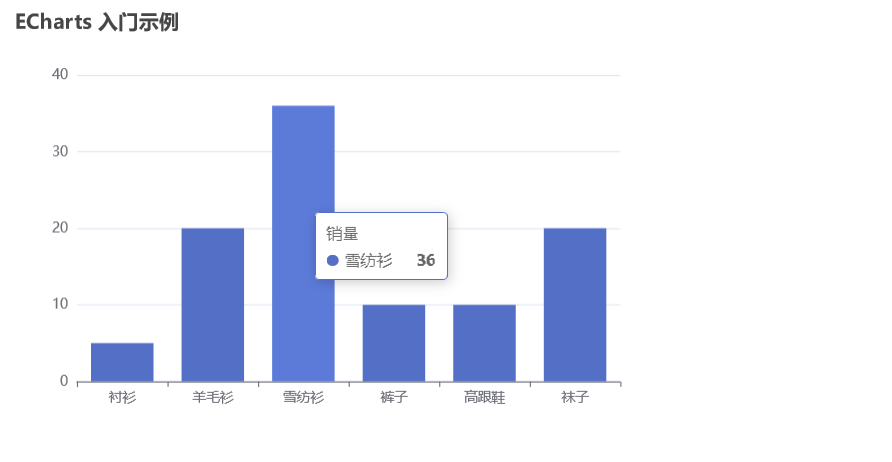
基本参数选项的解释
title
text: 设置图表标题的文字。在这里,标题为"ECharts 入门示例"。
tooltip
- 空对象
{}表示采用默认的提示框样式和行为。如果需要自定义提示框的内容、样式等,可以通过向tooltip对象中添加属性来实现。
xAxis
data: 设置 X 轴的数据,即条形图的分类标签。在这里,数据为['衬衫', '羊毛衫', '雪纺衫', '裤子', '高跟鞋', '袜子']。默认情况下,ECharts 会自动创建一个类目轴(category axis)用于显示这些分类。
yAxis
- 空对象
{}表示采用默认的 Y 轴设置。如果需要自定义 Y 轴的刻度范围、标签等,可以通过向yAxis对象中添加属性来实现。
series
series是一个数组,其中的每个对象代表一个数据系列。
name: 数据系列的名称,在图例中显示。在这里,系列名称为"销量"。
type: 图表类型。在这里,类型为bar,表示条形图。
data: 数据系列的数据值。在这里,数据为[5, 20, 36, 10, 10, 20],对应 X 轴上的六个分类。
三、多类型图表的使用
3.1 柱状图(type:'bar')
--基本柱状图

html
<!-- 基本柱状图 -->
<template>
  <div id="app">
    <div id="main" style="width: 600px;height:400px;"></div>
  </div>
</template>

<script>
import * as echarts from 'echarts';

export default {
  name: 'App',
  mounted() {
    // 基于准备好的dom,初始化echarts实例
    var myChart = echarts.init(document.getElementById('main'));

    // 绘制图表
    myChart.setOption({
      title: {
        text: '基本柱状图'
      },
      xAxis: {
        data: ['衬衫', '羊毛衫', '雪纺衫', '裤子', '高跟鞋', '袜子']
      },
      yAxis: {},
      series: [
        {
          name: '销量',
          type: 'bar',
          data: [5, 20, 36, 10, 10, 20]
        }
      ]
    });
  }
}
</script>
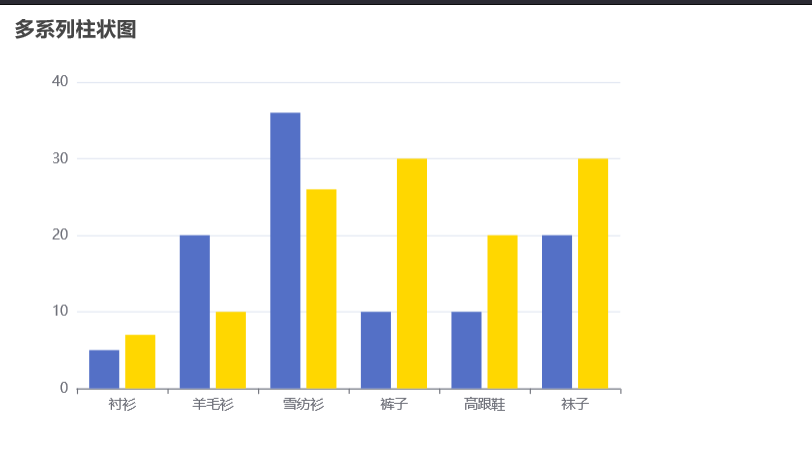
--多系列柱状图
相比于基本柱状图,只需要多增加一列数据即可
html
<!-- 基本柱状图 -->
<template>
  <div id="app">
    <div id="main" style="width: 600px;height:400px;"></div>
  </div>
</template>

<script>
import * as echarts from 'echarts';

export default {
  name: 'App',
  mounted() {
    // 基于准备好的dom,初始化echarts实例
    var myChart = echarts.init(document.getElementById('main'));

    // 绘制图表
    myChart.setOption({
      title: {
        text: '多系列柱状图'
      },
      xAxis: {
        data: ['衬衫', '羊毛衫', '雪纺衫', '裤子', '高跟鞋', '袜子']
      },
      yAxis: {},
      series: [
        {
          name: '销量',
          type: 'bar',
          data: [5, 20, 36, 10, 10, 20]
        },
        {
          name: '销量',
          type: 'bar',
          data: [7, 10, 26, 30, 20, 30],
          itemStyle: {
            color: 'gold'
          }
        }
      ]
    });
  }
}
</script>
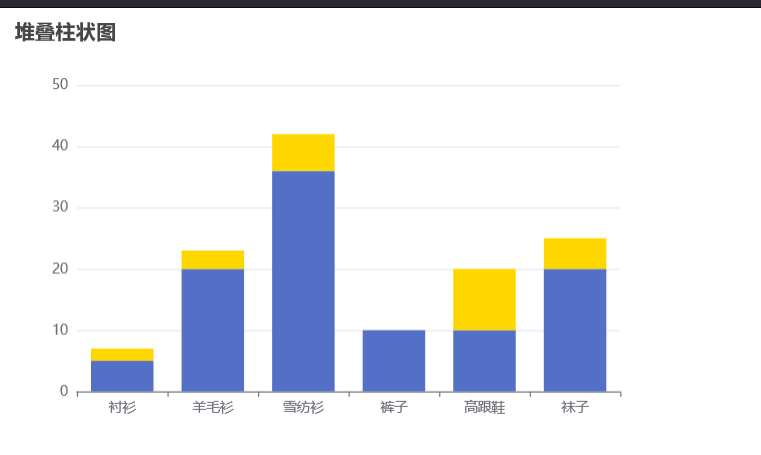
--堆叠柱状图
通过设置一个stack选项让其堆叠在一起,方便观察数据的变化。
html
<!-- 基本柱状图 -->
<template>
  <div id="app">
    <div id="main" style="width: 600px;height:400px;"></div>
  </div>
</template>

<script>
import * as echarts from 'echarts';

export default {
  name: 'App',
  mounted() {
    // 基于准备好的dom,初始化echarts实例
    var myChart = echarts.init(document.getElementById('main'));

    // 绘制图表
    myChart.setOption({
      tooltip: {},
      title: {
        text: '堆叠柱状图'
      },
      xAxis: {
        data: ['衬衫', '羊毛衫', '雪纺衫', '裤子', '高跟鞋', '袜子']
      },
      yAxis: {},
      series: [
        {
          name: '销量',
          type: 'bar',
          data: [5, 20, 36, 10, 10, 20],
          stack:'x'
        },
        {
          name: '销量增量',
          type: 'bar',
          data: [2, 3, 6, 0, 10, 5],
          itemStyle: {
            color: 'gold'
          },
          stack:'x'
        }
      ]
    });
  }
}
</script>
使用 EChart 实现堆叠柱状图的方法非常简单,只需要给一个系列的
stack值设置一个字符串类型的值,这一个值表示该系列堆叠的类别。也就是说,拥有同样stack值的系列将堆叠在一组。
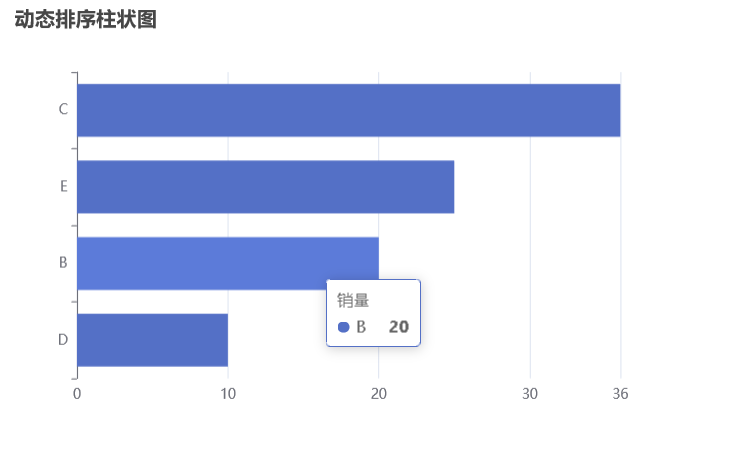
--动态排序柱状图
html
<template>
  <div id="app">
    <div id="main" style="width: 600px;height:400px;"></div>
  </div>
</template>

<script>
import * as echarts from 'echarts';

export default {
  name: 'App',
  mounted() {
    // 基于准备好的dom,初始化echarts实例
    var myChart = echarts.init(document.getElementById('main'));

    // 绘制图表
    myChart.setOption({
      tooltip: {},
      title: {
        text: '动态排序柱状图'
      },
      xAxis: {
        max: 'dataMax'
      },
      yAxis: {
        type: 'category',
        data: ['A', 'B', 'C', 'D', 'E','F'],
        inverse: true,
        animationDuration: 300,
        animationDurationUpdate: 300,
        // 设置柱状图最大显示数量从0开始
        max: 3
      },
      series: [
        {
          realtimeSort: true,
          name: '销量',
          type: 'bar',
          data: [5, 20, 36, 10, 25, 10],

        },
      ]
    });
  }
}
</script>
- 柱状图系列的
realtimeSort设为true,表示开启该系列的动态排序效果yAxis.inverse设为true,表示 Y 轴从下往上是从小到大的排列yAxis.animationDuration建议设为300,表示第一次柱条排序动画的时长yAxis.animationDurationUpdate建议设为300,表示第一次后柱条排序动画的时长- 如果想只显示前 n 名,将
yAxis.max设为 n - 1,否则显示所有柱条xAxis.max建议设为'dataMax'表示用数据的最大值作为 X 轴最大值,视觉效果更好- 如果想要实时改变标签,需要将
series.label.valueAnimation设为trueanimationDuration设为0,表示第一份数据不需要从0开始动画(如果希望从0开始则设为和animationDurationUpdate相同的值)animationDurationUpdate建议设为3000表示每次更新动画时长,这一数值应与调用setOption改变数据的频率相同- 以
animationDurationUpdate的频率调用setInterval,更新数据值,显示下一个时间点对应的柱条排序
3.2 折线图(type:'line')
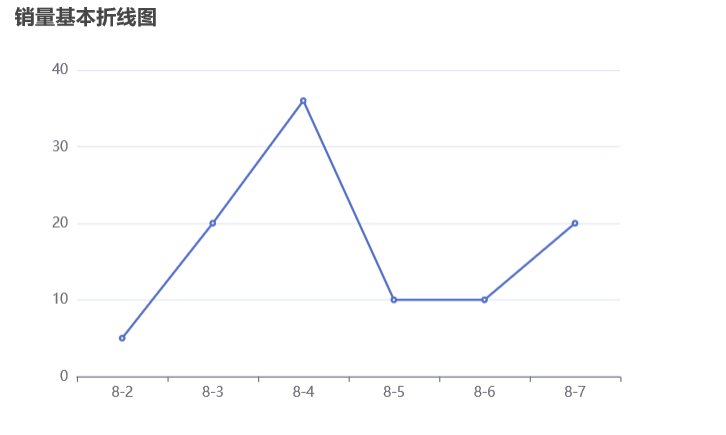
--基本折线图
html
<!-- 折线图 -->
<template>
  <div id="app">
    <div id="main" style="width: 600px;height:400px;"></div>
  </div>
</template>

<script>
import * as echarts from 'echarts';

export default {
  name: 'App',
  mounted() {
    // 基于准备好的dom,初始化echarts实例
    var myChart = echarts.init(document.getElementById('main'));

    // 绘制图表
    myChart.setOption({
      tooltip: {},
      title: {
        text: '销量基本折线图'
      },
      xAxis: {
        data: ['8-2', '8-3', '8-4', '8-5', '8-6', '8-7'],
      },
      yAxis: {},
      series: [
        {
          name: '销量',
          type: 'line',
          data: [5, 20, 36, 10, 10, 20]
        },
      ]
    });
  }
}
</script>
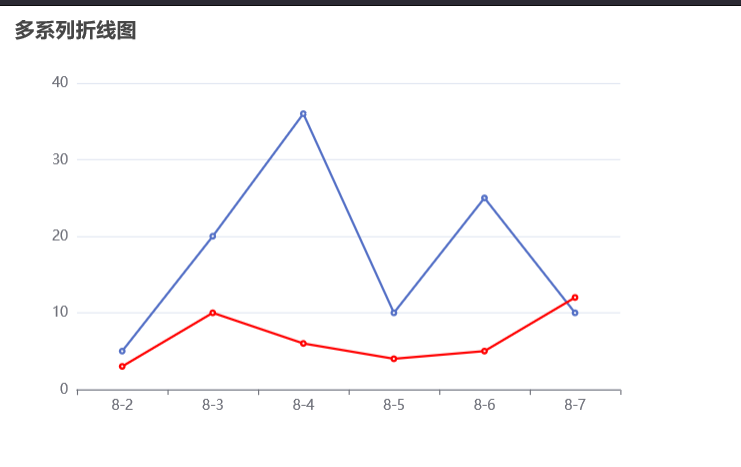
--多系列折线图
html
<template>
  <div id="app">
    <div id="main" style="width: 600px;height:400px;"></div>
  </div>
</template>

<script>
import * as echarts from 'echarts';

export default {
  name: 'App',
  mounted() {
    // 基于准备好的dom,初始化echarts实例
    var myChart = echarts.init(document.getElementById('main'));

    // 绘制图表
    myChart.setOption({
      tooltip: {},
      title: {
        text: '多系列折线图'
      },
      xAxis: {
        data: ['8-2', '8-3', '8-4', '8-5', '8-6', '8-7'],
      },
      yAxis: {
      },
      series: [
        {
          name: '销量',
          type: 'line',
          data: [5, 20, 36, 10, 25, 10],

        },
        {
          name: '销量',
          type: 'line',
          data: [3, 10, 6, 4, 5, 12],
          itemStyle: {
            color: 'red'
          }
        },
      ]
    });
  }
}
</script>
--堆叠折线图
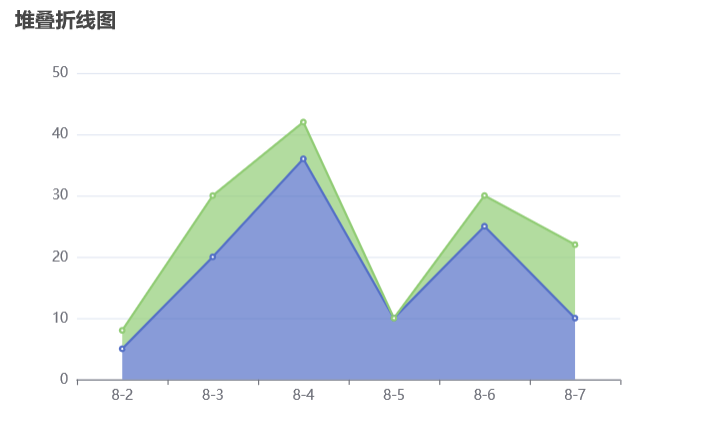
与堆叠柱状图类似都是加入stack,但是注意为了区分多系列折线图,一般建议使用区域填充色以表明堆叠的情况。
html
<template>
  <div id="app">
    <div id="main" style="width: 600px;height:400px;"></div>
  </div>
</template>

<script>
import * as echarts from 'echarts';

export default {
  name: 'App',
  mounted() {
    // 基于准备好的dom,初始化echarts实例
    var myChart = echarts.init(document.getElementById('main'));

    // 绘制图表
    myChart.setOption({
      tooltip: {},
      title: {
        text: '堆叠折线图'
      },
      xAxis: {
        data: ['8-2', '8-3', '8-4', '8-5', '8-6', '8-7'],
      },
      yAxis: {
      },
      series: [
        {
          name: '销量',
          type: 'line',
          data: [5, 20, 36, 10, 25, 10],
          stack:'x',
          areaStyle: {}
        },
        {
          name: '销量增量',
          type: 'line',
          data: [3, 10, 6, 0, 5, 12],
          stack:'x',
          areaStyle: {}
        },
      ]
    });
  }
}
</script>
--平滑曲线图
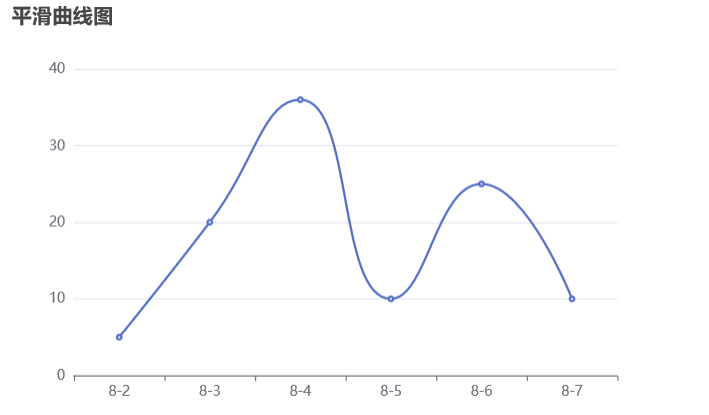
html
<template>
  <div id="app">
    <div id="main" style="width: 600px;height:400px;"></div>
  </div>
</template>

<script>
import * as echarts from 'echarts';

export default {
  name: 'App',
  mounted() {
    // 基于准备好的dom,初始化echarts实例
    var myChart = echarts.init(document.getElementById('main'));

    // 绘制图表
    myChart.setOption({
      tooltip: {},
      title: {
        text: '平滑曲线图'
      },
      xAxis: {
        data: ['8-2', '8-3', '8-4', '8-5', '8-6', '8-7'],
      },
      yAxis: {
      },
      series: [
        {
          name: '销量',
          type: 'line',
          data: [5, 20, 36, 10, 25, 10],
          smooth: true
        },

      ]
    });
  }
}
</script>
--阶梯折线图
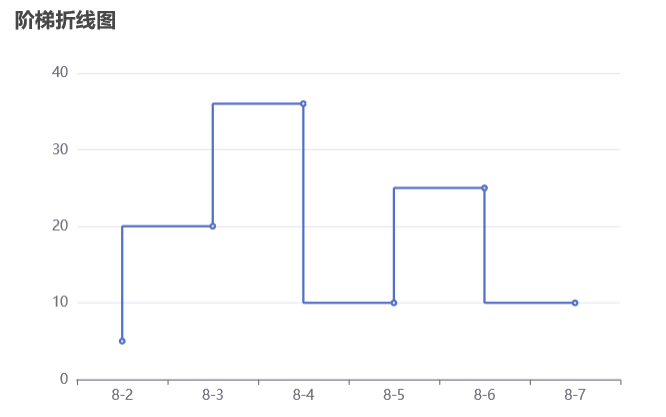
在 ECharts 中,系列的
step属性用来表征阶梯线图的连接类型,它共有三种取值:'start'、'middle'和'end',分别表示在当前点,当前点与下个点的中间点,下个点拐弯。
3.3 饼图(type:'pie')
--基本饼图
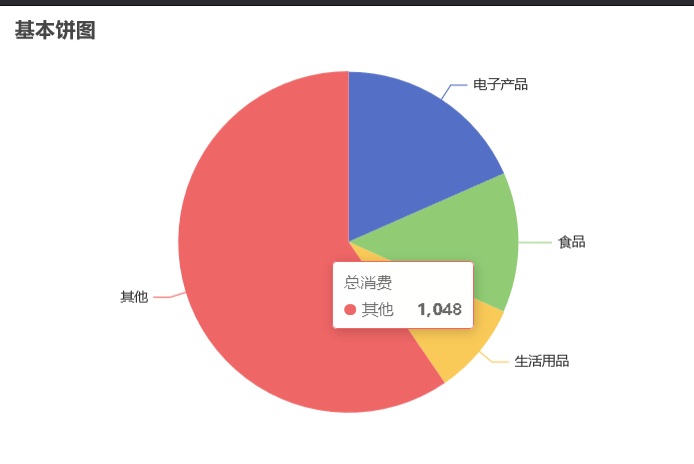
html
<template>
  <div id="app">
    <div id="main" style="width: 600px;height:400px;"></div>
  </div>
</template>

<script>
import * as echarts from 'echarts';

export default {
  name: 'App',
  mounted() {
    // 基于准备好的dom,初始化echarts实例
    var myChart = echarts.init(document.getElementById('main'));

    // 绘制图表
    myChart.setOption({
      tooltip: {},
      title: {
        text: '基本饼图'
      },

      series: [
        {
          name: '总消费',
          type: 'pie',
          data: [
            {
              value: 324,
              name: '电子产品'
            },
            {
              value: 234,
              name:'食品'
            },{
              value: 154,
              name:'生活用品'
            },
            {
              value: 1048,
              name:'其他'
            }
        ],
        },

      ]
    });
  }
}
</script>
--圆环图
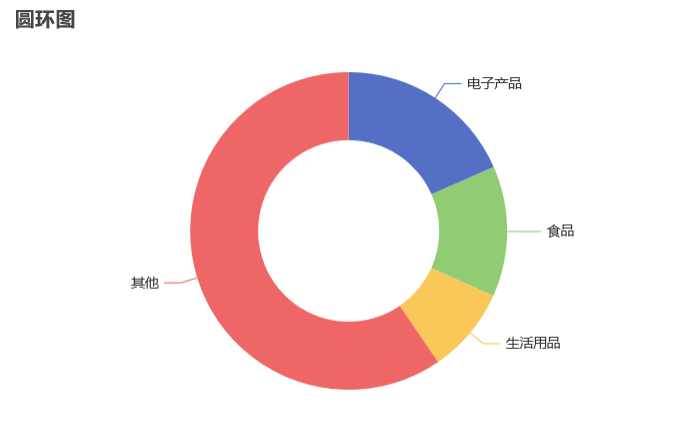
html
<template>
  <div id="app">
    <div id="main" style="width: 600px;height:400px;"></div>
  </div>
</template>

<script>
import * as echarts from 'echarts';

export default {
  name: 'App',
  mounted() {
    // 基于准备好的dom,初始化echarts实例
    var myChart = echarts.init(document.getElementById('main'));

    // 绘制图表
    myChart.setOption({
      tooltip: {},
      title: {
        text: '圆环图'
      },
      series: [
        {
          name: '总消费',
          type: 'pie',
          data: [
            {
              value: 324,
              name: '电子产品'
            },
            {
              value: 234,
              name:'食品'
            },{
              value: 154,
              name:'生活用品'
            },
            {
              value: 1048,
              name:'其他'
            }
        ],
        radius: ['40%', '70%']
        },
      ]
    });
  }
}
</script>
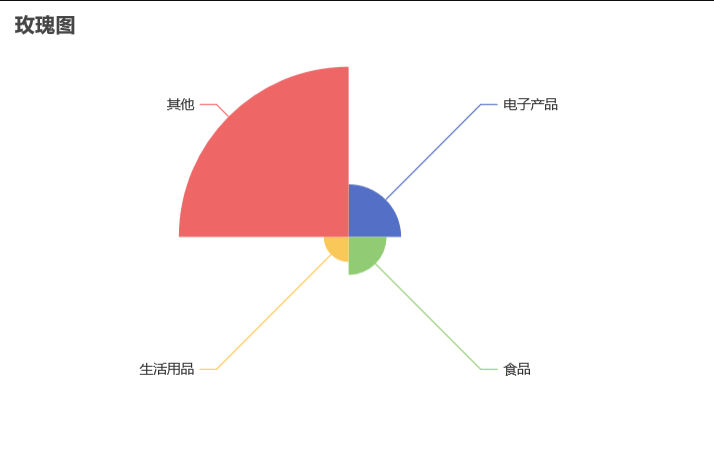
--玫瑰图
html
<template>
  <div id="app">
    <div id="main" style="width: 600px;height:400px;"></div>
  </div>
</template>

<script>
import * as echarts from 'echarts';

export default {
  name: 'App',
  mounted() {
    // 基于准备好的dom,初始化echarts实例
    var myChart = echarts.init(document.getElementById('main'));

    // 绘制图表
    myChart.setOption({
      tooltip: {},
      title: {
        text: '玫瑰图'
      },
      series: [
        {
          name: '总消费',
          type: 'pie',
          data: [
            {
              value: 324,
              name: '电子产品'
            },
            {
              value: 234,
              name:'食品'
            },{
              value: 154,
              name:'生活用品'
            },
            {
              value: 1048,
              name:'其他'
            }
        ],
         roseType: 'area'
        },
      ]
    });
  }
}
</script>
3.4 散点图(type:'scatter')
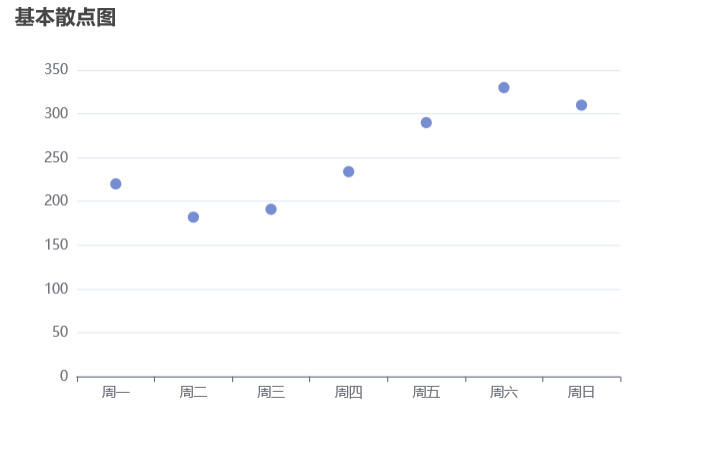
--基本散点图
html
<template>
  <div id="app">
    <div id="main" style="width: 600px;height:400px;"></div>
  </div>
</template>

<script>
import * as echarts from 'echarts';

export default {
  name: 'App',
  mounted() {
    // 基于准备好的dom,初始化echarts实例
    var myChart = echarts.init(document.getElementById('main'));

    // 绘制图表
    myChart.setOption({
      tooltip: {},
      title: {
        text: '基本散点图'
      },
      xAxis: {
        data: ['周一', '周二', '周三', '周四', '周五', '周六', '周日']
      },
      yAxis: {},

      series: [
        {
         type:'scatter',
         data: [220, 182, 191, 234, 290, 330, 310]
        },
      ]
    });
  }
}
</script>