一、h5在做可视化地图时,用高德地图绘制空域(圆形,线,多边形),碰到一个需求,根据绘制出来的图形给对应的空域列表项添加一个缩略图。
二、确定实现方法
要根据绘制的图形生成对应图形的缩略图,有两种方式,一是使用高德地图给每个列表项绘制对应的图形,二是自己实现。第一种方法性能差,要是自己实现,我这边选择的是canvas画布。难点:后台返回的是经纬度数据不是canvas坐标系数据,我们需要根据经纬度转化为我们所设计的画布大小的坐标系数据。
三、代码实现
import React, { useRef, useEffect, useState } from "react";

export default function GeneratePolygon({ type, coordinates }) {
  const canvasRef = useRef(null);
  const [context, setContext] = useState(null);

  useEffect(() => {
    const canvas = canvasRef.current;
    const ctx = canvas.getContext("2d");
    // console.log('ctx',ctx)
    // 设置Canvas大小
    canvas.width = 100;
    canvas.height = 100;

    // 将经纬度转换为Canvas坐标
    const toCanvasCoords = (lng, lat) => {
      // debugger;
      if (coordinates.length && coordinates.length > 1) { // length为1为圆否则就是多边形和线
        const lons = coordinates.map((item) => item.lng);
        const lats = coordinates.map((item) => item.lat);
        const lonMax = Math.max(...lons);
        const lonMin = Math.min(...lons);
        const latMax = Math.max(...lats);
        const latMin = Math.min(...lats);
        const lonScale = lonMax === lonMin ? 1 : canvas.width / (lonMax - lonMin);
        const latScale = latMax === latMin ? 1 : canvas.height / (latMax - latMin);

        // 不让图形超出和贴边,x=0 x=100,y=0 y=100两种情况时自己挪一点
        const x = ((lng - lonMin) * lonScale) == 0 ? 2 : ((lng - lonMin) * lonScale)>= canvas.width ? canvas.width-2 : (lng - lonMin) * lonScale;
        const y = (canvas.height - (lat - latMin) * latScale) == 0 ? 2 : (canvas.height - (lat - latMin) * latScale) >= canvas.height ? canvas.height-2 : canvas.height - (lat - latMin) * latScale;
        if(lonMax === lonMin){
          return {x: canvas.width/2, y}
        }else if(latMax === latMin){
          return {x, y: canvas.height/2}
        }else{
          return { x, y };
        }
      } else {
        return { x: canvas.width / 2, y: canvas.height / 2 };
      }
    };
    // 根据type绘制不同的图形
    if (type === "2" && coordinates && coordinates.length > 1) {
      ctx.beginPath();
      coordinates.forEach((coord) => {
        const { x, y } = toCanvasCoords(coord.lng, coord.lat);
        if (ctx._firstPoint === undefined) {
          ctx._firstPoint = { x, y };
          ctx.moveTo(x, y);
        } else {
          ctx.lineTo(x, y);
        }
      });
      // 闭合多边形路径
      ctx.lineTo(
        toCanvasCoords(coordinates[0].lng, coordinates[0].lat).x,
        toCanvasCoords(coordinates[0].lng, coordinates[0].lat).y
      );
      ctx.fillStyle = "rgba(5,95,231,0.20)"; // 填充色
      ctx.strokeStyle = "#055FE7"; // 边框色
      ctx.lineWidth = 2;
      ctx.scale(1, 1);
      ctx.stroke();
      ctx.fill();
    } else if (type === "1" && coordinates && coordinates.length === 1) {
      const { lng, lat } = coordinates[0]; // 获取圆心的经纬度
      const cx = toCanvasCoords(lng, lat).x;
      const cy = toCanvasCoords(lng, lat).y;
      ctx.beginPath();
      ctx.arc(cx, cy, 45, 0, Math.PI * 2); // 绘制圆形
      ctx.fillStyle = "rgba(5,95,231,0.20)"; // 填充色
      ctx.strokeStyle = "#055FE7"; // 边框色
      ctx.lineWidth = 2;
      ctx.stroke();
      ctx.fill();
    } else if (type === "3" && coordinates && coordinates.length) {
      ctx.beginPath();
      coordinates.forEach(coord=>{
        ctx.lineTo(toCanvasCoords(coord.lng, coord.lat).x, toCanvasCoords(coord.lng, coord.lat).y);
      })
      ctx.strokeStyle = "#055FE7";
      ctx.lineWidth = 2;
      ctx.stroke();
    }

    setContext(ctx);
  }, [type, coordinates]); // 依赖type和coordinates的变化来重绘

  return (
    <canvas
      ref={canvasRef}
      style={{ height: "100px", width: "100px" }}
    />
  );
}
四、使用
<GeneratePolygon
  type={item?.type}
  coordinates={
    item?.polygonPoint ? JSON.parse(item?.polygonPoint) : []
  }
/>
五、效果
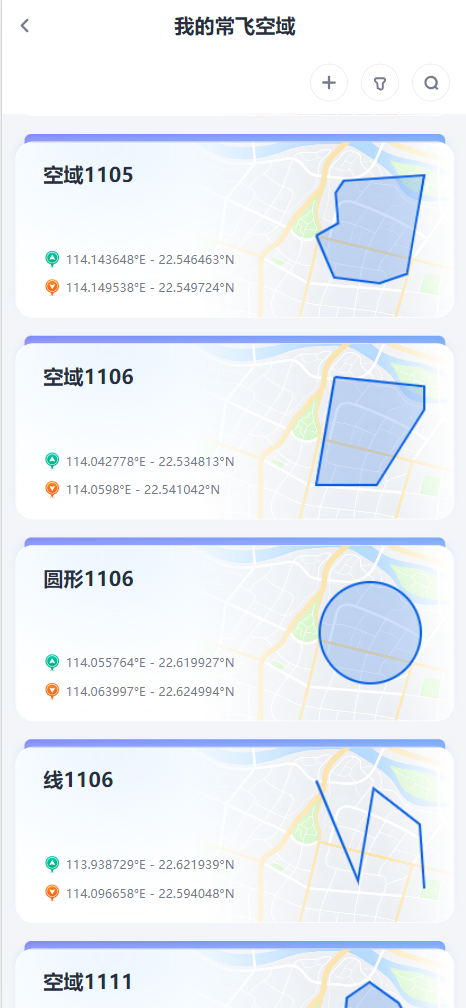
这样就生成了相对应的缩略图了,需要注意的是要处理坐标的边界值问题,不然会有贴边效果不太好看,over。