看过的知识不等于学会。唯有用心总结、系统记录,并通过温故知新反复实践,才能真正掌握一二
作为一名摸爬滚打三年的前端开发,开源社区给了我饭碗,我也将所学的知识体系回馈给大家,助你少走弯路!
OpenLayers、Leaflet 快速入门 ,每周保持更新 2 个案例
Cesium 快速入门,每周保持更新 4 个案例
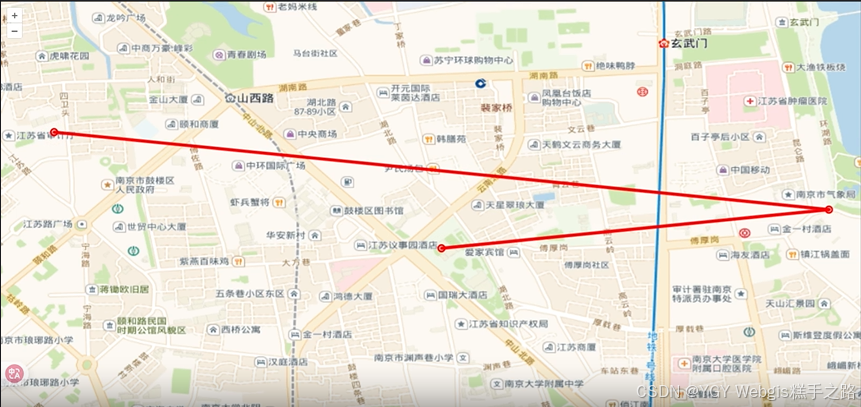
OpenLayers 综合案例-动态闪烁
Vue 3 + OpenLayers 实现的 WebGIS 应用提供了完整的动态闪烁功能
主要功能
- 通过postrender事件监听实现点位半径渐变和线段透明度变化的动画效果,使用getVectorContext获取绘制上下文。
- 采用高德地图底图,支持自定义动画参数
技术栈
该环境下代码即拿即用
bash
Vue 3.5.13+
OpenLayers 10.5.0+
Vite 6.3.5+
vue
<template>
  <div ref="mapContainer" id="map"></div>
</template>

<script setup>
import { ref, onMounted } from "vue";
import Map from "ol/Map.js";
import XYZ from "ol/source/XYZ.js";
import TileLayer from "ol/layer/Tile.js";
import VectorLayer from "ol/layer/Vector.js";
import VectorSource from "ol/source/Vector.js";
import Feature from "ol/Feature.js";
import Point from "ol/geom/Point.js";
import LineString from "ol/geom/LineString.js";
import { Style, Circle, Stroke } from "ol/style.js";
import { getVectorContext } from "ol/render.js"; // 获取用于在事件画布上绘制的矢量上下文
import View from "ol/View.js";
import "ol/ol.css";

const mapContainer = ref(null);
let map = null;
let pointLayer = null;
let lineLayer = null;
let pointFeatures = [];
let lineFeatures = [];

// 动画参数
let pointRadius = 0;
let lineOpacity = 1;
let lineDirection = -1;

onMounted(() => {
  // 初始化地图
  map = new Map({
    target: mapContainer.value,
    layers: [
      new TileLayer({
        source: new XYZ({
          url: "https://webrd04.is.autonavi.com/appmaptile?lang=zh_cn&size=1&scale=1&style=7&x={x}&y={y}&z={z}",
        }),
      }),
    ],
    view: new View({
      center: [118.7784, 32.0647],
      zoom: 16,
      projection: "EPSG:4326",
    }),
  });

  // 创建点位要素
  const point1 = new Feature({ geometry: new Point([118.7784, 32.0647]) });
  const point2 = new Feature({ geometry: new Point([118.7884, 32.0657]) });
  const point3 = new Feature({ geometry: new Point([118.7684, 32.0677]) });
  pointFeatures = [point1, point2, point3];

  // 创建线段要素
  const line1 = new Feature({
    geometry: new LineString([
      [118.7784, 32.0647],
      [118.7884, 32.0657],
    ]),
  });
  const line2 = new Feature({
    geometry: new LineString([
      [118.7884, 32.0657],
      [118.7684, 32.0677],
    ]),
  });
  lineFeatures = [line1, line2];

  // 创建点位图层
  pointLayer = new VectorLayer({
    source: new VectorSource({ features: pointFeatures }),
    style: new Style({
      image: new Circle({
        radius: 5,
        stroke: new Stroke({ color: "#ff0000", width: 2 }),
      }),
    }),
  });

  // 创建线段图层
  lineLayer = new VectorLayer({
    source: new VectorSource({ features: lineFeatures }),
    style: new Style({
      stroke: new Stroke({ color: "#ff0000", width: 3 }),
    }),
  });

  map.addLayer(pointLayer);
  map.addLayer(lineLayer);

  // 点位闪烁动画
  pointLayer.on("postrender", (evt) => {
    if (pointRadius >= 20) pointRadius = 0;

    const opacity = (20 - pointRadius) * (1 / 20);
    const pointStyle = new Style({
      image: new Circle({
        radius: pointRadius,
        stroke: new Stroke({
          color: `rgba(255,0,0,${opacity})`,
          width: 3 - pointRadius / 10,
        }),
      }),
    });

    const vectorContext = getVectorContext(evt);
    vectorContext.setStyle(pointStyle);
    pointFeatures.forEach((feature) => {
      vectorContext.drawGeometry(feature.getGeometry());
    });

    pointRadius += 0.3;
    map.render();
  });

  // 线段闪烁动画
  lineLayer.on("postrender", (evt) => {
    if (lineOpacity <= 0.2) lineDirection = 1;
    if (lineOpacity >= 1) lineDirection = -1;

    lineOpacity += lineDirection * 0.05;

    const lineStyle = new Style({
      stroke: new Stroke({
        color: `rgba(255,0,0,${lineOpacity})`,
        width: 5,
      }),
    });

    const vectorContext = getVectorContext(evt);
    vectorContext.setStyle(lineStyle);
    lineFeatures.forEach((feature) => {
      vectorContext.drawGeometry(feature.getGeometry());
    });

    map.render();
  });
});
</script>

<style scoped>
#map {
  width: 100vw;
  height: 100vh;
}
</style>