PathGradientBrush:
用于创建路径(或形状)渐变填充的画刷;
用渐变的效果填充图形,渐变的方向是从由路径定义的图形边界指向图形的中心。
PathGradientBrush的父类是Brush:
用来填充图形(如形状或文本)内部区域的对象。在.NET框架中,画刷是System.Drawing命名空间的一部分,通常用于GDI+绘图操作。
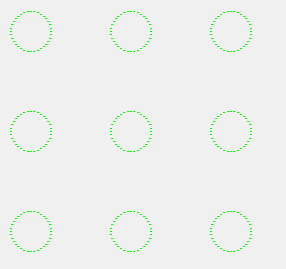
使用效果:

在winform中生成九圆阵列,每一个圆就是一个由PathGradientBrush填充的图案。
准备:
需要一个panel控件承载Bitmap,实际上是在Bitmap上画图案。比较简单这里不展示。
需要九个圆的位置,代码:
cs
 public List<HeatPoint> GetTestPointList()
 {
     // 参数配置
     int startX = 30;      // 起点X
     int startY = 30;      // 起点Y
     int spacing = 100;    // 点间距
     int rows = 3;        // 行数
     int cols = 3;        // 列数

    return  GeneratePointGrid(startX, startY, spacing, rows, cols);

 }
 /// <summary>
 /// 生成均匀点阵
 /// </summary>
 public  List<HeatPoint> GeneratePointGrid(int startX, int startY, int spacing, int rows, int cols)
 {
     List<HeatPoint> grid = new List<HeatPoint>();
     for (int row = 0; row < rows; row++)
     {
         for (int col = 0; col < cols; col++)
         {
             int x = startX + col * spacing;
             int y = startY + row * spacing;
             grid.Add(new HeatPoint(x, y));
         }
     }
     return grid;
 }
生成:
cs
Bitmap bitmap1 = CreateIntensityMask(new Bitmap((int)panel1.Width, (int)panel1.Height, System.Drawing.Imaging.PixelFormat.Format32bppArgb), HeatPoints);
cs
 private Bitmap CreateIntensityMask(Bitmap bitmap, List<HeatPoint> aHeatPoints)
 {
     //从Bitmap获得Graphics GDI+ 绘图图面
     Graphics graphics = Graphics.FromImage(bitmap);
     //清除整个绘图面并以白色填充
     graphics.Clear(System.Drawing.Color.White);
     //绘制图案
     foreach (HeatPoint point in aHeatPoints)
     {
         DrawHeatPoint(graphics, point);
     }
     return bitmap;
 }
cs
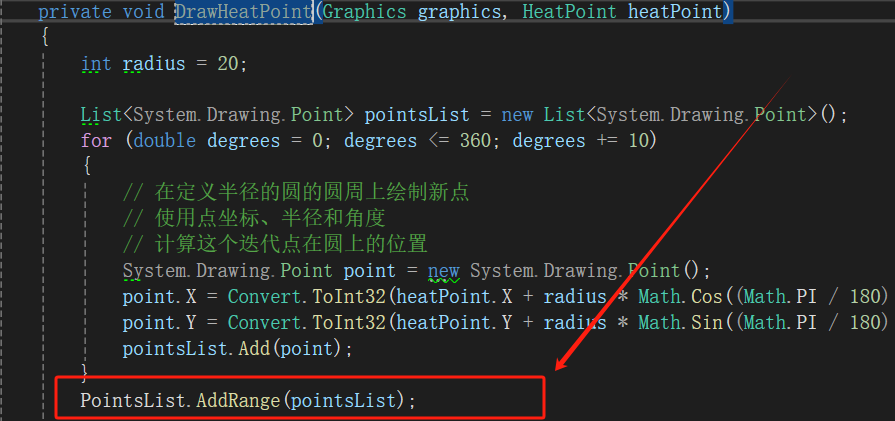
 private void DrawHeatPoint(Graphics graphics, HeatPoint heatPoint)
 {
     //半径
     int radius = 20;

     List<System.Drawing.Point> pointsList = new List<System.Drawing.Point>();
     for (double degrees = 0; degrees <= 360; degrees += 10)
     {
         // 在定义半径的圆的圆周上绘制新点
         // 使用点坐标、半径和角度
         // 计算这个迭代点在圆上的位置
         System.Drawing.Point point = new System.Drawing.Point();
         point.X = Convert.ToInt32(heatPoint.X + radius * Math.Cos((Math.PI / 180) * degrees));
         point.Y = Convert.ToInt32(heatPoint.Y + radius * Math.Sin((Math.PI / 180) * degrees));
         pointsList.Add(point);
     }

     // 创建新的颜色混合来告诉 PathGradientBrush 使用什么颜色以及放置它们的位置
     ColorBlend colorBlend = new ColorBlend(3);

     colorBlend.Positions = new float[3] { 0, 0.8f, 1 };
     colorBlend.Colors = new System.Drawing.Color[3]
     {
         System.Drawing.Color.FromArgb(0, System.Drawing.Color.White),
         System.Drawing.Color.FromArgb(heatPoint.Intensity, System.Drawing.Color.Black),
         System.Drawing.Color.FromArgb(heatPoint.Intensity, System.Drawing.Color.Black)
     };

     // 创建新的 PathGradientBrush 以使用圆周点创建径向渐变
     PathGradientBrush brush = new PathGradientBrush(pointsList.ToArray());
     // 将颜色混合传递给 PathGradientBrush 以指示它如何生成渐变
     brush.InterpolationColors = colorBlend;
     graphics.FillPolygon(brush, pointsList.ToArray());
 }
其中ColorBlend 类指定渐变效果。
顺带看一下graphics.FillPolygon(brush, pointsList.ToArray())中的pointsList是怎样分布的:
定义一个新的panel,编写一个新方法:
cs
public void DrawSonPoints(List<System.Drawing.Point> pointsList)
{
    Bitmap bitmap = new Bitmap((int)panel2.Width, (int)panel2.Height, System.Drawing.Imaging.PixelFormat.Format32bppArgb);
    Graphics graphics = Graphics.FromImage(bitmap);
    System.Drawing.Brush brush = new SolidBrush(Color.FromArgb(0, 255, 0));//设置画刷的颜色为绿色
    foreach (var point in pointsList)
    {
        graphics.FillEllipse(brush, point.X, point.Y, 2, 2); //画一个椭圆,并用绿色填充
    }

    panel2.BackgroundImage = bitmap;

}
定义一个新属性:public List<System.Drawing.Point> PointsList = new List<Point>();
在绘图方法里接收路径点位集合,然后调用 DrawSonPoints呈现:
相关类:
cs
 public class HeatPoint
 {
     public int X;
     public int Y;
     public byte Intensity;
     public HeatPoint(int iX, int iY, byte bIntensity)
     {
         X = iX;
         Y = iY;
         Intensity = bIntensity;
     }
     public HeatPoint(int iX, int iY)
     {
         X = iX;
         Y = iY;
     }
 }
参考:
C# .Net实现简易灰度图和酷炫HeatMap热力图winform(进阶)_c# 热力图-CSDN博客