问题
visualMap如何添加一个渐变的外边框?

实现
- 创建初始模板
jsx
import { useEffect } from "react";
import * as echarts from "echarts";
import styles from "./page.module.css";
export default function Home() {
useEffect(() => {
// 初始化图表实例
const chart = echarts.init(document.getElementById("main"));
// 配置图表选项
const options = {
title: {
text: "ECharts Entry Example",
},
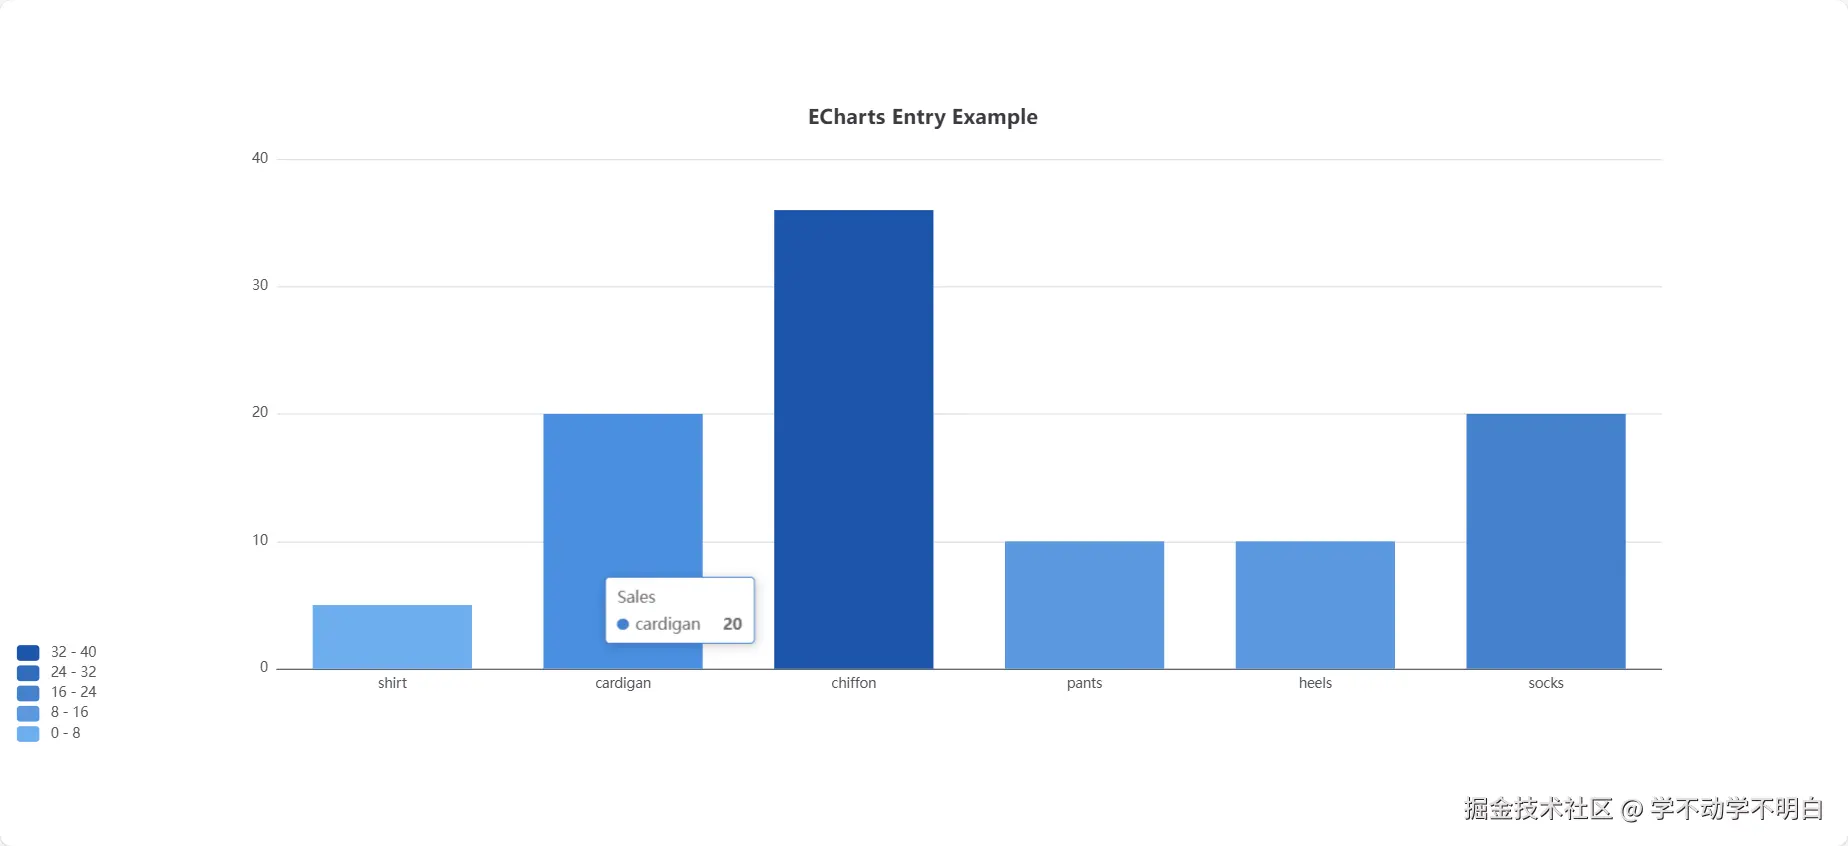
tooltip: {},
xAxis: {
data: ["shirt", "cardigan", "chiffon", "pants", "heels", "socks"],
},
yAxis: {},
visualMap: {
type: "piecewise", // piecewise: 分段型; continuous: 连续型
min: 0,
max: 40,
itemGap: 4, // 设置段间距
inRange: {
color: ["#6eaeefff", "#1c55abff"],
},
},
series: [
{
name: "Sales",
type: "bar",
data: [5, 20, 36, 10, 10, 20],
},
],
};
// 设置图表选项
chart.setOption(options);
}, []);
return (
<div className={styles.page}>
<div
id="main"
className={styles.main}
style={{ width: "100%", height: "600px"}}
></div>
</div>
);
}
- 创建一个自定义框使用
graphic元素
arduino
const options = {
// 其他配置项
// ......
// 自定义图形元素
graphic: [
{
type: "rect", // 图形类型矩形
// 图形位置以及大小, 默认左上角
shape: {
x: 10,
y: 490,
width: 30,
height: 100,
},
style: {
fill: "transparent", // 内容填充为透明, 默认黑色的
lineWidth: 2, // 边框宽度
stroke: new echarts.graphic.LinearGradient(0, 0, 0, 1, [
{ offset: 1, color: "#4589DC66" },
{ offset: 0, color: "#4589DCFF" },
]), // 线性渐变
},
},
]
};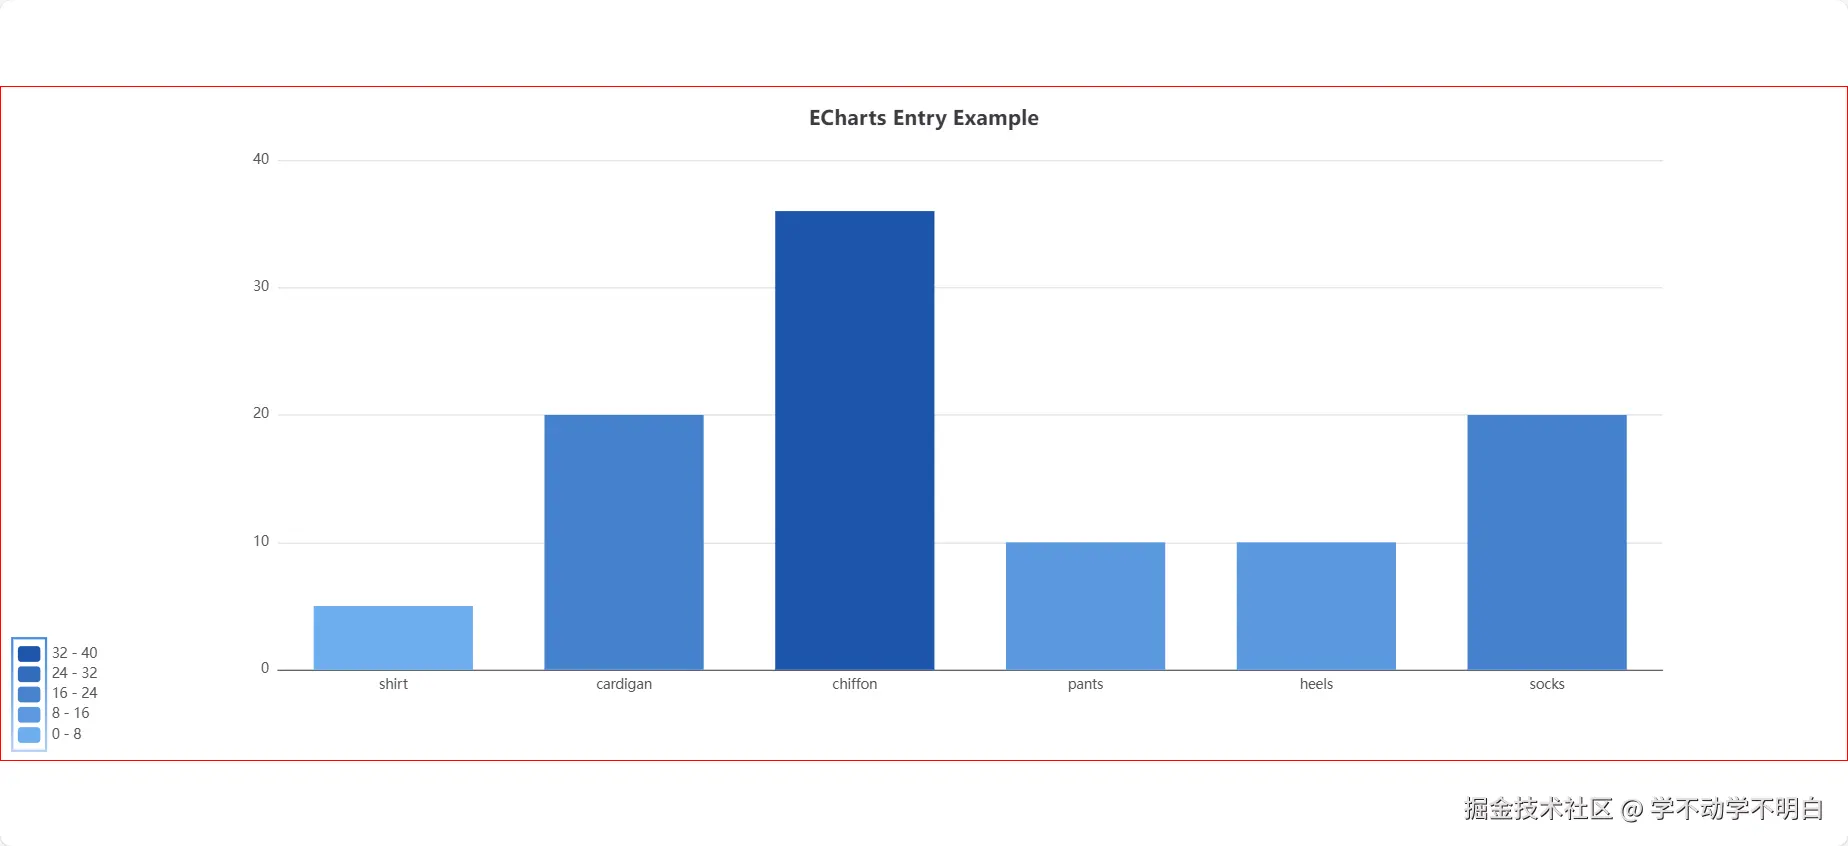 这样就可以了。但是还是有一个问题,我这里写的定位是固定的,一旦有要响应式的展示,那么固定的就无法满足我们的要求了,所以我们要添加一个响应式的计算,保证位置一致是正确的。
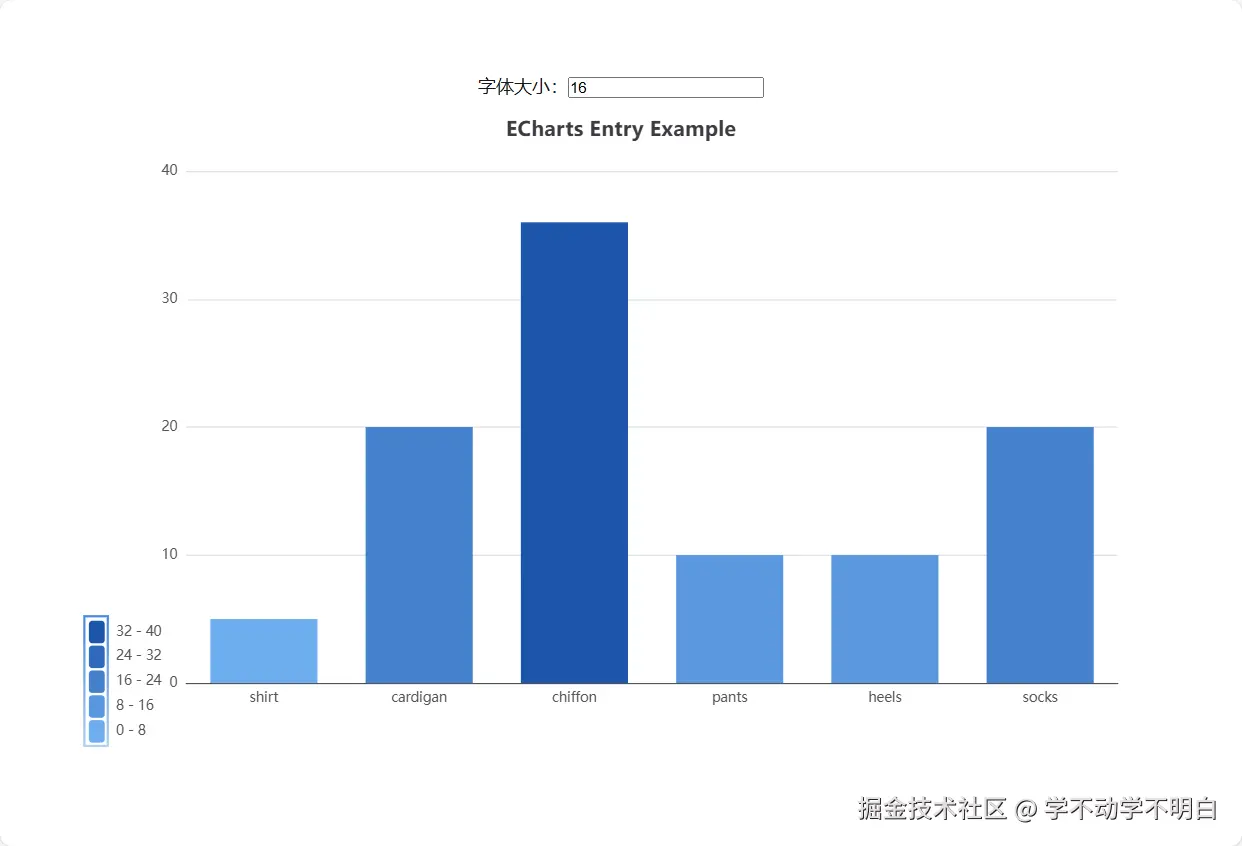
响应式的计算
- 采用
rem的方式要计算出初始的字体大小 - 根据字体的大小来计算每一块的位置以及宽高
处理
jsx
"use client";
import { useEffect, useState } from "react";
import * as echarts from "echarts";
import styles from "./page.module.css";
export default function Home() {
// TODO: 改动-添加
// =========================================
const [fontSize, setFontSize] = useState(16);
// =========================================
useEffect(() => {
// 初始化图表实例
const chart = echarts.init(document.getElementById("main"));
// 自定义框,位置计算处理 TODO: 改动-添加
// ===================================================
const chartHeightValue = chart.getHeight(); // DOM 高度
// 视觉映射位置计算
const visualMapLeftValue = 4 * fontSize;
const visualMapBottomValue = 0.75 * fontSize;
const visualMapHeightValue = 1.25 * fontSize;
const visualMapGapValue = 0.13 * fontSize;
const visualMapTop =
chartHeightValue -
visualMapBottomValue -
(visualMapHeightValue * 5 + visualMapGapValue * 4);
// ===================================================
// 配置图表选项
const options = {
title: {
text: "ECharts Entry Example",
},
tooltip: {},
xAxis: {
data: ["shirt", "cardigan", "chiffon", "pants", "heels", "socks"],
},
yAxis: {},
visualMap: {
type: "piecewise", // piecewise: 分段型; continuous: 连续型
min: 0,
max: 40,
// TODO: 改动-修改
// =============================================
left: visualMapLeftValue,
bottom: visualMapBottomValue,
itemWidth: 0.88 * fontSize,
itemHeight: visualMapHeightValue,
itemGap: visualMapGapValue, // 图例每项之间的间隔
// =============================================
inRange: {
color: ["#6eaeefff", "#1c55abff"],
},
},
// 自定义图形元素
graphic: [
{
type: "rect", // 图形类型矩形
// 图形位置以及大小, 默认左上角
shape: {
// TODO: 改动-修改
// =========================
x: visualMapLeftValue + 11,
y: visualMapTop - 19,
width: fontSize * 1.3,
height: fontSize * 7.2,
// ========================
},
style: {
fill: "transparent", // 内容填充为透明, 默认黑色的
lineWidth: 2, // 边框宽度
stroke: new echarts.graphic.LinearGradient(0, 0, 0, 1, [
{ offset: 1, color: "#4589DC66" },
{ offset: 0, color: "#4589DCFF" },
]), // 线性渐变
},
},
],
series: [
{
name: "Sales",
type: "bar",
data: [5, 20, 36, 10, 10, 20],
},
],
};
// 设置图表选项
chart.setOption(options);
}, [fontSize]);
return (
<div className={styles.page}>
{/* TODO: 改动-添加 */}
{/* =================================================== */}
<div>
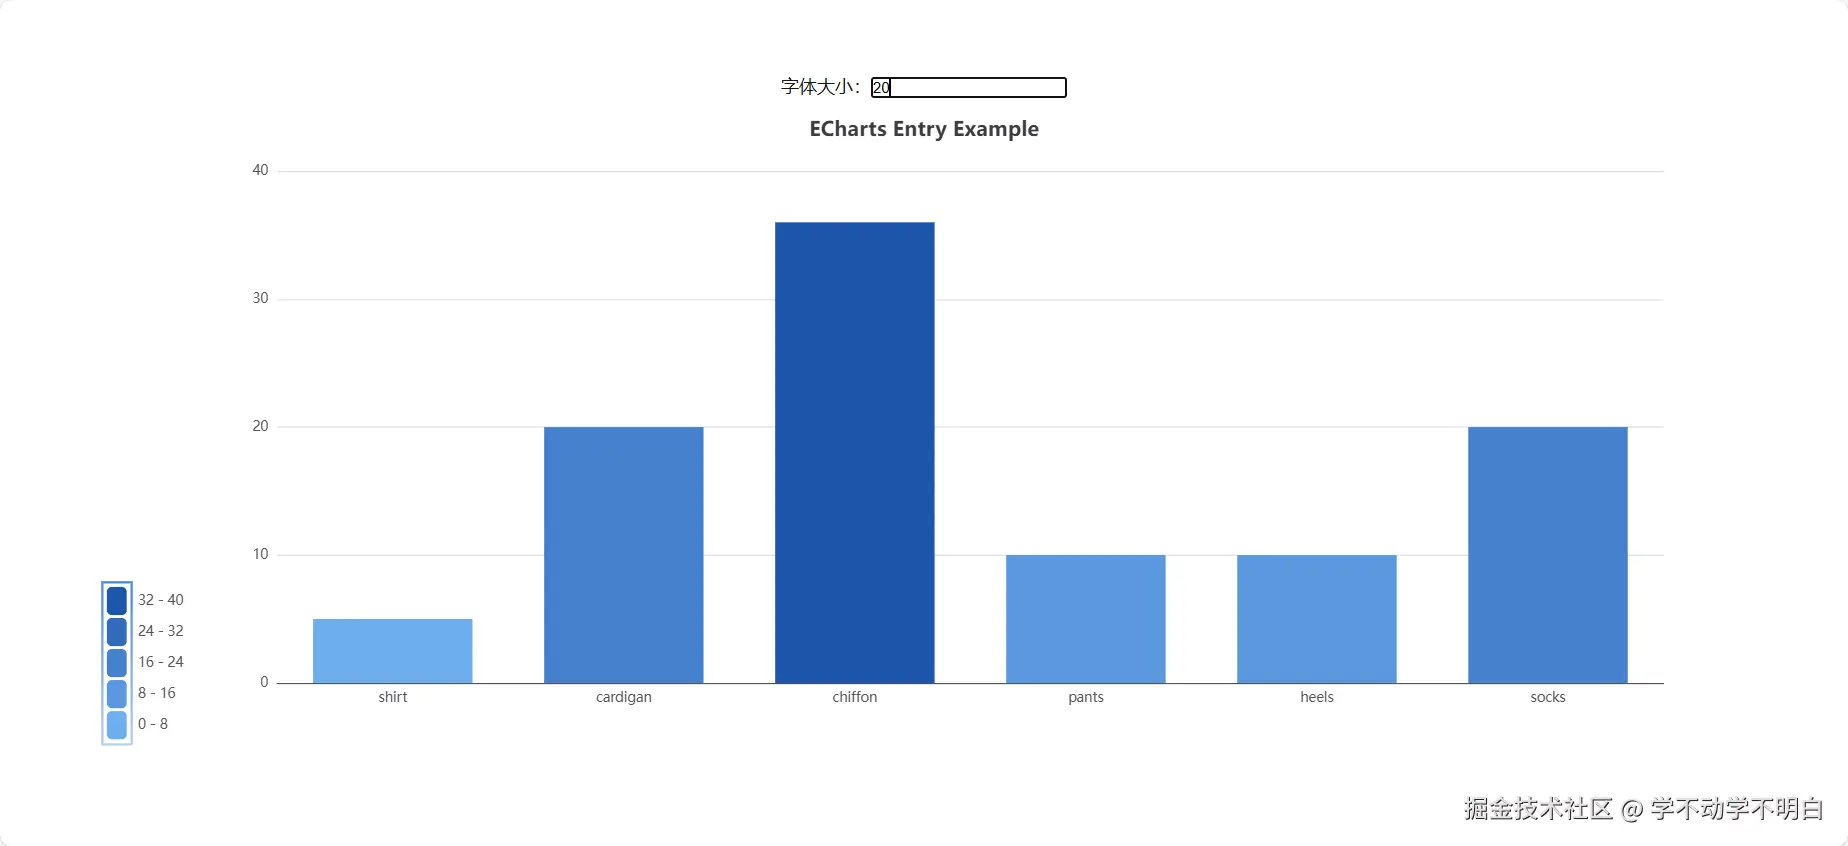
字体大小:
<input
value={fontSize}
onChange={(e) => setFontSize(+e.target.value)}
/>
</div>
{/* ================================================= */}
<div
id="main"
className={styles.main}
style={{ width: "100%", height: "600px" }}
></div>
</div>
);
}