Next.js 作为现代 React 全栈框架,其 App Router 架构引入了 Server Components、Route Handlers、Server Actions 等服务端能力,使得调试方式与传统前端项目有所不同。本文将手把手教你如何在 VS Code 中高效调试 Next.js(v13+ App Router)应用,覆盖客户端、服务端、API 路由等关键场景。
一、准备工作
1. 确保开发环境
- Node.js ≥ 18.17
- Next.js ≥ 13(使用 App Router)
- VS Code 最新版
二、调试客户端代码(React 组件、Hooks)
步骤 1:启动 Next.js 开发服务器
bash
npm run dev
# 默认端口 3000
步骤 2:配置 .vscode/launch.json
launch.json是vscode用来调试的配置文件,可以手动创建这个文件
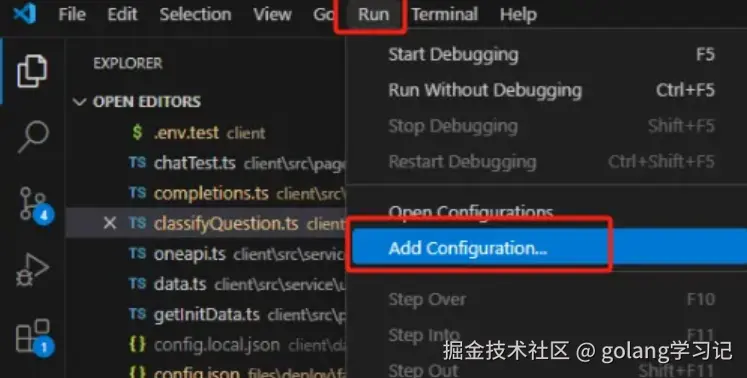
在项目根目录创建 .vscode/launch.json:
json
{
  "version": "0.2.0",
  "configurations": [
    {
      "name": "Next.js: debug server-side",
      "type": "node-terminal",
      "request": "launch",
      "command": "npm run dev"
    },
    {
      "name": "Next.js: debug client-side",
      "type": "chrome",
      "request": "launch",
      "url": "http://localhost:3000"
    },
    {
      "name": "Next.js: debug client-side (Firefox)",
      "type": "firefox",
      "request": "launch",
      "url": "http://localhost:3000",
      "reAttach": true,
      "pathMappings": [
        {
          "url": "webpack://_N_E",
          "path": "${workspaceFolder}"
        }
      ]
    },
    {
      "name": "Next.js: debug full stack",
      "type": "node",
      "request": "launch",
      "program": "${workspaceFolder}/node_modules/next/dist/bin/next",
      "runtimeArgs": ["--inspect"],
      "skipFiles": ["<node_internals>/**"],
      "serverReadyAction": {
        "action": "debugWithEdge",
        "killOnServerStop": true,
        "pattern": "- Local:.+(https?://.+)",
        "uriFormat": "%s",
        "webRoot": "${workspaceFolder}"
      }
    }
  ]
}
在 "Next.js:调试全栈" 配置中,serverReadyAction.action 用于指定当服务器就绪时要打开哪个浏览器。debugWithEdge 表示启动 Edge 浏览器。如果你使用的是 Chrome,需要将此值更改为 debugWithChrome。
然后就可以开始debug
步骤 3:在组件中设置断点
tsx
// app/page.tsx
'use client'
export default function HomePage() {
const handleClick = () => {
console.log('Button clicked') // 👈 在此行左侧点击设置断点
alert('Hello')
}
return <button onClick={handleClick}>Click me</button>
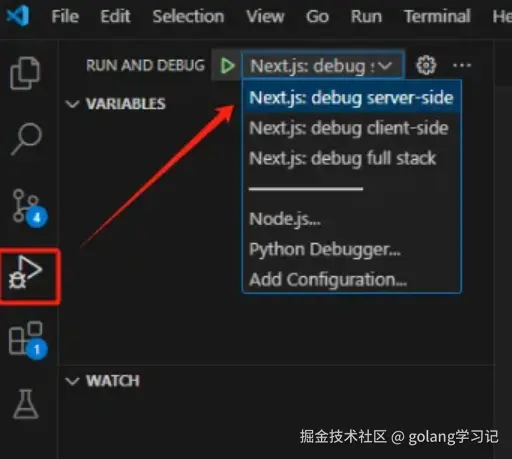
}步骤 4:启动调试
- 按
F5或点击 VS Code 左侧「运行和调试」图标 - 选择 Debug Client in Chrome
- 浏览器自动打开,点击按钮即可触发断点
💡 提示:确保代码中使用了
'use client'指令,否则组件不会在客户端执行。
三、调试服务端代码(Server Components / Route Handlers)
Next.js 的服务端代码(如 app/api/route.ts、Server Component)无法通过浏览器调试 ,需使用 Node.js 调试器。
方法:使用 --inspect 启动 Next.js
步骤 1:修改 package.json
json
{
  "scripts": {
    "dev:debug": "NODE_OPTIONS='--inspect' next dev"
  }
}
Windows 用户请使用:
json
"dev:debug": "set NODE_OPTIONS=--inspect && next dev"步骤 2:启动调试模式
bash
npm run dev:debug
# 输出:Debugger listening on ws://127.0.0.1:9229/...
步骤 3:配置 VS Code 调试器
在 launch.json 中添加:
json
{
  "name": "Debug Server",
  "type": "node",
  "request": "attach",
  "port": 9229,
  "restart": true,
  "skipFiles": ["<node_internals>/**"]
}
步骤 4:设置断点并触发
例如调试 API 路由:
ts
// app/api/hello/route.ts
import { NextResponse } from 'next/server'

export async function GET() {
  const data = { message: 'Hello from server' } // 👈 在此行设断点
  console.log('API called')
  return NextResponse.json(data)
}- 在 VS Code 中按
F5,选择 Debug Server - 访问
http://localhost:3000/api/hello - 断点命中,可查看变量、调用栈、表达式求值
四、调试 Server Actions
Server Actions 本质是服务端函数,调试方式与 Route Handlers 相同。
tsx
// app/actions.ts
'use server'

export async function submitForm(formData: FormData) {
  const name = formData.get('name') // 👈 设断点
  console.log('Form submitted:', name)
  return { success: true }
}
✅ 同样使用
NODE_OPTIONS='--inspect'+ attach 调试器即可。
五、高级技巧
1. 条件断点 & 日志断点
- 右键断点 → Edit Breakpoint → 输入条件(如
name === 'admin') - 或直接输入
console.log(name)作为日志断点,不中断执行
2. 调试环境变量
在 launch.json 中注入环境变量:
json
{
  "name": "Debug Server",
  "type": "node",
  "request": "attach",
  "port": 9229,
  "env": {
    "DEBUG_MODE": "true"
  }
}
3. 跳过 node_modules
在 launch.json 中添加:
json
"skipFiles": [
  "<node_internals>/**",
  "**/node_modules/**"
]
六、常见问题排查
| 问题 | 解决方案 |
|---|---|
| 断点未命中(灰色) | 检查 sourcemap 是否生成;确认代码是否实际执行 |
| 无法 attach 到 9229 | 确保没有其他进程占用;重启终端 |
| Server Component 断点无效 | Server Components 在构建时执行,需在 generateStaticParams 或动态路由中调试 |
| 调试器卡住 | 尝试关闭所有 Chrome 实例,或换用 pwa-msedge |
七、总结
| 调试目标 | 推荐方式 |
|---|---|
| 客户端组件 | VS Code + Chrome 调试器(pwa-chrome) |
| Route Handlers / Server Actions | NODE_OPTIONS=--inspect + Node attach |
| 中间件(Middleware) | 同服务端方式 |
| 静态生成(SSG)逻辑 | 需在 next build 时调试,建议改用 dynamic 路由临时测试 |
通过合理配置 VS Code 调试器,你可以像调试普通 Node.js 或前端项目一样,高效排查 Next.js 应用中的各类问题。
Happy Debugging! 🐞