OpenLayers 是一个功能强大、开源、免费的 JavaScript 地图库,用于在 Web 浏览器中创建交互式地图应用。它支持加载多种地图源(如 OpenStreetMap、Google Maps、Bing、WMS、矢量数据等),并提供丰富的地图交互、图层控制、空间分析和自定义功能。
官网: openlayers.org/
1、概念介绍
GeoJSON: 是一种基于 JSON(JavaScript Object Notation) 的开放标准格式,是一个 JSON 对象,用于表示地理空间数据(矢量数据)。它被广泛用于 Web 地图、GIS(地理信息系统)、移动应用和空间数据分析中
EPSG:4326: WGS84 地理坐标系 ,存储地理数据(如 GPS 定位、原始 GeoJSON),数据文件中记录的经纬度(如 116.404, 39.915)
EPSG:3857: Web 墨卡托投影坐标系,地图显示(将球面坐标转为平面像素),主流 Web 地图(Google、高德、OpenStreetMap)的显示坐标系
2、代码示例
1、初始化一个地图实例
js
import OlMap from 'ol/Map.js';
import { fromLonLat } from 'ol/proj';
let map;
function initMap() {
map = new OlMap({
target: container.value, // 地图要渲染到的 DOM 元素
// 地图图层列表
layers: [],
// 定义地图的视图(视角),包括中心点、缩放级别、投影等
view: new View({
center: fromLonLat([105, 35]), // 将 EPSG:4326 坐标转换为 OpenLayers 默认使用的 EPSG:3857(Web 墨卡托投影)
zoom: 3, // 缩放值,适合显示大范围区域(如整个中国或亚洲)
}),
});
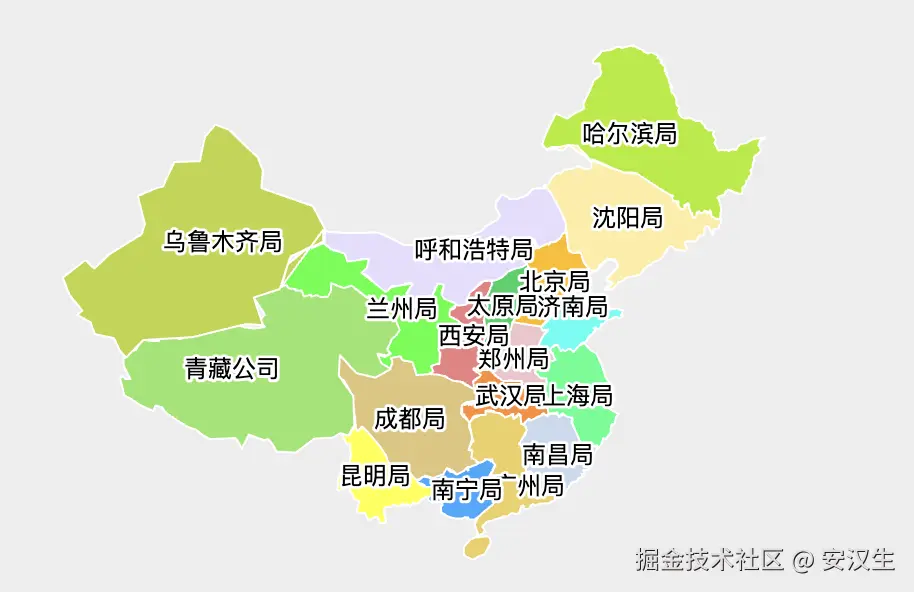
}2、添加铁路局图层
js
import GeoJSON from 'ol/format/GeoJSON';
import { Vector as VectorLayer } from 'ol/layer';
import { Vector as VectorSource } from 'ol/source';

async function addBureauLayer() {
  // data 是一个符合 GeoJSON 规范的对象
  const data = await fetch('/public/railway/bureau.json').then(res => res.json());

  const features = new GeoJSON().readFeatures(data, {
    featureProjection: 'EPSG:3857', // 将 EPSG:4326 坐标转换为 OpenLayers 默认使用的 EPSG:3857(Web 墨卡托投影)
  });

  const source = new VectorSource({ features }); // 创建矢量数据源

  // 填充图层
  railBureauFillLayer = new VectorLayer({
    source,
    updateWhileAnimating: true, // 要素批次将在动画过程中重新创建,避免闪烁或滞后
    updateWhileInteracting: true, // 要素批次将在交互过程中重新创建
    style: getRailBureauFillStyle,
  });

  // 文字标签图层
  railBureauLabelLayer = new VectorLayer({
    source,
    zIndex: 2, // 确保文字标签显示在其他图层之上,避免被遮挡
    style: getRailBureauLabelStyle,
  });

  // 将图层添加到地图
  map.addLayer(railBureauFillLayer);
  map.addLayer(railBureauLabelLayer);
}
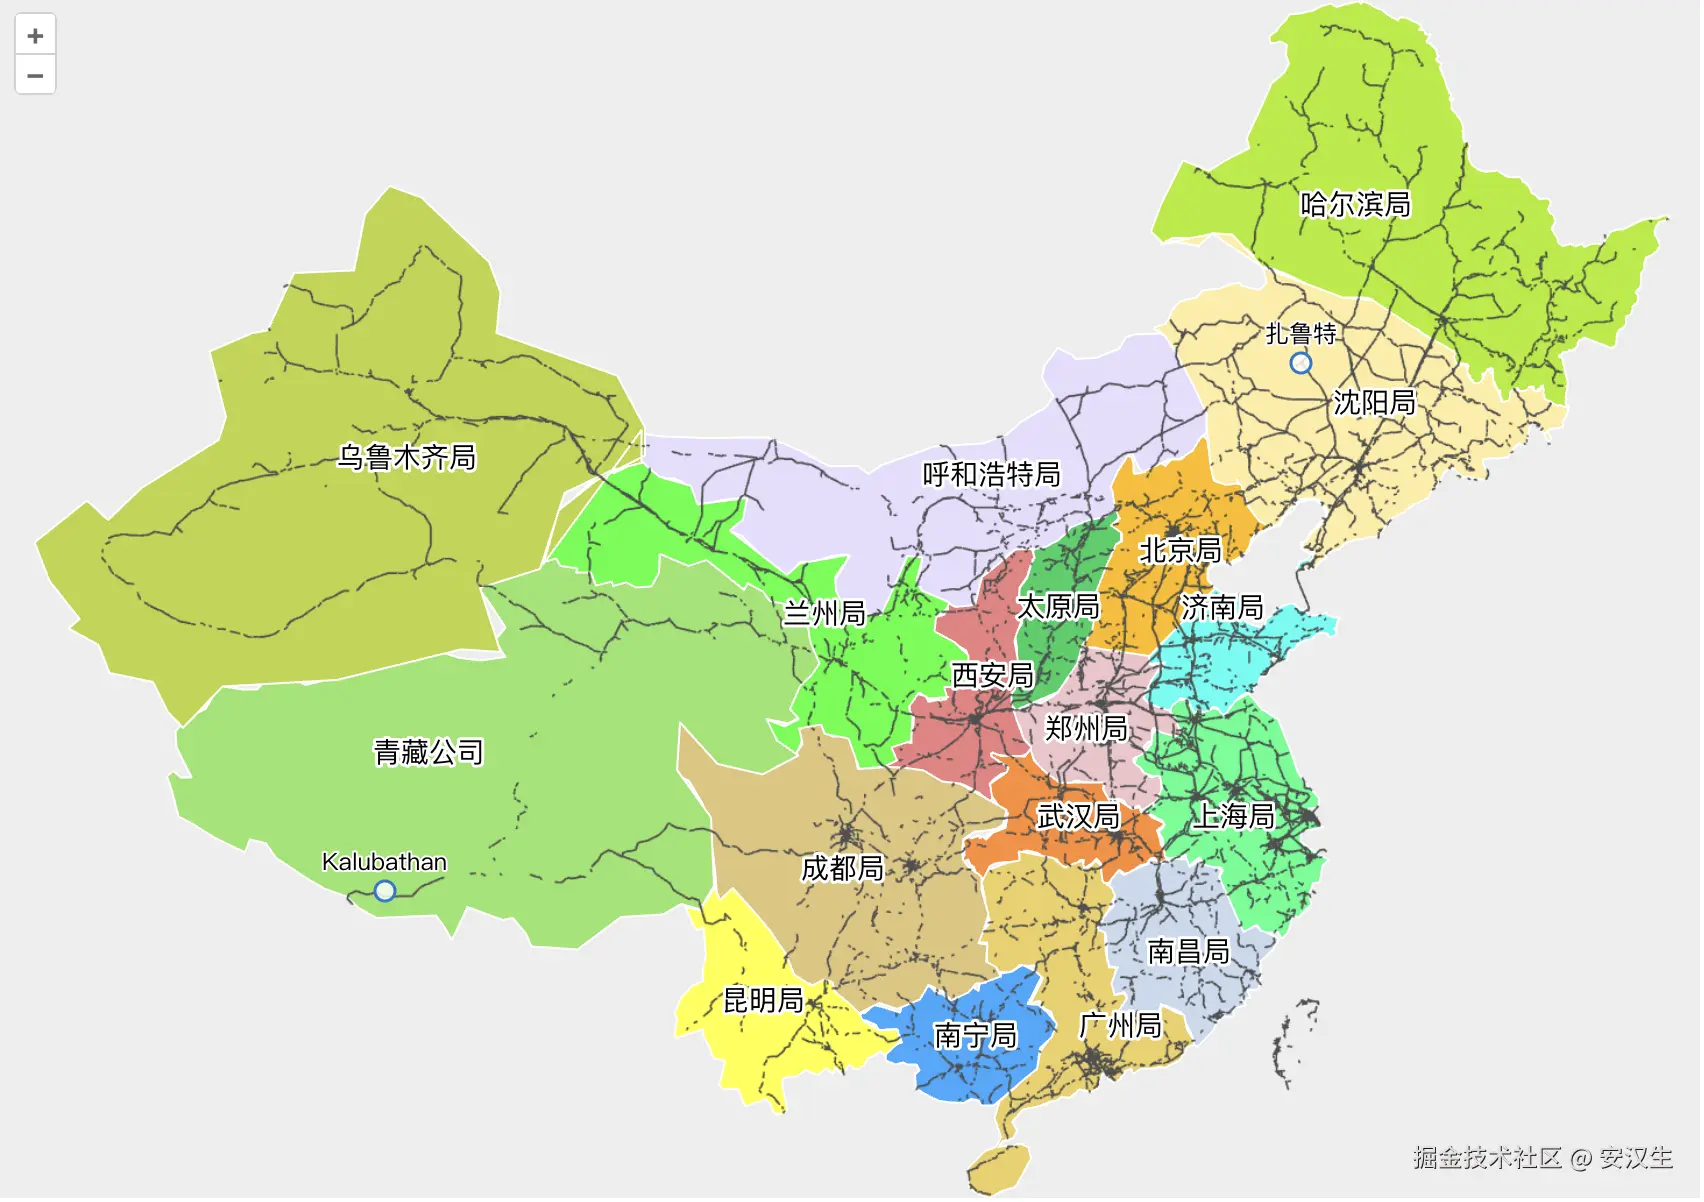
3、添加轨道站点图层
由于车站点很多,如果一次性渲染在页面,满屏都是车站点,体验很差;
所以通过聚类避免密集点重叠,并根据缩放级别动态调整聚类粒度;同时构建空间索引以支持后续交互查询;且仅在适当缩放级别下显示车站,兼顾性能与用户体验
js
import Cluster from 'ol/source/Cluster';

async function addStationLayer() {
  const data = await fetch('/public/railway/station.json').then(res => res.json());

  railStationFeatures = new GeoJSON().readFeatures(data, {
    featureProjection: 'EPSG:3857', // 将 EPSG:4326 坐标转换为 OpenLayers 默认使用的 EPSG:3857(Web 墨卡托投影)
  });

  // 构建空间索引
  // 为所有车站点构建 Rbush 空间索引(一种高效的二维空间索引结构,类似 R-tree)
  // 后续可快速查询"某点附近有哪些车站"或"某矩形范围内有哪些车站",常用于点击拾取、搜索等交互
  initStationRbush(railStationFeatures);

  const source = new VectorSource({ features: railStationFeatures }); // 原始车站点数据源
  const clusterSource = new Cluster({ source, distance: 40 }); // 聚类数据源,会根据点之间的像素距离自动合并为"簇"(cluster)

  // 动态调整聚类距离,调用该函数,监听地图缩放变化,并动态调整聚类的"合并距离"
  // 提升用户体验:远看简洁,近看细节
  updateClusterDistance(clusterSource);

  const maxResolution = map.getView().getResolutionForZoom(3.5); // zoom>=3.5显示车站

  railStationLayer = new VectorLayer({
    source: clusterSource,
    zIndex: 1,
    maxResolution,
    style: getRailStationStyle,
  });

  map.addLayer(railStationLayer);
}
3、添加轨道线路图层
铁路线数据数据量大,将数据分块后并行加载,在浏览器端使用 geojson-vt 切分为矢量瓦片,通过自定义 tileLoadFunction 动态生成 OpenLayers 要素,并仅在 zoom ≥ 4 时显示灰色铁路线,兼顾性能、内存和渲染效率
js
import geojsonvt from 'geojson-vt';

async function addRailLineLayer() {
  // 异步加载铁路线数据(被拆分为多个 JSON 文件)
  const data = await loadRailLineChunks();

  // 在浏览器端将 GeoJSON 数据切分为矢量瓦片
  const tileIndex = geojsonvt(data, {
    maxZoom: 12, // 最多切到 zoom 12 级(更高缩放直接使用 zoom 12 的数据)
    tolerance: 5, // 简化几何的容差(单位:像素),值越大简化越强,性能越好但精度降低
    extent: 4096, // 每个瓦片的坐标范围(通常为 4096,比标准 256 更精细)
    buffer: 64, // 瓦片边缘缓冲区(像素),避免相邻瓦片间出现缝隙
  });

  // 使用 "伪瓦片" 模式:数据全在内存,但按瓦片方式组织和渲染
  const source = new VectorTileSource({
    url: '/tiles/{z}/{x}/{y}', // url 是虚拟路径(实际不请求网络),但 OpenLayers 需要它来生成瓦片坐标
    maxZoom: 12,
    // tileLoadFunction 被重写,不从网络加载,而是从本地 tileIndex(geojson-vt 生成的索引)中提取瓦片数据
    tileLoadFunction: (tile, url) => tileLoadFunction(tileIndex, tile, url),
  });

  // 当缩放级别 小于 4(如全国视图)时,不显示铁路线,避免杂乱
  const maxResolution = map.getView().getResolutionForZoom(4);

  railLineLayer = new VectorTileLayer({
    source,
    zIndex: 0,
    maxResolution,
    style: new Style({
      stroke: new Stroke({
        color: '#4f4f4f',
        width: 1,
      }),
    }),
  });

  map.addLayer(railLineLayer);
}
完整代码
js
import { onMounted, ref, useTemplateRef } from 'vue';
import { useResizeObserver } from '@vueuse/core';
import 'ol/ol.css';
import OlMap from 'ol/Map.js';
import View from 'ol/View.js';
import { Vector as VectorSource } from 'ol/source';
import { Vector as VectorLayer } from 'ol/layer';
import { fromLonLat, toLonLat, transform } from 'ol/proj';
import { Style, Circle, Fill, Stroke, Text } from 'ol/style.js';
import VectorTileLayer from 'ol/layer/VectorTile';
import VectorTileSource from 'ol/source/VectorTile';
import Cluster from 'ol/source/Cluster';
import { getDistance } from 'ol/sphere';
import Feature from 'ol/Feature';
import MultiLineString from 'ol/geom/MultiLineString';
import { inAndOut } from 'ol/easing';
import { getCenter } from 'ol/extent';
import GeoJSON from 'ol/format/GeoJSON';
import geojsonvt from 'geojson-vt';
import RBush from 'rbush';

const container = useTemplateRef('container');
const railBureauFillStyleCache = new Map();
const stationRbush = new RBush();
const highlightStationId = ref();

let map;
let railBureauFillLayer = null;
let railBureauLabelLayer = null;
let railStationFeatures = [];
let railStationLayer = null;
let railLineLayer = null;

useResizeObserver(container, updateMapSize);

onMounted(() => {
  initMap();
  addLayers();
  registerMapEvent();
});

function initMap() {
  map = new OlMap({
    target: container.value, // 地图要渲染到的 DOM 元素
    // 地图图层列表
    layers: [],
    // 定义地图的视图(视角),包括中心点、缩放级别、投影等
    view: new View({
      center: fromLonLat([105, 35]), // 将 EPSG:4326 坐标转换为 OpenLayers 默认使用的 EPSG:3857(Web 墨卡托投影)
      zoom: 3, // 缩放值,适合显示大范围区域(如整个中国或亚洲)
    }),
  });
}

function addLayers() {
  addBureauLayer();
  addStationLayer();
  addRailLineLayer();
}

async function addBureauLayer() {
  // data 是一个符合 GeoJSON 规范的对象
  const data = await fetch('/public/railway/bureau.json').then(res => res.json());

  const features = new GeoJSON().readFeatures(data, {
    featureProjection: 'EPSG:3857', // 将 EPSG:4326 坐标转换为 OpenLayers 默认使用的 EPSG:3857(Web 墨卡托投影)
  });

  const source = new VectorSource({ features }); // 创建矢量数据源

  // 填充图层
  railBureauFillLayer = new VectorLayer({
    source,
    updateWhileAnimating: true, // 要素批次将在动画过程中重新创建,避免闪烁或滞后
    updateWhileInteracting: true, // 要素批次将在交互过程中重新创建
    style: getRailBureauFillStyle,
  });

  // 文字标签图层
  railBureauLabelLayer = new VectorLayer({
    source,
    zIndex: 2, // 确保文字标签显示在其他图层之上,避免被遮挡
    style: getRailBureauLabelStyle,
  });

  // 将图层添加到地图
  map.addLayer(railBureauFillLayer);
  map.addLayer(railBureauLabelLayer);
}

async function addStationLayer() {
  const data = await fetch('/public/railway/station.json').then(res => res.json());

  railStationFeatures = new GeoJSON().readFeatures(data, {
    featureProjection: 'EPSG:3857', // 将 EPSG:4326 坐标转换为 OpenLayers 默认使用的 EPSG:3857(Web 墨卡托投影)
  });

  // 构建空间索引
  // 为所有车站点构建 Rbush 空间索引(一种高效的二维空间索引结构,类似 R-tree)
  // 后续可快速查询"某点附近有哪些车站"或"某矩形范围内有哪些车站",常用于点击拾取、搜索等交互
  initStationRbush(railStationFeatures);

  const source = new VectorSource({ features: railStationFeatures }); // 原始车站点数据源
  const clusterSource = new Cluster({ source, distance: 40 }); // 聚类数据源,会根据点之间的像素距离自动合并为"簇"(cluster)

  // 动态调整聚类距离,调用该函数,监听地图缩放变化,并动态调整聚类的"合并距离"
  // 提升用户体验:远看简洁,近看细节
  updateClusterDistance(clusterSource);

  const maxResolution = map.getView().getResolutionForZoom(3.5); // zoom>=3.5显示车站

  railStationLayer = new VectorLayer({
    source: clusterSource,
    zIndex: 1,
    maxResolution,
    style: getRailStationStyle,
  });

  map.addLayer(railStationLayer);
}

async function addRailLineLayer() {
  // 异步加载铁路线数据(被拆分为多个 JSON 文件)
  const data = await loadRailLineChunks();

  // 在浏览器端将 GeoJSON 数据切分为矢量瓦片
  const tileIndex = geojsonvt(data, {
    maxZoom: 12, // 最多切到 zoom 12 级(更高缩放直接使用 zoom 12 的数据)
    tolerance: 5, // 简化几何的容差(单位:像素),值越大简化越强,性能越好但精度降低
    extent: 4096, // 每个瓦片的坐标范围(通常为 4096,比标准 256 更精细)
    buffer: 64, // 瓦片边缘缓冲区(像素),避免相邻瓦片间出现缝隙
  });

  // 使用 "伪瓦片" 模式:数据全在内存,但按瓦片方式组织和渲染
  const source = new VectorTileSource({
    url: '/tiles/{z}/{x}/{y}', // url 是虚拟路径(实际不请求网络),但 OpenLayers 需要它来生成瓦片坐标
    maxZoom: 12,
    // tileLoadFunction 被重写,不从网络加载,而是从本地 tileIndex(geojson-vt 生成的索引)中提取瓦片数据
    tileLoadFunction: (tile, url) => tileLoadFunction(tileIndex, tile, url),
  });

  // 当缩放级别 小于 4(如全国视图)时,不显示铁路线,避免杂乱
  const maxResolution = map.getView().getResolutionForZoom(4);

  railLineLayer = new VectorTileLayer({
    source,
    zIndex: 0,
    maxResolution,
    style: new Style({
      stroke: new Stroke({
        color: '#4f4f4f',
        width: 1,
      }),
    }),
  });

  map.addLayer(railLineLayer);
}

/**
 * 瓦片加载函数,将 geojson-vt 的瓦片数据转换为 OpenLayers 的 Feature
 */
function tileLoadFunction(tileIndex, tile) {
  const tileCoord = tile.getTileCoord();
  if (!tileCoord) {
    return tile.setFeatures([]);
  }

  const [z, x, y] = tileCoord;
  const tileData = tileIndex.getTile(z, x, y);
  if (!tileData?.features?.length) {
    return tile.setFeatures([]);
  }

  const olFeatures = [];
  for (const f of tileData.features) {
    if (!f.geometry || f.type !== 2) {
      continue;
    }
    const multiLineCoords = f.geometry.map(line =>
      line.map(([px, py]) => tilePixelToLonLat(px, py, z, x, y, 4096))
    );
    // 转换为 EPSG:3857
    const multiLine3857 = multiLineCoords.map(line =>
      line.map(coord => transform(coord, 'EPSG:4326', 'EPSG:3857'))
    );
    const geometry = new MultiLineString(multiLine3857);
    const feature = new Feature({ geometry });
    feature.setProperties(f.tags || {});
    olFeatures.push(feature);
  }

  tile.setFeatures(olFeatures);
}

/**
 * 瓦片像素 → 经纬度 转换公式(基于 Web 墨卡托投影反算)
 */
function tilePixelToLonLat(px, py, z, x, y, extent = 4096) {
  const u = px / extent;
  const v = py / extent;
  const n = Math.PI - (2 * Math.PI * (y + v)) / Math.pow(2, z);
  const lat = (180 / Math.PI) * Math.atan(0.5 * (Math.exp(n) - Math.exp(-n)));
  const lon = ((x + u) / Math.pow(2, z)) * 360.0 - 180.0;
  return [lon, lat];
}

async function loadRailLineChunks() {
  const chunkCount = 21; // 提前把一个200+MB 的 GeoJson格式的文件切成21个

  // 并行加载21个文件
  const chunkPromises = Array.from({ length: chunkCount + 1 }, (_, i) =>
    fetch(`/public/railway/lines/chunk_${i}.json`).then(res => res.json())
  );

  const chunkArrays = await Promise.all(chunkPromises);
  const mergedArray = chunkArrays.flat();

  return {
    type: 'FeatureCollection',
    name: 'rail-line',
    crs: { type: 'name', properties: { name: 'urn:ogc:def:crs:OGC:1.3:CRS84' } },
    features: mergedArray,
  };
}

function getRailBureauFillStyle(feature) {
  const fid = feature.get('fid');
  const cacheStyle = railBureauFillStyleCache.get(fid);
  if (cacheStyle) {
    return cacheStyle;
  }

  // 预定义颜色数组
  const colors = [
    '#aeec13', // 哈尔滨局
    '#FFECA1', // 沈阳局
    '#ffba00', // 北京局
    '#EFC3CA', // 郑州局
    '#1dcf61', // 太原局
    '#33FFF3', // 济南局
    '#E7DDFF', // 呼和浩特局
    '#EC8081', // 西安局
    '#FF8C33', // 武汉局
    '#33FF8C', // 上海局
    '#C9D9EE', // 南昌局
    '#edcf61', // 广州局
    '#33A8FF', // 南宁局
    '#DFC57B', // 成都局
    '#33FF33', // 兰州局
    '#94e469', // 青藏公司
    '#FFFF33', // 昆明局
    '#BFD641', // 乌鲁木齐局
  ];

  const colorIndex = typeof fid === 'number' ? (fid - 1) % colors.length : 0;
  const style = new Style({
    fill: new Fill({ color: colors[colorIndex] }), // 填充颜色
    stroke: new Stroke({ color: '#FFFFFF', width: 1 }), // 边框颜色,线宽为 1 像素,用于区分相邻铁路局区域
  });
  railBureauFillStyleCache.set(fid, style);
  return style;
}

function getRailBureauLabelStyle(feature) {
  const zoom = map?.getView().getZoom();

  const size = zoom < 4 ? 12 : zoom < 5 ? 14 : 16; // 根据缩放级别动态设置字体大小

  return new Style({
    text: new Text({
      text: feature.get('name') ?? '',
      font: `${size}px sans-serif`,
      fill: new Fill({ color: '#000000' }), // 文字主体颜色为黑色
      stroke: new Stroke({ color: '#FFFFFF', width: 3 }), // 白色描边(宽 3 像素),包裹在文字外围增强可读性
      overflow: true, // 允许文字超出几何范围
    }),
  });
}

function getRailStationStyle(feature) {
  const clusteredFeatures = feature.get('features');
  const size = clusteredFeatures.length;

  // 只有单个车站才显示, 不显示聚合点
  if (size !== 1) {
    return undefined;
  }

  const station = clusteredFeatures[0];
  const { name, fid } = station.getProperties();
  const isHighlighted = highlightStationId.value === fid;

  return new Style({
    image: new Circle({
      radius: isHighlighted ? 8 : 5,
      fill: new Fill({
        color: isHighlighted ? '#ff362e' : 'rgba(255, 255, 255, 0.8)',
      }),
      stroke: new Stroke({
        color: isHighlighted ? '#fff' : '#1976d2',
        width: isHighlighted ? 2 : 1.5,
      }),
    }),
    text: new Text({
      text: name,
      offsetY: isHighlighted ? -20 : -15,
      font: `${isHighlighted ? '14px' : '12px'} sans-serif`,
      fill: new Fill({ color: isHighlighted ? '#ff362e' : '#000' }),
      stroke: new Stroke({ color: '#fff', width: 2 }),
    }),
  });
}

/**
 * 初始化车站空间索引
 */
function initStationRbush(features) {
  const items = features
    .map((feature, index) => {
      const geom = feature.getGeometry();
      if (!geom) {
        return;
      }
      const [x, y] = geom.getCoordinates(); // EPSG:3857
      return { minX: x, minY: y, maxX: x, maxY: y, index };
    })
    .filter(Boolean);
  stationRbush.load(items);
}

function getStationTargetZoom(center) {
  const nearbyCount = getNearbyStationsCount(center, 10000); // 10KM内站点数量
  // 越密集越放大
  let targetZoom;
  if (nearbyCount <= 5) {
    targetZoom = 10;
  } else if (nearbyCount <= 15) {
    targetZoom = 11;
  } else if (nearbyCount <= 40) {
    targetZoom = 12;
  } else if (nearbyCount <= 100) {
    targetZoom = 13;
  } else {
    targetZoom = 14;
  }

  return targetZoom;
}

/**
 * 获取指定范围内的站点数量
 * @param centerCoord 中心点
 * @param radiusMeters
 */

function getNearbyStationsCount(centerCoord, radiusMeters) {
  if (!stationRbush) {
    return 0;
  }
  const [cx, cy] = centerCoord;
  const buffer = radiusMeters;
  const bbox = {
    minX: cx - buffer,
    minY: cy - buffer,
    maxX: cx + buffer,
    maxY: cy + buffer,
  };
  const candidates = stationRbush.search(bbox);
  const centerLonLat = toLonLat(centerCoord);
  let count = 0;
  for (const item of candidates) {
    const feature = railStationFeatures[item.index];
    const coord = feature.getGeometry().getCoordinates();
    const pointLonLat = toLonLat(coord);
    const distance = getDistance(centerLonLat, pointLonLat);
    if (distance <= radiusMeters) {
      count++;
    }
  }
  return count;
}

// 居中放大
function centerAndZoomIn(feature, zoom) {
  const geometry = feature.getGeometry();
  const extent = geometry.getExtent();
  const view = map.getView();
  const center = getCenter(extent);

  view.animate({
    center,
    zoom,
    duration: 600,
    easing: inAndOut,
  });
}

/**
 * 根据缩放级别(zoom)动态调整点要素聚类的距离阈值,放大时聚类解散、缩小时聚类合并
 */
function updateClusterDistance(clusterSource) {
  map.getView().on('change:resolution', update);
  function update() {
    const zoom = map.getView().getZoom();
    const distance = getClusterDistance(zoom);
    clusterSource.setDistance(distance);
  }
  function getClusterDistance(zoom) {
    if (zoom <= 3.5) return 30;
    if (zoom <= 4.5) return 28;
    if (zoom <= 5) return 25;
    if (zoom <= 5.5) return 22;
    if (zoom <= 6) return 20;
    if (zoom <= 6.5) return 18;
    if (zoom <= 7) return 15;
    if (zoom <= 8) return 12;
    return 8;
  }
  update();
}

function updateMapSize() {
  map.updateSize();
}

function registerMapEvent() {
  map.on('click', event => {
    const pixel = event.pixel;
    onRailStationClick(pixel);
  });
}

function onRailStationClick(pixel) {
  const feature = map.forEachFeatureAtPixel(pixel, f => f, {
    layerFilter: layer => layer === railStationLayer,
    hitTolerance: 5, // 增加点击容差(像素),方便点中细小区域
  });

  if (!feature) {
    return onRailBureauClick(pixel);
  }

  const center = getCenter(feature.getGeometry().getExtent());
  centerAndZoomIn(feature, getStationTargetZoom(center));

  const { name, fid } = feature.getProperties()?.features[0]?.values_;
  console.log(name);
  highlightStationId.value = fid;
  railStationLayer.changed();
}

function onRailBureauClick(pixel) {
  const feature = map.forEachFeatureAtPixel(pixel, feature => feature, {
    layerFilter: layer => layer === railBureauFillLayer,
    hitTolerance: 5,
  });

  if (!feature) {
    return;
  }

  const view = map.getView();
  const zoom = Math.max(view.getZoom(), 7);
  centerAndZoomIn(feature, zoom);

  const { name } = feature.getProperties();
  console.log(name);
}
html
<template>
  <div class="open-layers-railway" ref="container"></div>
</template>
css
.open-layers-railway {
  width: 100%;
  height: 100%;
}