从 https://prometheus.io/download/ 下载相应版本,安装到服务器上官网提供的是二进制版,解压就 能用,不需要编译
1、下载软件
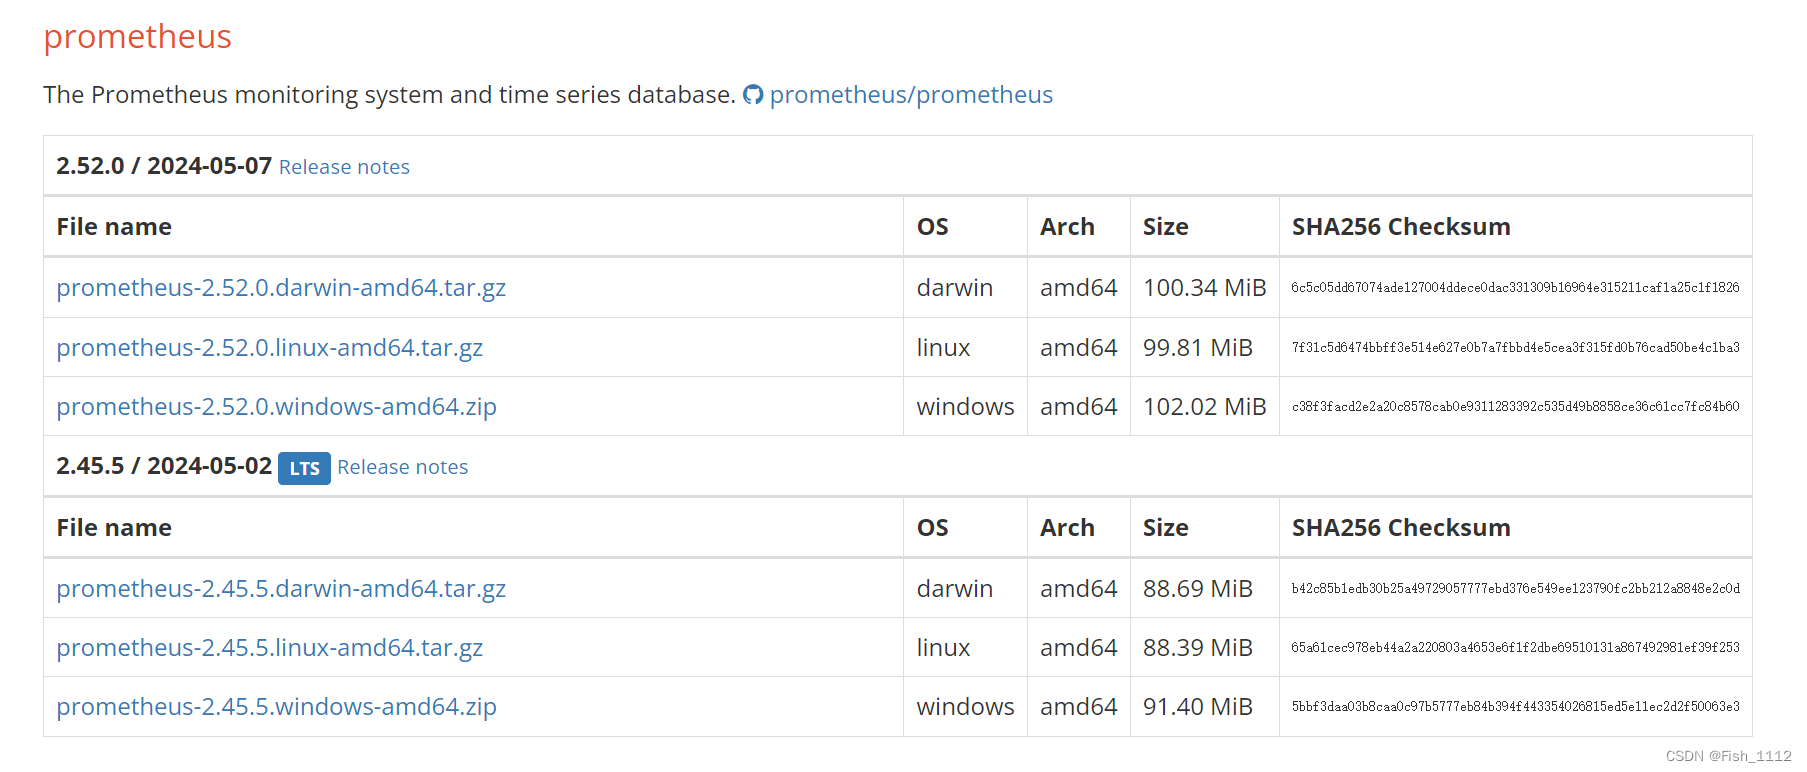
[root@localhost ~]# wget -c https://github.com/prometheus/prometheus/releases/download/v2.45.5/prometheus-2.45.5.linux-amd64.tar.gz一般访问不了,可以先下载在本地,再上传到虚拟机上

2、解压软件
[root@localhost ~]# tar xf prometheus-2.45.5.linux-amd64.tar.gz -C /usr/local/
创建软连接
[root@localhost ~]# ln -sv /usr/local/prometheus-2.45.5.linux-amd64/ /usr/local/prometheus
3、创建数据目录
[root@localhost prometheus]# mkdir -p /usr/local/prometheus/data4、创建服务运行用户
[root@localhost ~]# useradd prometheus -M -s /sbin/nologin
修改权限
[root@localhost ~]# chown -R prometheus.prometheus /usr/local/prometheus/*
5、创建服务运行脚本
bash
[root@localhost ~]# vim /usr/lib/systemd/system/prometheus.service
[Unit]
Description=prometheus
After=network.target
[Service]
Type=simple
User=prometheus
ExecStart=/usr/local/prometheus/prometheus --config.file=/usr/local/prometheus/prometheus.yml --storage.tsdb.path=/usr/local/prometheus/data
Restart=on-failure
ExecReload=/bin/kill -HUP $MAINPID
[Install]
WantedBy=multi-user.target
6、启动服务
bash
[root@localhost ~]# systemctl daemon-reload
[root@localhost ~]#  systemctl enable --now prometheus.service
检查服务
bash
[root@localhost ~]# systemctl is-active prometheus.service
active
[root@localhost ~]# systemctl is-enabled prometheus.service
enabled
检查端口
[root@localhost ~]# ss -lnupt | grep 9090
tcp LISTEN 0 128 [::]:9090 [::]:*
users:(("prometheus",pid=63281,fd=10))