ELK日志分析
- 一、ELK作用、组件
- 二、ELK部署、测试
-
- 1、环境规划
- 2、确保SELinux关闭、时间同步
- 3、所有主机添加主机名解析
- [4、三台ES主机安装jdk 1.15](#4、三台ES主机安装jdk 1.15)
- 5、调整系统资源限制
- 6、部署es集群
-
- [6.1 创建普通用户elk、安装es软件](#6.1 创建普通用户elk、安装es软件)
- [6.2 编辑es的配置文件](#6.2 编辑es的配置文件)
- [6.3 启动es集群](#6.3 启动es集群)
- [6.4 查看es集群状态](#6.4 查看es集群状态)
- 7、配置logstash
-
- [7.1 安装logstash](#7.1 安装logstash)
- [7.2 编辑logstash配置](#7.2 编辑logstash配置)
- [7.3 启动logstash](#7.3 启动logstash)
- 8、安装kibana可视化工具
- 9、在业务服务器上部署filebeat
-
- [9.1 测试访问web,形成日志](#9.1 测试访问web,形成日志)
- [9.2 安装filebeat](#9.2 安装filebeat)
- [9.3 编辑filebeat配置](#9.3 编辑filebeat配置)
- [9.4 启动filebeat](#9.4 启动filebeat)
- 三、测试ELK可正常搜集日志
-
- [1、在kibana webUI根据索引查看日志](#1、在kibana webUI根据索引查看日志)
- 2、创建图表,分析网站访问量
一、ELK作用、组件
1、作用
统一日志搜集、分析
2、核心组件
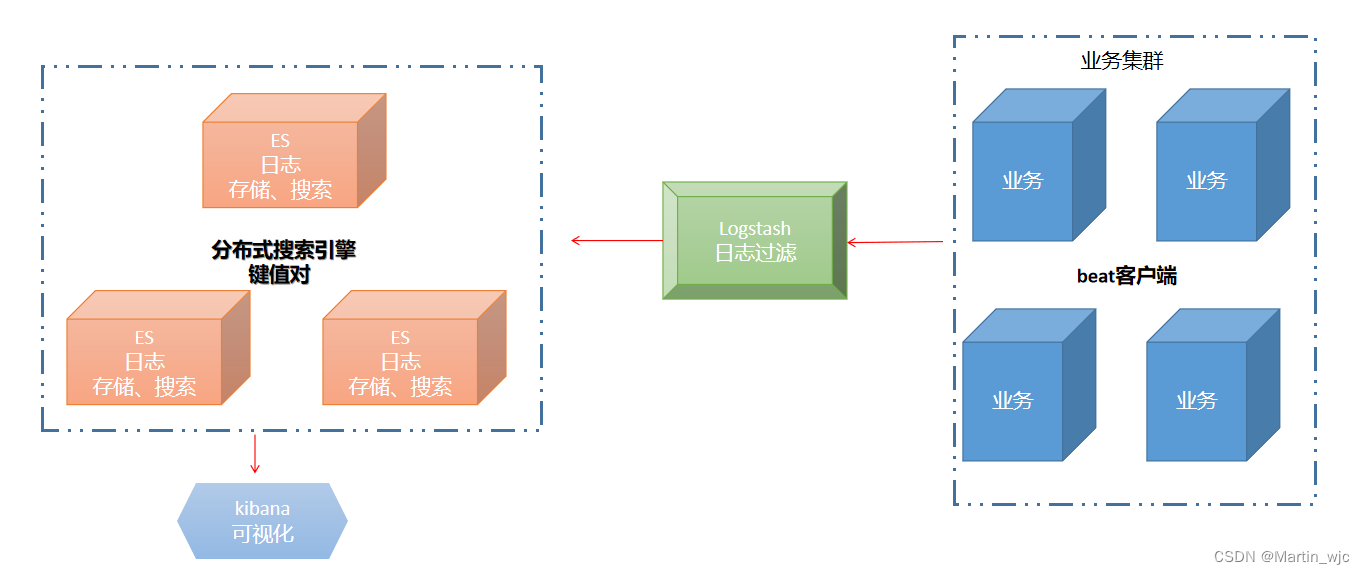
2.1 beat软件
部署在业务服务器的客户端agent, 用于让ELK联系beat采用日志
典型beat软件:
1、topbeat, 适用于搜集系统日志
2、filebeat, 适用于搜集应用级别日志
3、winbeat, 适用于windows日志
4、packetbeat, 适用于网络设备的日志
2.1 Logstash
日志过滤器,做日志过滤功能
2.2 Elasticsearch
简称es, 分布式搜索引擎,负责日志数据的存储、搜索功能
2.3 Kibana
提供webUI,可视化功能
二、ELK部署、测试
1、环境规划
192.168.140.10 es-master.linux.com jdk/elasticsearch/kibana/logstash
192.168.140.11 es-node01.linux.com jdk/elasticsearch
192.168.140.12 es-node02.linux.com jdk/elasticsearch
192.168.140.13 web_server.linux.com httpd/filebeat
2、确保SELinux关闭、时间同步
3、所有主机添加主机名解析
bash
[root@es-master ~]# cat /etc/hosts
127.0.0.1   localhost localhost.localdomain localhost4 localhost4.localdomain4
::1         localhost localhost.localdomain localhost6 localhost6.localdomain6

192.168.140.10	es-master.linux.com	es-master
192.168.140.11	es-node01.linux.com	es-node01
192.168.140.12	es-node02.linux.com	es-node02
192.168.140.13	web.linux.com	web
4、三台ES主机安装jdk 1.15
bash
[root@es-master ~]# tar xf jdk-15.0.2_linux-x64_bin.tar.gz -C /usr/local/

[root@es-master ~]# vim /etc/profile
export JAVA_HOME=/usr/local/jdk-15.0.2
export PATH=$PATH:$JAVA_HOME/bin

[root@es-master ~]# source /etc/profile

[root@es-master ~]# java -version
java version "15.0.2" 2021-01-19
Java(TM) SE Runtime Environment (build 15.0.2+7-27)
Java HotSpot(TM) 64-Bit Server VM (build 15.0.2+7-27, mixed mode, sharing)
5、调整系统资源限制
bash
[root@es-master ~]# vim /etc/security/limits.conf
* soft nofile 65536
* hard nofile 65536
* soft noproc 2048
* hard noproc 4096

nofile:系统允许的最大文件描述符数量
noproc:系统允许的最大进程数
bash
[root@es-master ~]# vim /etc/sysctl.conf
vm.max_map_count = 262144
fs.file-max = 655360

[root@es-master ~]# sysctl -p
6、部署es集群
6.1 创建普通用户elk、安装es软件
bash
[root@es-master ~]# useradd elk

[root@es-master ~]# mkdir -p /app/elk

[root@es-master ~]# tar xf elasticsearch-7.6.2-linux-x86_64.tar.gz -C /app/elk/
[root@es-master ~]# chown -R elk.elk /app/elk/
6.2 编辑es的配置文件
es-master:
bash
[root@es-node01 ~]# su - elk
[elk@es-node01 ~]$ mkdir /app/elk/elasticsearch-7.6.2/data
bash
[elk@es-master ~]$ vim /app/elk/elasticsearch-7.6.2/config/elasticsearch.yml

cluster.name: es
node.name: es-master
path.data: /app/elk/elasticsearch-7.6.2/data/
path.logs: /app/elk/elasticsearch-7.6.2/logs

network.host: 192.168.140.10
http.port: 9200
transport.tcp.port: 9300

discovery.seed_hosts: ["192.168.140.10:9300", "192.168.140.11:9300", "192.168.140.12:9300" ]
cluster.initial_master_nodes: ["192.168.140.10:9300"]

node.master: true         // 主节点
node.data: true
node.ingest: false
node.ml: false
cluster.remote.connect: false

http.cors.enabled: true
http.cors.allow-origin: true
节点类型说明:
Master node
负责集群自身的管理操作;例如创建索引、添加节点、删除节点
node.master: true
Data node
负责数据读写
建议实际部署时,使用高内存、高硬盘的服务器
node.data: true
Ingest node
预处理节点
负责数据预处理(解密、压缩、格式转换)
Client node
负责路由用户的操作请求
node.master: false
node.data: false
es-node01:
bash
cluster.name: es
node.name: es-node02
path.data: /app/elk/elasticsearch-7.6.2/data
path.logs: /app/elk/elasticsearch-7.6.2/logs
network.host: 192.168.140.11
http.port: 9200
transport.tcp.port: 9300
discovery.seed_hosts: ["192.168.140.10:9300", "192.168.140.11:9300", "192.168.140.12:9300"]
cluster.initial_master_nodes: ["192.168.140.10:9300"]

node.master: false
node.data: true             // 数据节点
node.ingest: false
node.ml: false
cluster.remote.connect: false

http.cors.enabled: true
http.cors.allow-origin: "*"
es-node02:
bash
cluster.name: es
node.name: es-node01
path.data: /app/elk/elasticsearch-7.6.2/data
path.logs: /app/elk/elasticsearch-7.6.2/logs
network.host: 192.168.140.12
http.port: 9200
transport.tcp.port: 9300
discovery.seed_hosts: ["192.168.140.10:9300", "192.168.140.11:9300", "192.168.140.12:9300"]
cluster.initial_master_nodes: ["192.168.140.10:9300"]

node.master: false
node.data: true              // 数据节点
node.ingest: false
node.ml: false
cluster.remote.connect: false

http.cors.enabled: true
http.cors.allow-origin: "*"
6.3 启动es集群
bash
[elk@es-node01 ~]$ /app/elk/elasticsearch-7.6.2/bin/elasticsearch -d
[elk@es-node01 ~]$
[elk@es-node01 ~]$
[elk@es-node01 ~]$ netstat -tunlp | grep java
(Not all processes could be identified, non-owned process info
 will not be shown, you would have to be root to see it all.)
tcp6       0      0 192.168.140.11:9200     :::*                    LISTEN      18675/java
tcp6       0      0 192.168.140.11:9300     :::*                    LISTEN      18675/java
6.4 查看es集群状态
bash
C:\Users\admin>curl -X GET "http://192.168.140.11:9200/_cluster/health?pretty"
{
  "cluster_name" : "es",        // 集群名称
  "status" : "green",          // 状态,green代表主从均正常、yellow代表主正常、从故障、red代表所有节点均故障
  "timed_out" : false,
  "number_of_nodes" : 3,       // 节点数量
  "number_of_data_nodes" : 3,  // 数据节点数量
  "active_primary_shards" : 0,
  "active_shards" : 0,
  "relocating_shards" : 0,
  "initializing_shards" : 0,
  "unassigned_shards" : 0,
  "delayed_unassigned_shards" : 0,
  "number_of_pending_tasks" : 0,
  "number_of_in_flight_fetch" : 0,
  "task_max_waiting_in_queue_millis" : 0,
  "active_shards_percent_as_number" : 100.0
}
7、配置logstash
7.1 安装logstash
bash
[root@es-master ~]# tar xf logstash-7.6.2.tar.gz -C /app/elk/

[root@es-master ~]# cd /app/elk/logstash-7.6.2/config/
[root@es-master config]# cp logstash-sample.conf logstash.conf
7.2 编辑logstash配置
bash
[root@es-master config]# pwd
/app/elk/logstash-7.6.2/config
[root@es-master config]# cat logstash.conf
input {
beats {
port => 5044
}
}
filter {
grok {
match => { "message" => "%{COMBINEDAPACHELOG}" }
}
}
output {
elasticsearch {
hosts => ["http://192.168.140.10:9200"]
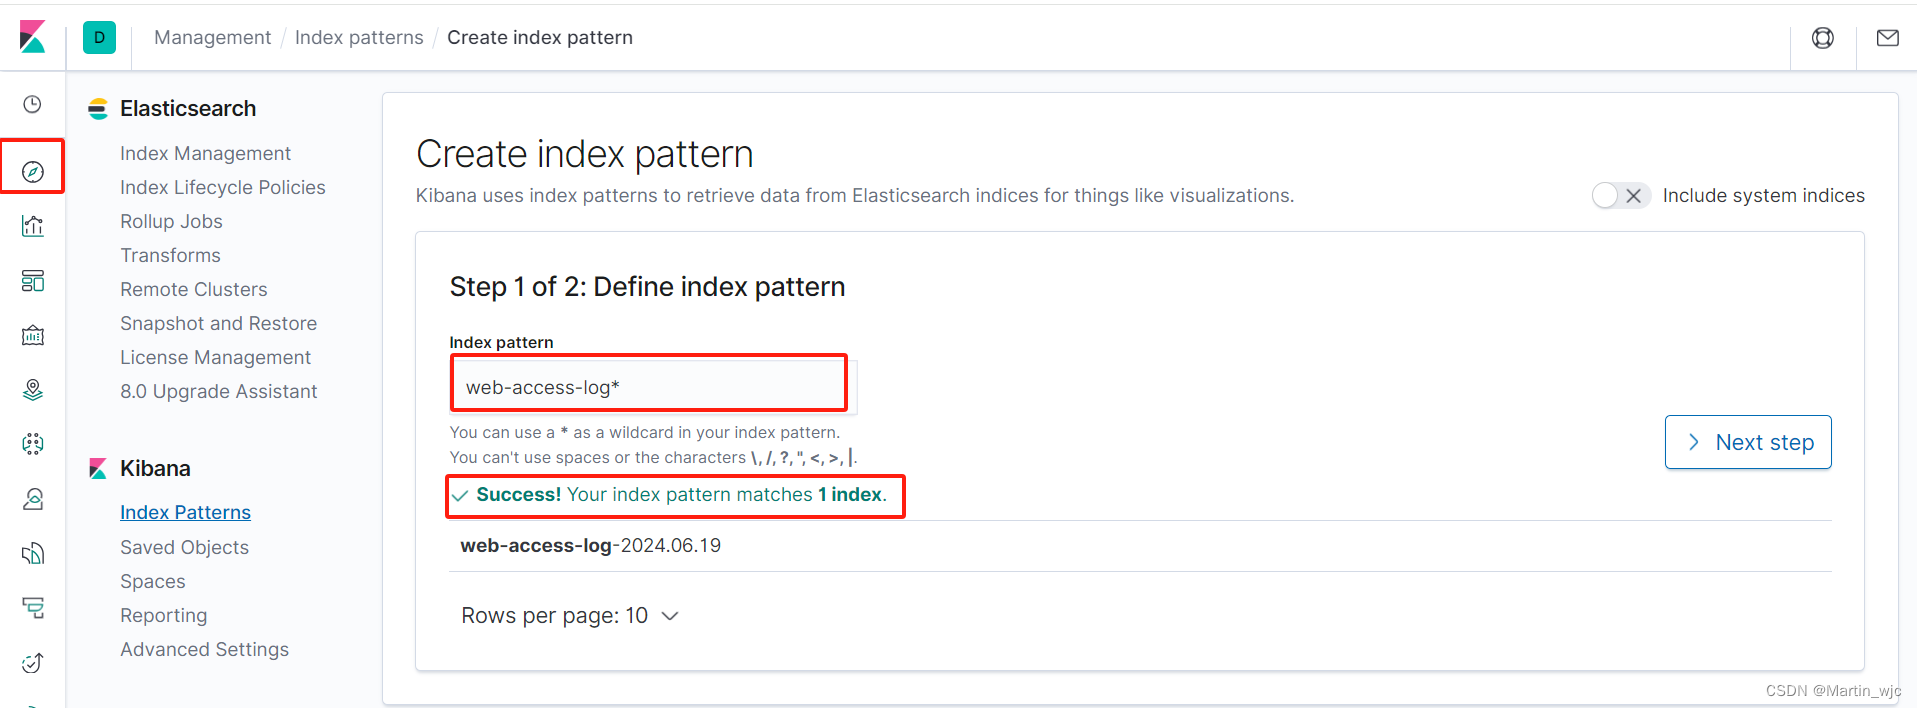
index => "web-access-log-%{+YYYY.MM.dd}"
#user => "elastic"
#password => "changeme"
}
}查看logstash自带的过滤日志的方法
root@es-master patterns# pwd
/app/elk/logstash-7.6.2/vendor/bundle/jruby/2.5.0/gems/logstash-patterns-core-4.1.2/patterns
root@es-master patterns#
7.3 启动logstash
bash
[root@es-master ~]# vim /app/elk/logstash-7.6.2/config/jvm.options

// 禁用GC垃圾回收机制

#-XX:+UseConcMarkSweepGC
#-XX:CMSInitiatingOccupancyFraction=75
#-XX:+UseCMSInitiatingOccupancyOnly
bash
[root@es-master ~]# nohup /app/elk/logstash-7.6.2/bin/logstash -f /app/elk/logstash-7.6.2/config/logstash.conf &
[1] 19110
[root@es-master ~]# netstat -tunlp | grep 5044
tcp6       0      0 :::5044                 :::*                    LISTEN      19110/java
[root@es-master ~]# netstat -tunlp | grep 5044
tcp6       0      0 :::5044                 :::*                    LISTEN      19110/java
8、安装kibana可视化工具
bash
[root@es-master ~]# tar xf kibana-7.6.2-linux-x86_64.tar.gz -C /app/elk/

[elk@es-master ~]$ vim /app/elk/kibana-7.6.2-linux-x86_64/config/kibana.yml
server.port: 5601
server.host: "192.168.140.10"
elasticsearch.hosts: ["http://192.168.140.10:9200"]

[elk@es-master ~]$ ps -elf | grep kibana
0 R elk       40227  39800 99  80   0 - 293743 -     14:47 pts/0    00:00:57 /app/elk/kibana-7.6.2-linux-x86_64/bin/../node/bin/node /app/elk/kibana-7.6.2-linux-x86_64/bin/../src/cli

[elk@es-master ~]$ netstat -antp | grep 5601
(Not all processes could be identified, non-owned process info
 will not be shown, you would have to be root to see it all.)
tcp 0 0 192.168.140.10:5601 0.0.0.0:* LISTEN 40436/node 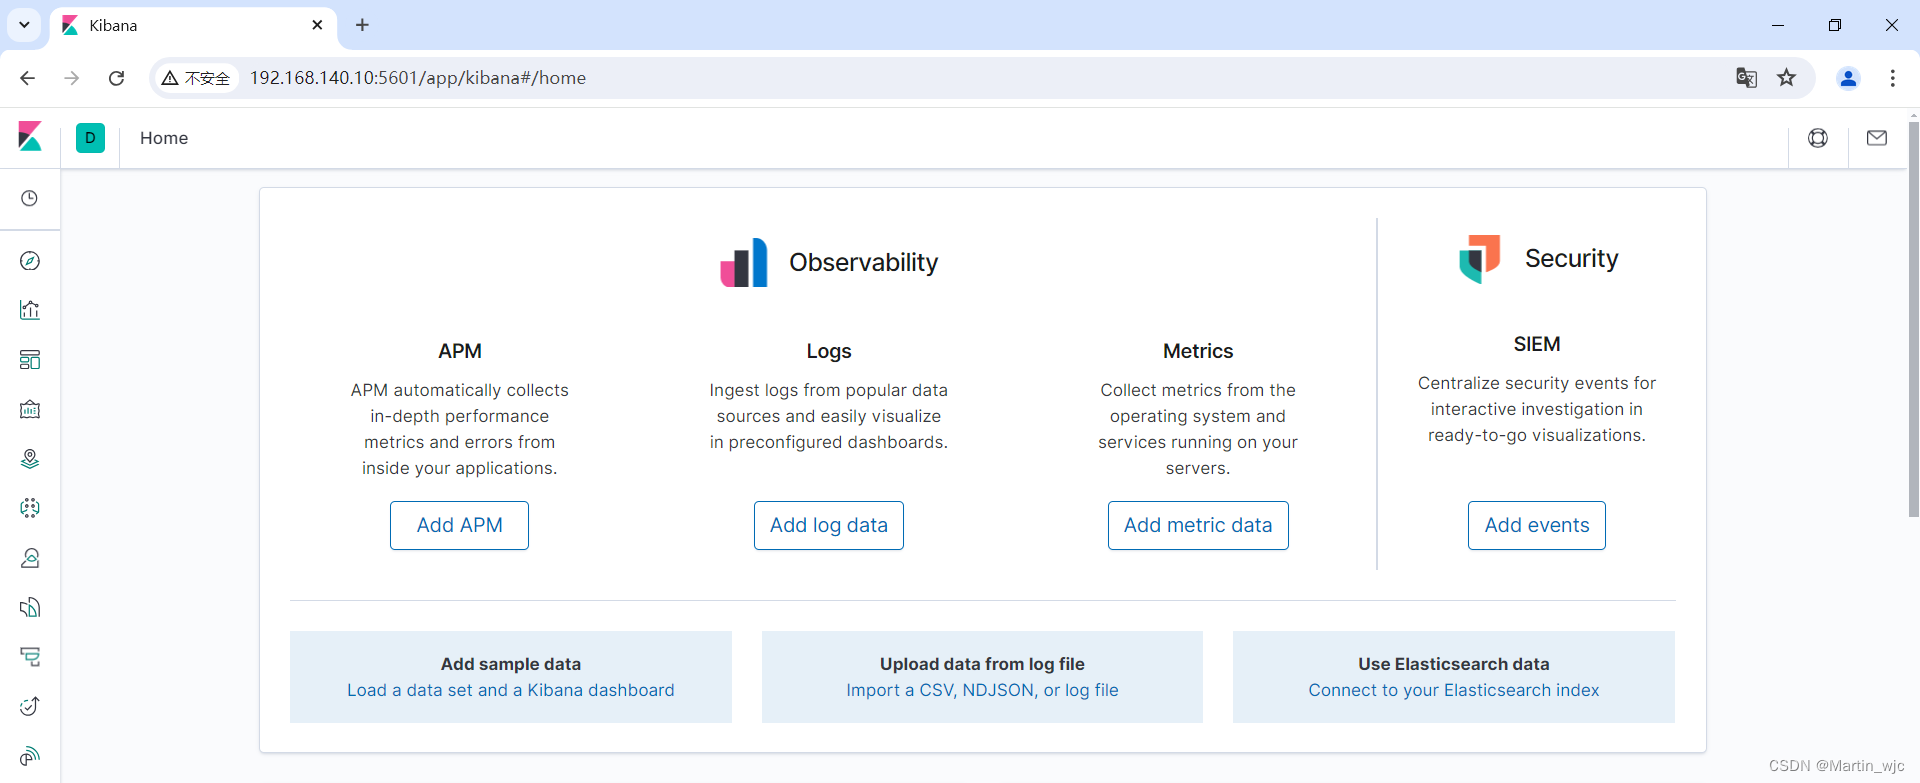
9、在业务服务器上部署filebeat
9.1 测试访问web,形成日志
bash
[root@web ~]# wc -l /var/log/httpd/access_log
4243 /var/log/httpd/access_log
9.2 安装filebeat
bash
[root@web_server ~]# tar xf filebeat-7.6.2-linux-x86_64.tar.gz -C /usr/local/9.3 编辑filebeat配置
bash
[root@web_server ~]# vim /usr/local/filebeat-7.6.2-linux-x86_64/filebeat.yml

#=========================== Filebeat inputs =============================

filebeat.inputs:
- type: log
  enabled: true
  paths:
    - /var/log/httpd/access_log

#============================== Dashboards =====================================
setup.dashboards.enabled: false

#============================== Kibana =====================================
setup.kibana:
  host: "192.168.140.10:5601"

#-------------------------- Elasticsearch output ------------------------------
#output.elasticsearch:
  # Array of hosts to connect to.
#  hosts: ["localhost:9200"]

#----------------------------- Logstash output --------------------------------
output.logstash:
  # The Logstash hosts
  hosts: ["192.168.140.10:5044"]
9.4 启动filebeat
bash
[root@web filebeat-7.6.2-linux-x86_64]# pwd
/usr/local/filebeat-7.6.2-linux-x86_64

[root@web filebeat-7.6.2-linux-x86_64]# nohup ./filebeat -c filebeat.yml &

[root@web filebeat-7.6.2-linux-x86_64]# ps -elf | grep file
4 S dbus        693      1  0  80   0 - 14555 ep_pol 11:37 ?        00:00:00 /usr/bin/dbus-daemon --system --address=systemd: --nofork --nopidfile --systemd-activation
0 S root       1844   1288 13  80   0 - 154003 futex_ 16:23 pts/0   00:00:00 ./filebeat -c filebeat.yml
三、测试ELK可正常搜集日志
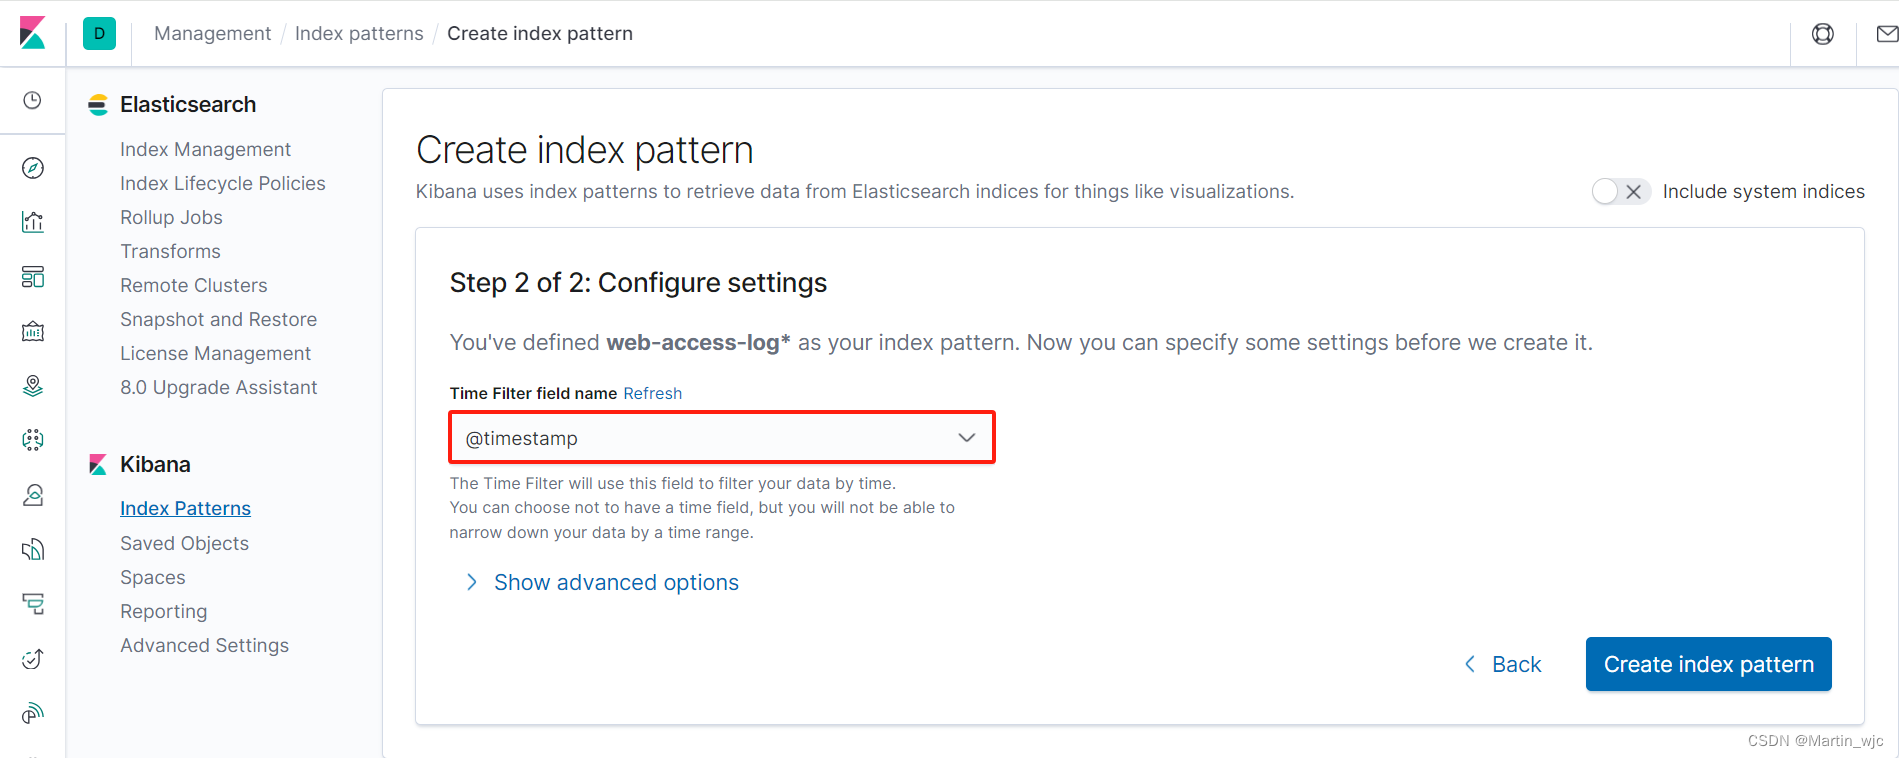
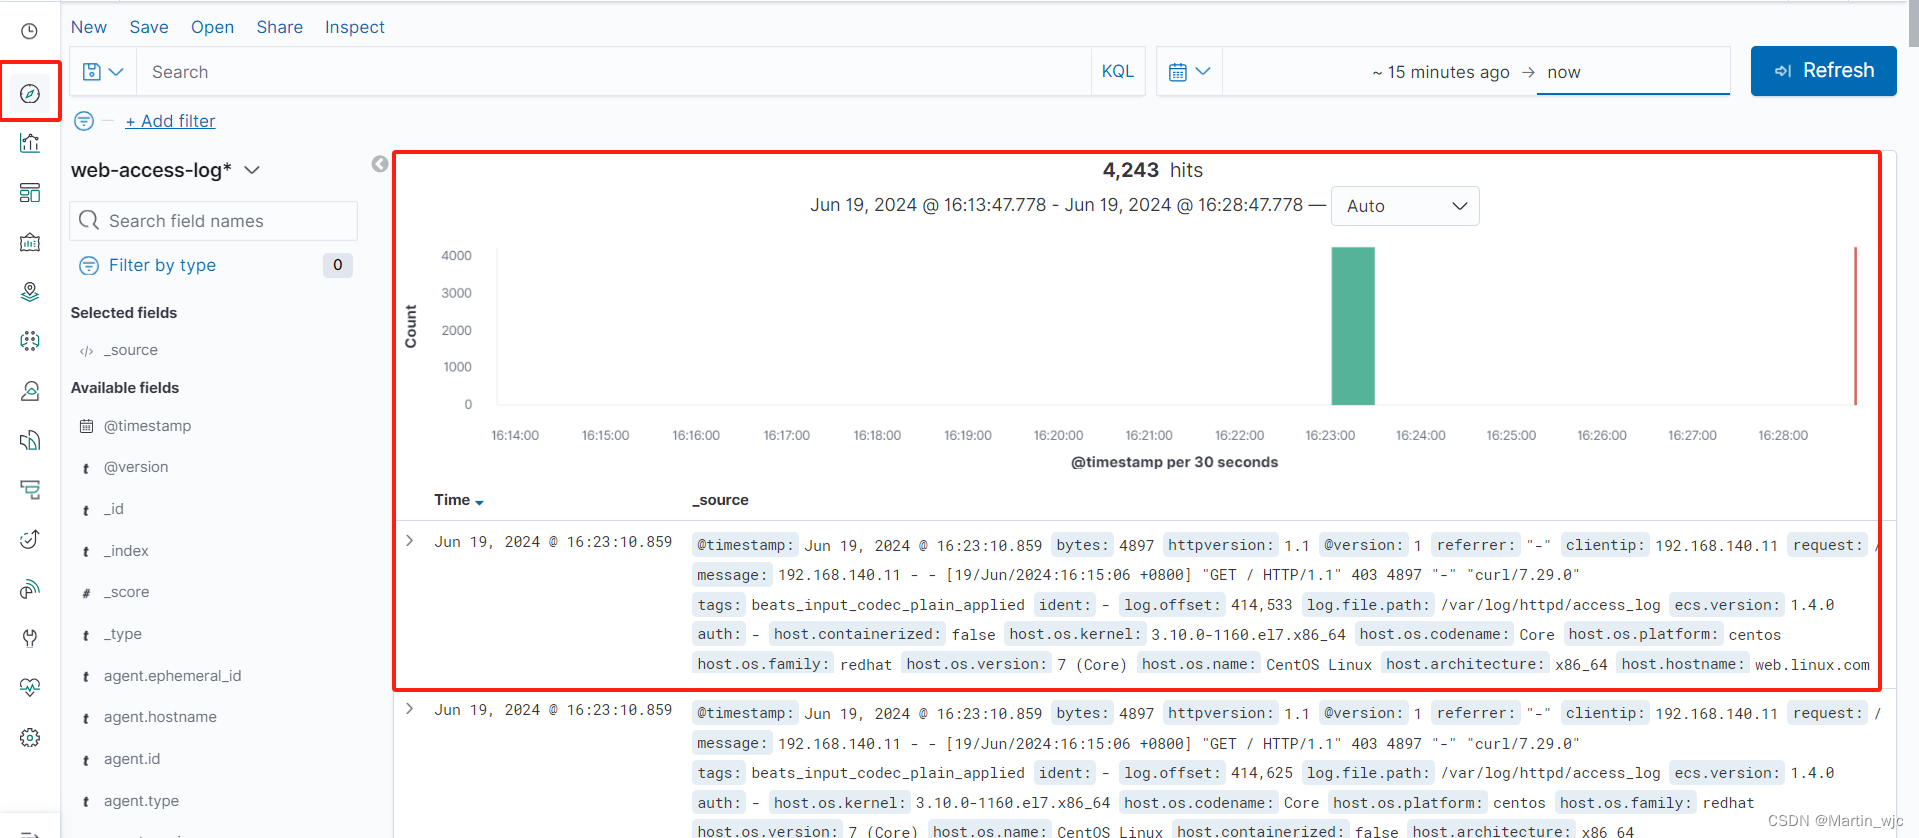
1、在kibana webUI根据索引查看日志
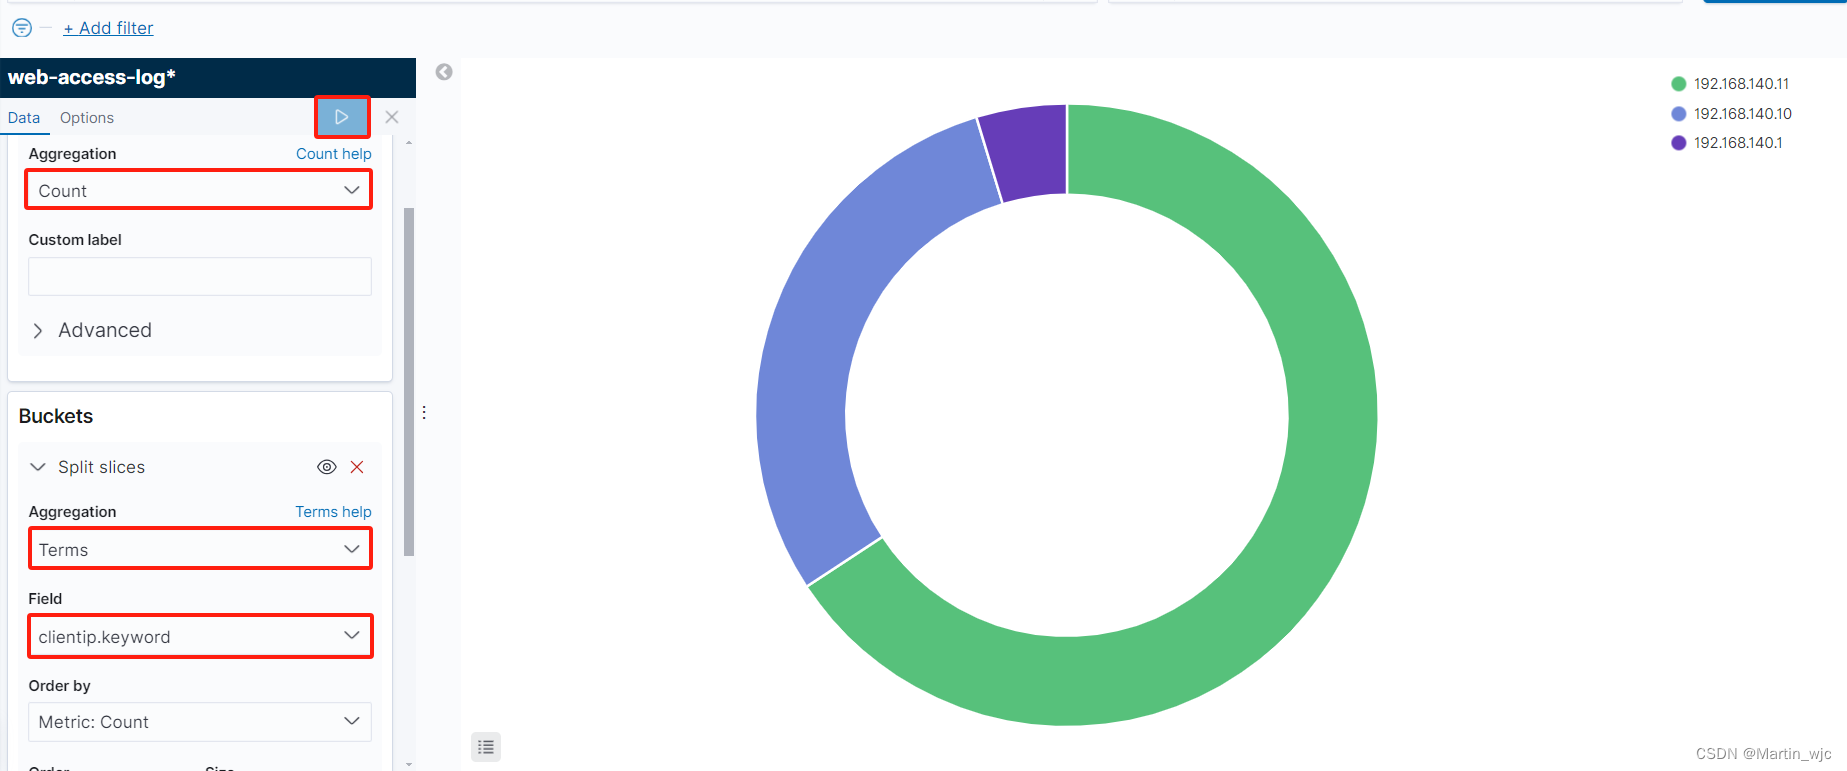
2、创建图表,分析网站访问量