工作台,是每个后台系统必备的,也是管理系统的首页。这次我们来实现一个工作台,并适配他的响应性
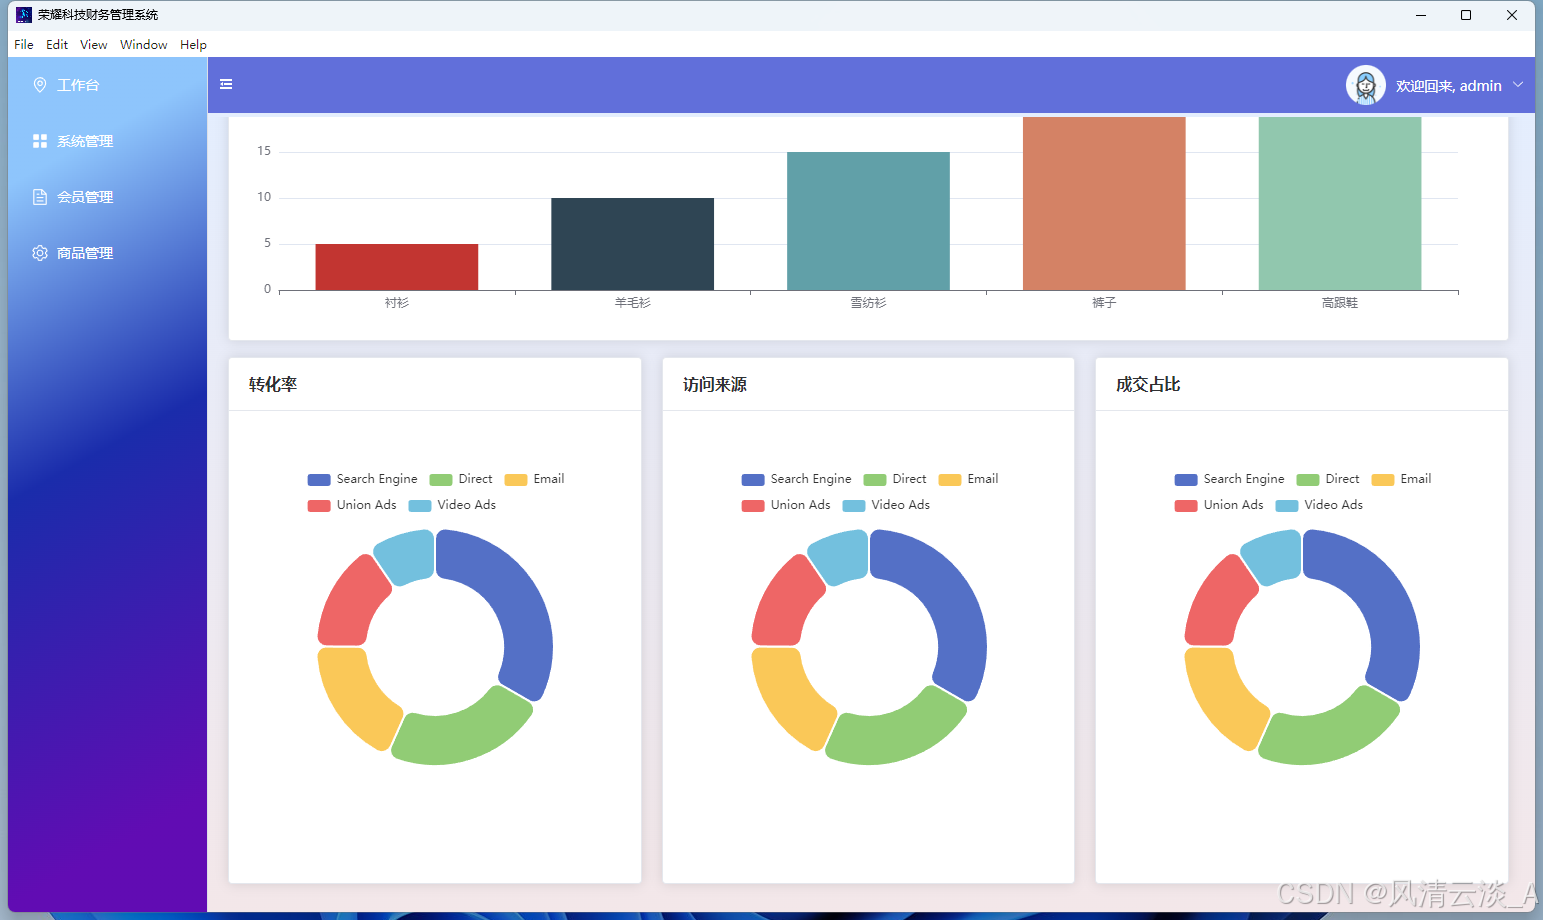
实现效果
代码实现
js
<template>
  <div class="dashboard">
    <el-row :gutter="20">
      <el-col class="mb-2" :xs="{span:24}" :md="{span:12}" :sm="{span:24}" :lg="{span:6}">
        <el-card>
          <template #header>
            <h3 class="header-top flex justify-between items-center">
              <span class="font-bold">访问数</span>
              <el-icon>
                <Pointer />
              </el-icon>
            </h3>
          </template>
          <div class="py-4 px-4 flex justify-between items-center">
            <span class="text-2xl">$2,000</span>
            <el-icon>
              <Calendar />
            </el-icon>
          </div>
          <div class="p-2 px-4 flex justify-between">
            <span>总访问数</span>
            <span>$120,000</span>
          </div>
        </el-card>
      </el-col>
      <el-col class="mb-2" :xs="{span:24}" :md="{span:12}" :sm="{span:24}" :lg="{span:6}">
        <el-card>
          <template #header>
            <h3 class="header-top flex justify-between items-center">
              <span class="font-bold">成交额</span>
              <el-icon>
                <Tickets />
              </el-icon>
            </h3>
          </template>
          <div class="py-4 px-4 flex justify-between items-center">
            <span class="text-2xl">$2,000</span>
            <el-icon>
              <Monitor />
            </el-icon>
          </div>
          <div class="p-2 px-4 flex justify-between">
            <span>总访问数</span>
            <span>$120,000</span>
          </div>
        </el-card>
      </el-col>
      <el-col class="mb-2" :xs="{span:24}" :md="{span:12}" :sm="{span:24}" :lg="{span:6}">
        <el-card>
          <template #header>
            <h3 class="header-top flex justify-between items-center">
              <span class="font-bold">下载数</span>
              <el-icon>
                <Pointer />
              </el-icon>
            </h3>
          </template>
          <div class="py-4 px-4 flex justify-between items-center">
            <span class="text-2xl">$2,000</span>
            <el-icon>
              <Guide color="#4E0505" />
            </el-icon>
          </div>
          <div class="p-2 px-4 flex justify-between">
            <span>总访问数</span>
            <span>$120,000</span>
          </div>
        </el-card>
      </el-col>
      <el-col class="mb-2" :xs="{span:24}" :md="{span:12}" :sm="{span:24}" :lg="{span:6}">
        <el-card>
          <template #header>
            <h3 class="header-top flex justify-between items-center">
              <span class="font-bold">成交数</span>
              <el-icon>
                <DataLine />
              </el-icon>
            </h3>
          </template>
          <div class="py-4 px-4 flex justify-between items-center">
            <span class="text-2xl">$2,000</span>
            <el-icon>
              <Van color="#1969BA" />
            </el-icon>
          </div>
          <div class="p-2 px-4 flex justify-between">
            <span>总访问数</span>
            <span>$120,000</span>
          </div>
        </el-card>
      </el-col>
    </el-row>
    <el-row :gutter="10" class="mt-2 mb-4">
      <el-col :span="24">
        <el-card style="width:100%">
          <el-tabs v-model="activeName" class="demo-tabs" @tab-click="handleClick">
            <el-tab-pane label="流量趋势" name="first">
              <BarPie
                v-if="activeName === 'first'"
                :chartData="chartData"
                :height="'300px'"
                :option="option"
              />
            </el-tab-pane>
            <el-tab-pane label="访问量" name="second">
              <LinePie
                v-if="activeName === 'second'"
                :chartData="chartData"
                :height="'300px'"
                :option="option1"
              />
            </el-tab-pane>
          </el-tabs>
        </el-card>
      </el-col>
    </el-row>
    <el-row :gutter="20">
      <el-col class="mb-2" :xs="{span:24}" :md="{span:12}" :sm="{span:24}" :lg="{span:8}">
        <el-card>
          <template #header>
            <h3 class="header-top flex justify-between items-center">
              <span class="font-bold">转化率</span>
            </h3>
          </template>
          <div class="py-4 px-4 flex justify-between items-center">
            <chartPieRef :chartData="pieData" :height="'400px'" />
          </div>
        </el-card>
      </el-col>
      <el-col class="mb-2" :xs="{span:24}" :md="{span:12}" :sm="{span:24}" :lg="{span:8}">
        <el-card>
          <template #header>
            <h3 class="header-top flex justify-between items-center">
              <span class="font-bold">访问来源</span>
            </h3>
          </template>
          <div class="py-4 px-4 flex justify-between items-center">
            <chartPieRef :chartData="pieData" :height="'400px'" />
          </div>
        </el-card>
      </el-col>
      <el-col class="mb-2" :xs="{span:24}" :md="{span:12}" :sm="{span:24}" :lg="{span:8}">
        <el-card>
          <template #header>
            <h3 class="header-top flex justify-between items-center">
              <span class="font-bold">成交占比</span>
            </h3>
          </template>
          <div class="py-4 px-4 flex justify-between items-center">
            <chartPieRef :chartData="pieData" :height="'400px'" />
          </div>
        </el-card>
      </el-col>
    </el-row>
  </div>
</template>- 封装echarts组件
- 引入Tailwind CSS,简化我们书写css样式
js
<script setup>
import { ref, onMounted } from "vue";
import {
  Pointer,
  Tickets,
  DataAnalysis,
  DataLine,
  Monitor,
  Van,
  Guide,
  Calendar
} from "@element-plus/icons-vue";
import BarPie from "@/components/echarts/bar.vue";
import LinePie from "@/components/echarts/line.vue";
import chartPieRef from "@/components/echarts/pie.vue";
const handleClick = (tab, event) => {
  console.log(tab, event);
};
const activeName = ref("first");
//柱状图的数据
const chartData = [
  {
    name: "衬衫",
    value: "5"
  },
  {
    name: "羊毛衫",
    value: "10"
  },
  {
    name: "雪纺衫",
    value: "15"
  },
  {
    name: "裤子",
    value: "20"
  },
  {
    name: "高跟鞋",
    value: "25"
  }
];
const option = {
  title: {
    text: "流量趋势"
  },
  tooltip: {},
  yAxis: {}
};
const option1 = {
  title: {
    text: "访问量"
  },
  tooltip: {},
  yAxis: {}
};
const pieData = [
  { value: 1048, name: "Search Engine" },
  { value: 735, name: "Direct" },
  { value: 580, name: "Email" },
  { value: 484, name: "Union Ads" },
  { value: 300, name: "Video Ads" }
];
</script>


<style scoped>
</style>
组件的封装
- 以饼图为例
js
<template>
  <div ref="chartPieRef" :style="{ height:height, width }"></div>
</template>

<script>
import {
  unref,
  nextTick,
  watch,
  computed,
  ref,
  defineComponent,
  reactive,
  watchEffect
} from "vue";
import { useEcharts } from "@/hooks/useEcharts";
export default defineComponent({
  name: "bar",
  props: {
    chartData: {
      type: Array,
      default: () => []
    },
    option: {
      type: Object,
      default: () => ({})
    },
    width: {
      type: String,
      default: "100%"
    },
    height: {
      type: String,
      default: "calc(100vh - 78px)"
    }
  },
  setup(props) {
    //创建dom节点的引用
    const chartPieRef = ref(null);
    const { echarts, setOptions } = useEcharts(chartPieRef);
    const COLORS = [
      "#c23531",
      "#2f4554",
      "#61a0a8",
      "#d48265",
      "#91c7ae",
      "#749f83"
    ];
    //默认的配置
    const option = reactive({
      tooltip: {
        trigger: "item"
      },
      legend: {
        top: "5%",
        left: "center"
      },
      series: [
        {
          name: "pie",
          name: "Access From",
          type: "pie",
          radius: ["40%", "70%"],
          avoidLabelOverlap: false,
          itemStyle: {
            borderRadius: 10,
            borderColor: "#fff",
            borderWidth: 2
          },
          label: {
            show: false,
            position: "center"
          },
          emphasis: {
            label: {
              show: true,
              fontSize: 40,
              fontWeight: "bold"
            }
          },
          labelLine: {
            show: false
          },
          data: []
        }
      ]
    });
    //监听父组件传递的属性变化,时时响应变化
    watchEffect(() => {
      props.chartData && initCharts();
    });

    function initCharts() {
      if (props.option) {
        Object.assign(option, props.option);
      }

      console.log(option, "option");
      option.series[0].data = props.chartData;
      setOptions(option);
    }
    return {
      chartPieRef
    };
  }
});
</script>

<style></style>
这样我们就实现了一个大概的dashboard页面,细节需要自己去完善美化了。

