本节重点介绍 :
- 基于文件的服务发现提供了一种配置静态目标的更通用的方法
- 可以摆脱对特定服务发现源的依赖
- 通常的做法是调用内部CMDB的接口获取target数据,打上标签,生成json文件发给prometheus采集
基于文件的服务发现模式
解决的问题
- 之前手动配置了很多个traget
- redis
- mysql
- blackbox
- pushgateway
- 手动配置维护成本高,还容易出错
基于文件的服务发现配置
特点
- 基于文件的服务发现提供了一种配置静态目标的更通用的方法
- 并充当了插入自定义服务发现机制的接口。
- 摆脱对特定服务发现源的依赖
- 只要能正确给出 json/yaml文件即可
- 和服务树的最好匹配方案
yaml文件类型
YAML yaml - targets: [ - '<host>' ] labels: [ <labelname>: <labelvalue> ... ]
- targets:
  - 172.20.70.205:9100
  - 172.20.70.215:9100
  labels:
    account: "aliyun-01"
    region: "ap-south-1"
json文件类型
json [ { "targets": [ "<host>", ... ], "labels": { "<labelname>": "<labelvalue>", ... } }, ... ]
[
  {
    "targets": [
      "172.20.70.205:9100"
    ],
    "labels": {
      "account": "aliyun-01",
      "region": "ap-south-1",
      "env": "prod",
      "group": "inf",
      "project": "monitor",
      "stree_gpa": "inf.monitor.prometheus"
    }
  },
  {
    "targets": [
      "172.20.70.215:9100"
    ],
    "labels": {
      "account": "aliyun-02",
      "region": "ap-south-2",
      "env": "prod",
      "group": "inf",
      "project": "middleware",
      "stree_gpa": "inf.middleware.kafka"
    }
  }
]
下面来解读一下
- targets 是一组实例地址的列表
- labels 是这组实例的标签,应用到列表中所有实例
- 如果想每个实例不同的标签,可以将targets列表保留一个实例即可
- 标签可以自定义,下面举几个例子
- account 代表公有云账户,多账户情况
- region 代表区域
- env 代表所属环境 prod代表生产,pre代表预发,test代表测试
- group代表业务大组
- project 代表项目
- stree_gpa 代表服务树三级标签
- 那么prometheus在采集对应target时就会将对应标签打入其metrics中
- 为后续我们按照标签过滤提供方便
配置举例
- files 代表 文件路径 支持通配符
- refresh_interval 代表 文件刷新间隔
  - job_name: 'node_exporter'
    scrape_interval: 30s
    scrape_timeout: 10s
    metrics_path: /metrics
    scheme: http
    honor_timestamps: false
    file_sd_configs:
    - files:
      - /opt/app/prometheus/sd/node_exporter.json
      refresh_interval: 5m
改造为服务发现类型
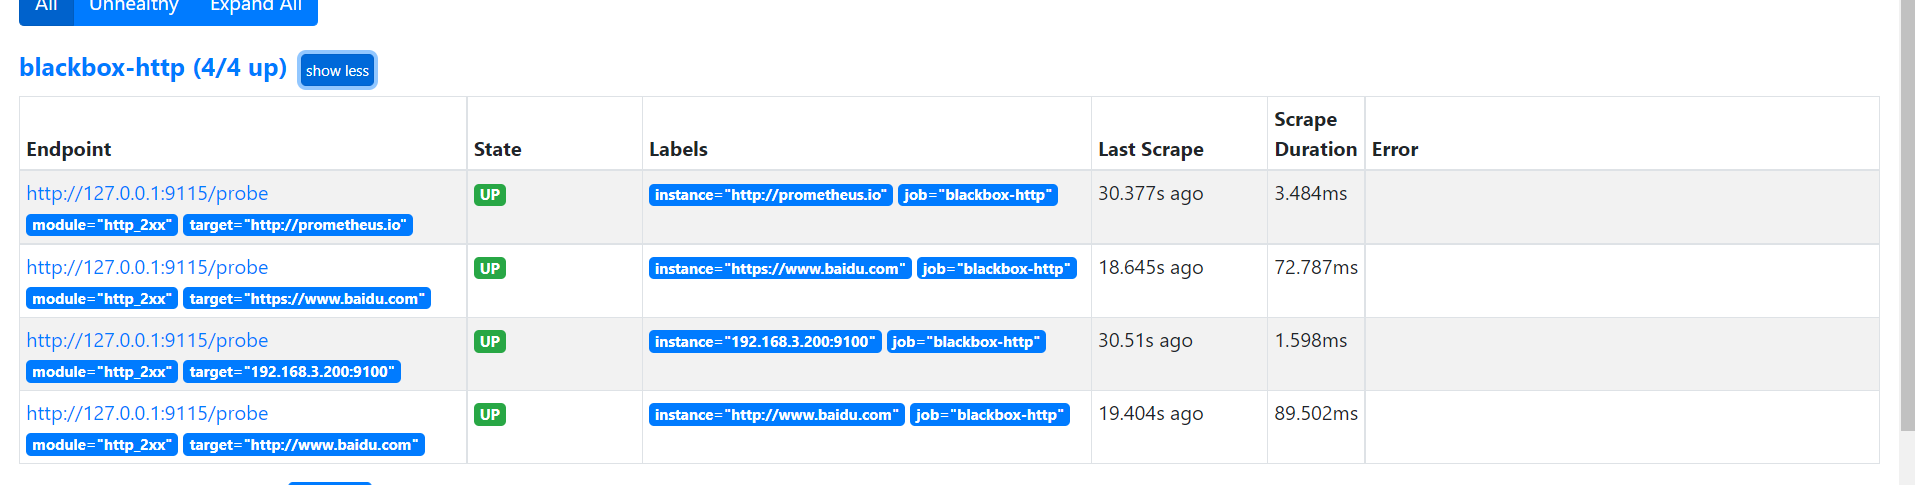
- 将 blackbox-http 和 node_exporter 改为文件发现
- prometheus 配置
  - job_name: 'blackbox-http'
    metrics_path: /probe
    # 传入的参数
    params:
      module: [http_2xx]  # Look for a HTTP 200 response.
    scrape_interval: 15s
    scrape_timeout: 10s
    scheme: http
    honor_timestamps: false
    file_sd_configs:
    - files:
      - /opt/app/prometheus/sd/blackbox_http.json
      refresh_interval: 2m
    relabel_configs:
      - source_labels: [__address__]
        target_label: __param_target
      - source_labels: [__param_target]
        target_label: instance
      - target_label: __address__
        replacement: 172.20.70.205:9115


  - job_name: 'node_exporter'
    # metrics的path 注意不都是/metrics
    # 传入的参数
    scrape_interval: 30s
    scrape_timeout: 10s
    scheme: http
    honor_timestamps: false
    file_sd_configs:
    - files:
      - /opt/app/prometheus/sd/node_exporter.json
      refresh_interval: 2m
mkdir -pv /opt/app/prometheus/sd/
cat <<EOF > /opt/app/prometheus/sd/node_exporter.json
[
  {
    "targets": [
      "172.20.70.205:9100"
    ],
    "labels": {
      "name": "prome-master01",
      "account": "aliyun-01",
      "region": "ap-south-1",
      "env": "prod",
      "group": "inf",
      "project": "monitor",
      "stree_gpa": "inf.monitor.prometheus"
    }
  },
  {
    "targets": [
      "172.20.70.215:9100"
    ],
    "labels": {
      "name": "prome-node01",
      "account": "aliyun-02",
      "region": "ap-south-2",
      "env": "prod",
      "group": "inf",
      "project": "middleware",
      "stree_gpa": "inf.middleware.kafka"
    }
  }
]
EOF

cat <<EOF > /opt/app/prometheus/sd/blackbox_http.json
[
  {
    "targets": [
      "172.20.70.205:9115",
      "http://prometheus.io",
      "http://www.baidu.com",
      "https://www.baidu.com"
    ]
  }
]
EOF
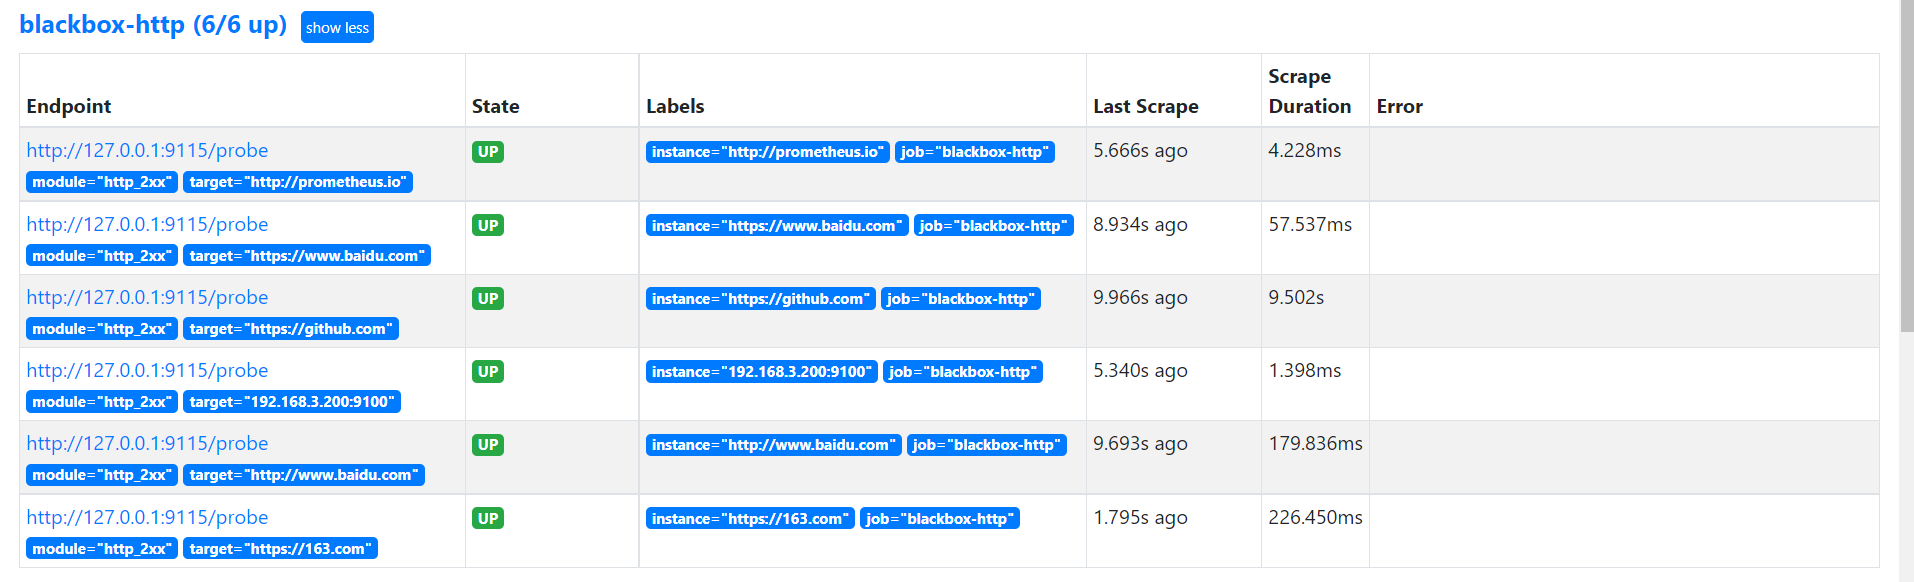
cat <<EOF > /opt/app/prometheus/sd/blackbox_http.json
[
  {
    "targets": [
      "172.20.70.205:9115",
      "http://prometheus.io",
      "http://www.baidu.com",
      "https://www.baidu.com",
      "https://github.com/"
    ]
  }
]
EOF


curl -X POST http://localhost:9090/-/reload
本节重点总结 :
- 基于文件的服务发现提供了一种配置静态目标的更通用的方法
- 可以摆脱对特定服务发现源的依赖
- 通常的做法是调用内部CMDB的接口获取target数据,打上标签,生成json文件发给prometheus采集