📢📢📢:先看关键单词,再看英文,最后看中文总结,再回头看一遍英文原文,效果更佳!!
关键词
|--------------|-------|-----------------|
| modular | 模块化的 | /ˈmɒdʒʊlə/ |
| percentile | 百分位数 | /pəˈsɛntaɪl/ |
| latency | 延迟 | /ˈleɪtənsi/ |
| configurable | 可配置的 | /kənˈfɪɡərəbəl/ |
| transaction | 事务,交易 | /trænˈzækʃən/ |
测试报告
The dashboard generator is a modular extension of JMeter. Its default behavior is to read and process samples from CSV files to generate HTML files containing graph views. It can generate the report at end of a load test or on demand.
This report provides the following metrics:
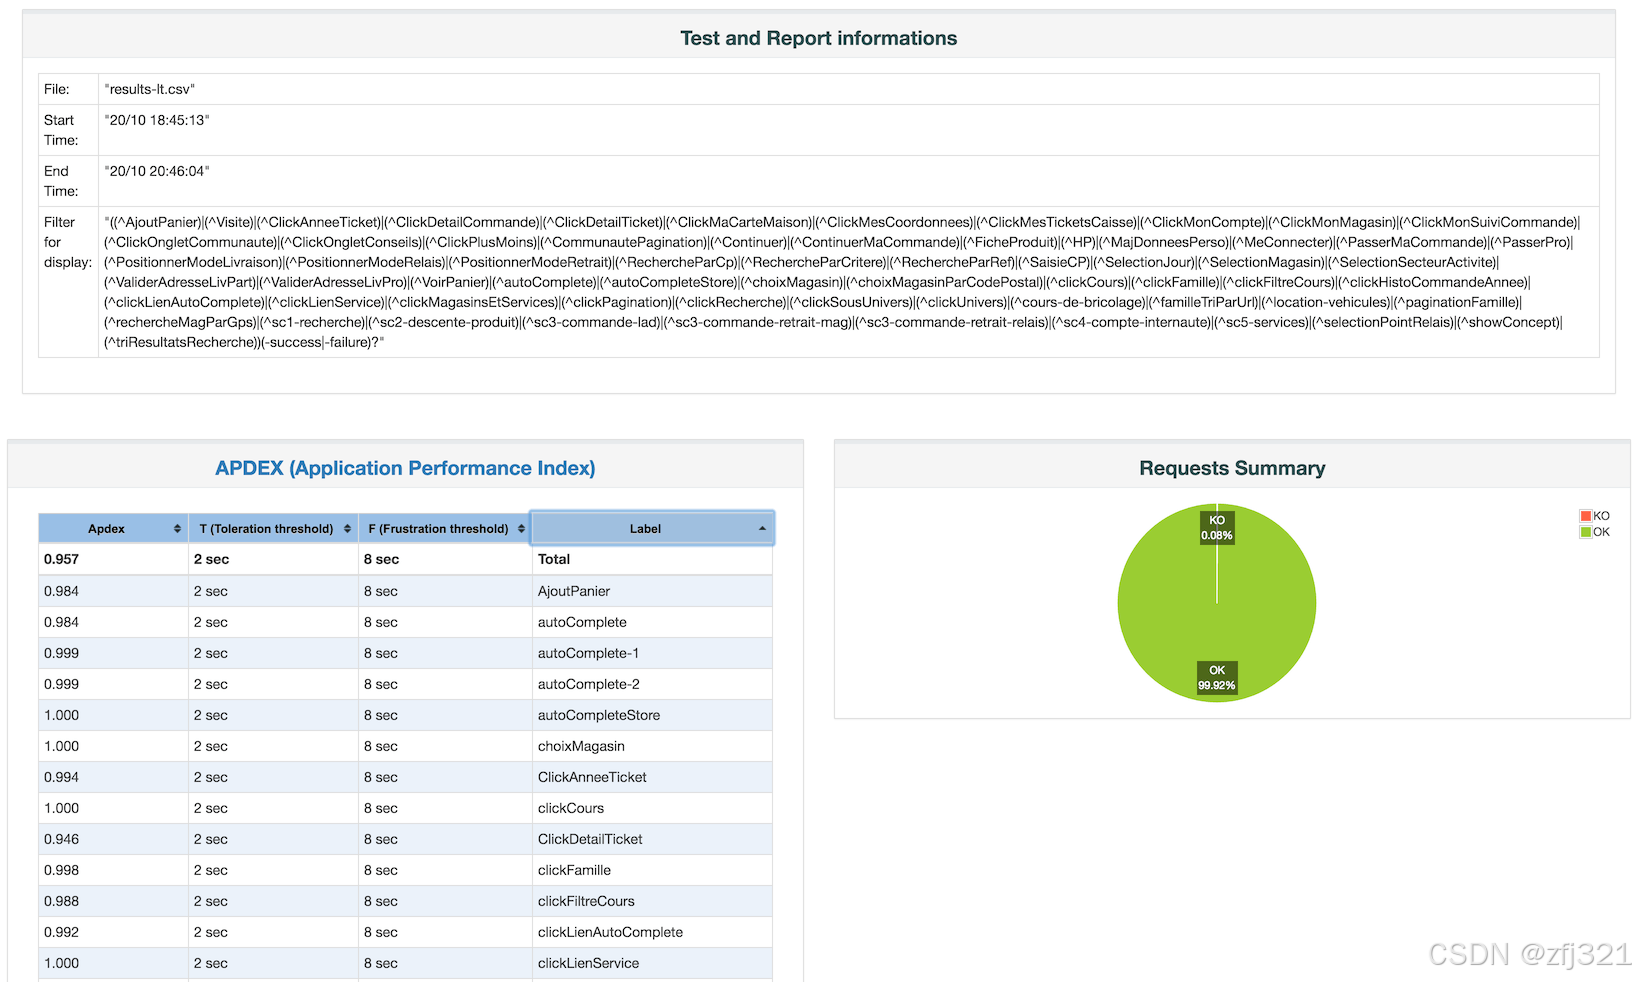
- APDEX (Application Performance Index) table that computes for every transaction the APDEX based on configurable values for tolerated and satisfied thresholds
- A request summary graph showing the Success and failed requests (Transaction Controller Sample Results are not taken into account) percentage:
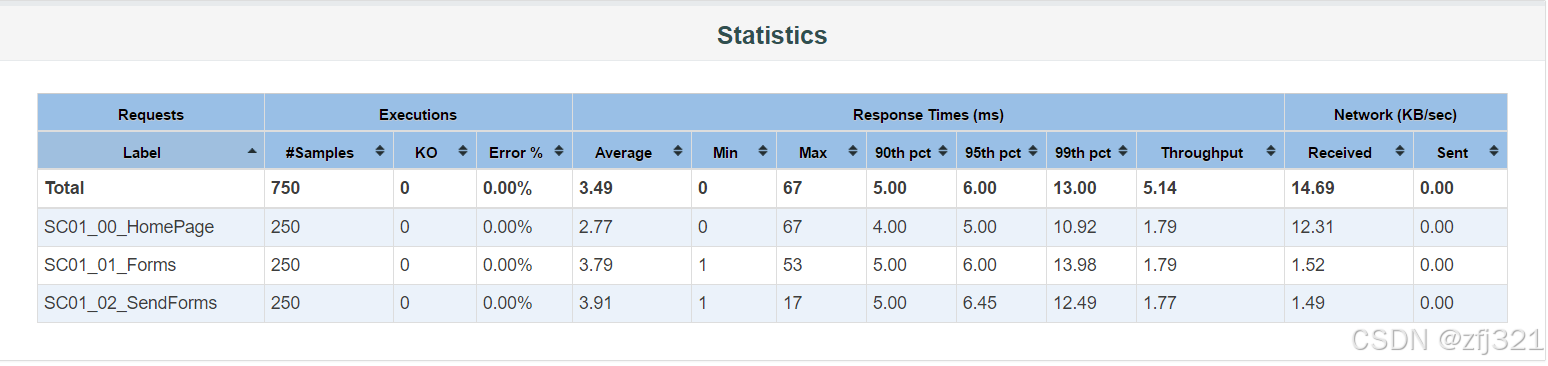
A Statistics table providing in one table a summary of all metrics per transaction including 3 configurable percentiles:
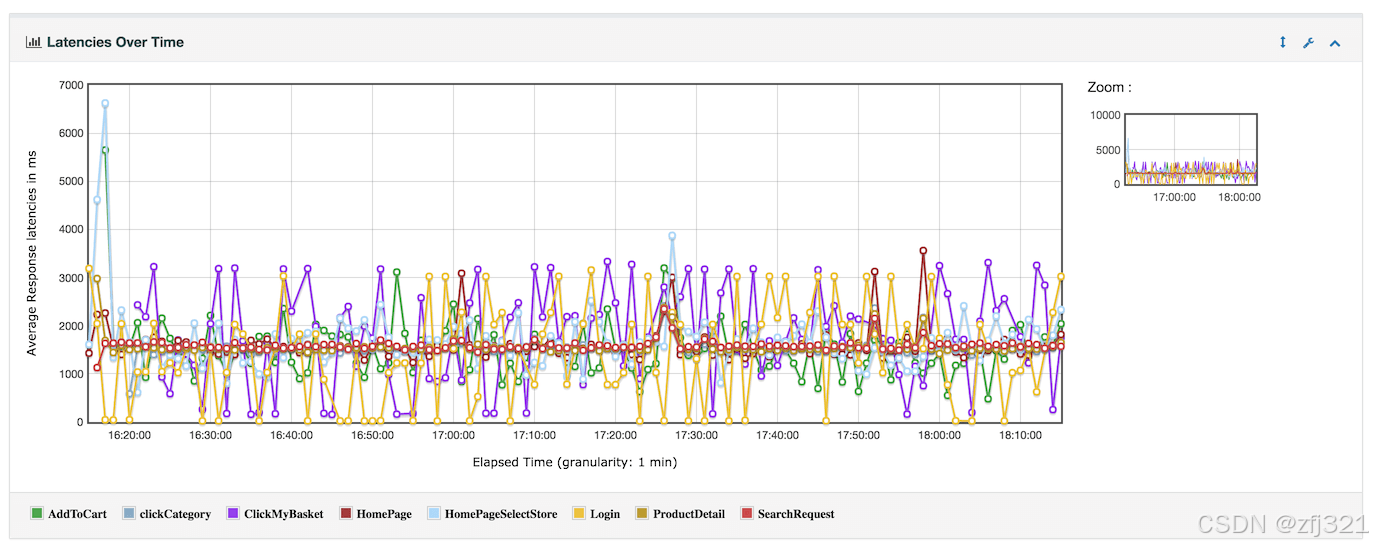
Latencies Over Time (Includes Transaction Controller Sample Results):
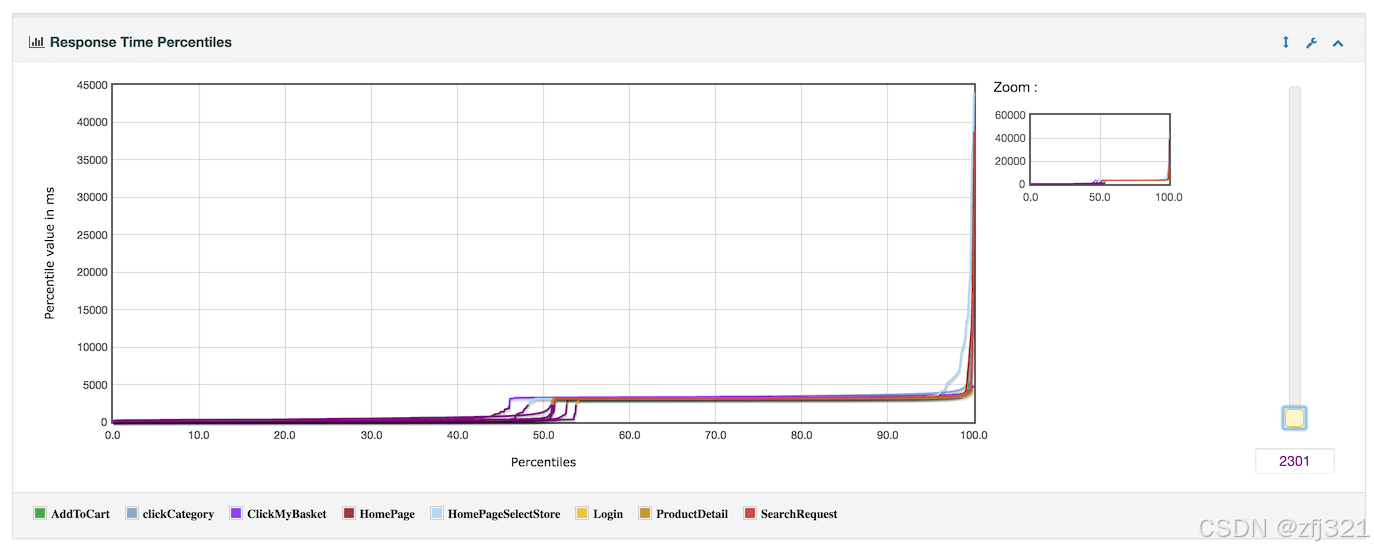
Response times percentiles (Includes Transaction Controller Sample Results):
测试报告的三种生成方式
The report generation can be done as a stand alone process from a sample log file or automatically after running load test.
Generation from an existing sample CSV log file
Use the following command:
jmeter -g <log file> -o <Path to output folder>Generation after load test
Use the following command:
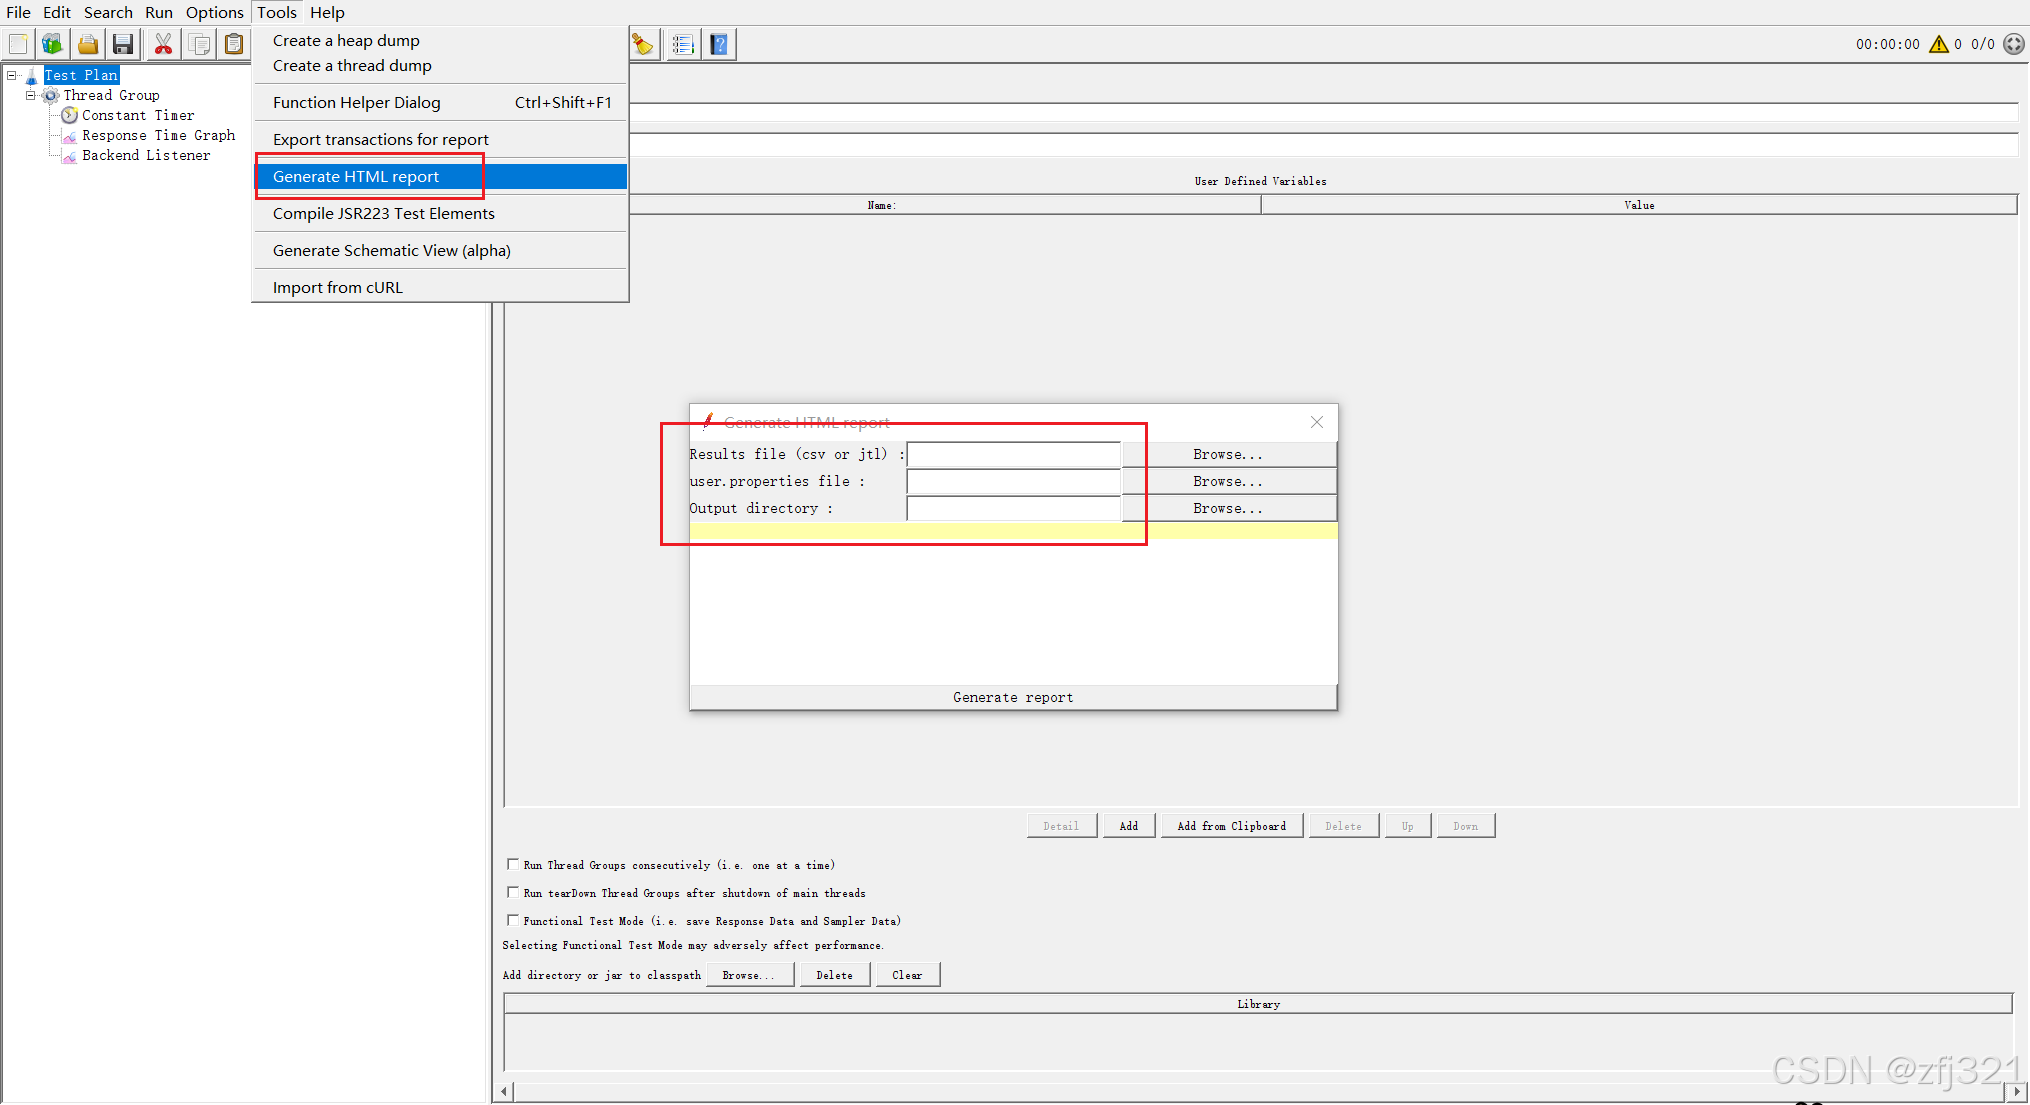
jmeter -n -t <test JMX file> -l <test log file> -e -o <Path to output folder>Generation using GUI Tools menu
You can generate the HTML report using menu item Tools → Generate HTML report:
总结
-
Dashboard Generator:
- 是JMeter的一个模块化扩展。
- 默认行为是读取和处理CSV文件中的样本,生成包含图表视图的HTML文件。
- 可以在负载测试结束后或按需生成报告。
-
报告提供的指标:
- APDEX表:基于可配置的容忍和满意阈值计算每个事务的APDEX。
- 请求摘要图:显示成功和失败请求的百分比(不包括事务控制器样本结果)。
- 统计表:提供每个事务的所有指标摘要,包括3个可配置的百分位数。
- 延迟随时间变化:包含事务控制器样本结果。
- 响应时间百分位数:包含事务控制器样本结果。
-
报告生成方式:
- 从现有样本CSV日志文件生成 :
使用命令:jmeter -g <log file> -o <Path to output folder> - 在负载测试后自动生成 :
使用命令:jmeter -n -t <test JMX file> -l <test log file> -e -o <Path to output folder> - 使用GUI工具菜单生成 :
通过菜单项Tools → Generate HTML report生成HTML报告。
- 从现有样本CSV日志文件生成 :