监控系统负载
系统负载介绍
系统负载平均值:Linux内核以活动请求数 的指数移动平均值来表示。
- 活动请求数 不仅包含运行中进程 ,还包含等待IO的进程,对应于R和D。等待IO包括处于睡眠等待预期磁盘和网络响应的任务。
- 指数移动平均值是一个数学公式,可以平滑趋势数据的高值和低值,更加准确地表示一段时间内系统负载,并确定系统负载是随着时间增加还是减少。
- 根据所有CPU活动请求数,每5秒计算一次Load Average 。通过汇总这些值,可以得到最近1分钟,5分钟和15分钟内的指数移动平均值。
- 一些UNIX系统仅考虑CPU使用率 或运行队列长度。Linux中负载平均值中还包含了对IO的考量,遇到负载平均值很高但CPU活动很低时,检查磁盘和网络活动。
- Linux将各个物理CPU核心和微处理器超线程计为独立执行单元。每个独立的执行单元拥有独立的请求队列。
查看系统负载
bash
# 查看CPU
[furongwang@localhost ~]$ lscpu
Architecture:          x86_64
CPU op-mode(s):        32-bit, 64-bit
Byte Order:            Little Endian
CPU(s):                2
On-line CPU(s) list:   0,1
Thread(s) per core:    1
Core(s) per socket:    1
座:                 2
NUMA 节点:         1
厂商 ID:           GenuineIntel
CPU 系列:          6
型号:              142
型号名称:        Intel(R) Core(TM) i5-8250U CPU @ 1.60GHz
步进:              10
CPU MHz:             1800.002
BogoMIPS:            3600.00
......

# 查看负载
[furongwang@localhost ~]$ uptime
 14:10:01 up  4:27,  3 users,  load average: 0.08, 0.03, 0.05

# 给系统加负载
[furongwang@localhost ~]$ md5sum /dev/zero &
[1] 6703
[furongwang@localhost ~]$ md5sum /dev/zero &
[2] 6712

# 等30秒左右
[furongwang@localhost ~]$ uptime
 14:12:54 up  4:30,  3 users,  load average: 1.24, 0.37, 0.16
负载解读
示例:4核心的CPU
-
负载为: 2.92 4.48 5.20
-
每个cpu负载为:0.73(2.92/4) 1.12(4.48/4) 1.30(5.20/4)
比较理想的值为 75% 左右。
top 命令
作用:动态查看进程信息,包括不同状态任务数量,CPU消耗和内存消耗。
bash
[root@localhost ~]# top
top - 14:21:09 up  4:38,  3 users,  load average: 0.00, 0.15, 0
Tasks: 190 total,   1 running, 189 sleeping,   0 stopped,   0 z
%Cpu(s):  0.0 us,  0.2 sy,  0.0 ni, 99.8 id,  0.0 wa,  0.0 hi,
KiB Mem :  1862996 total,   467632 free,   471112 used,   92425
KiB Swap:  2097148 total,  2097148 free,        0 used.  120692

   PID USER      PR  NI    VIRT    RES    SHR S  %CPU %MEM
  6582 root      20   0       0      0      0 S   0.3  0.0
  6756 root      20   0       0      0      0 S   0.3  0.0
     1 root      20   0  191256   4276   2616 S   0.0  0.2
     2 root      20   0       0      0      0 S   0.0  0.0
     4 root       0 -20       0      0      0 S   0.0  0.0
     6 root      20   0       0      0      0 S   0.0  0.0
     7 root      rt   0       0      0      0 S   0.0  0.0
     8 root      20   0       0      0      0 S   0.0  0.0
     9 root      20   0       0      0      0 S   0.0  0.0
    10 root       0 -20       0      0      0 S   0.0  0.0
    11 root      rt   0       0      0      0 S   0.0  0.0
    12 root      rt   0       0      0      0 S   0.0  0.0
    13 root      rt   0       0      0      0 S   0.0  0.0
# 内容实时刷新
%Cpu列解读:
- us,用户进程消耗CPU的时间
- sy,系统进程消耗CPU的时间
- wa,CPU用于等待IO进程的时间
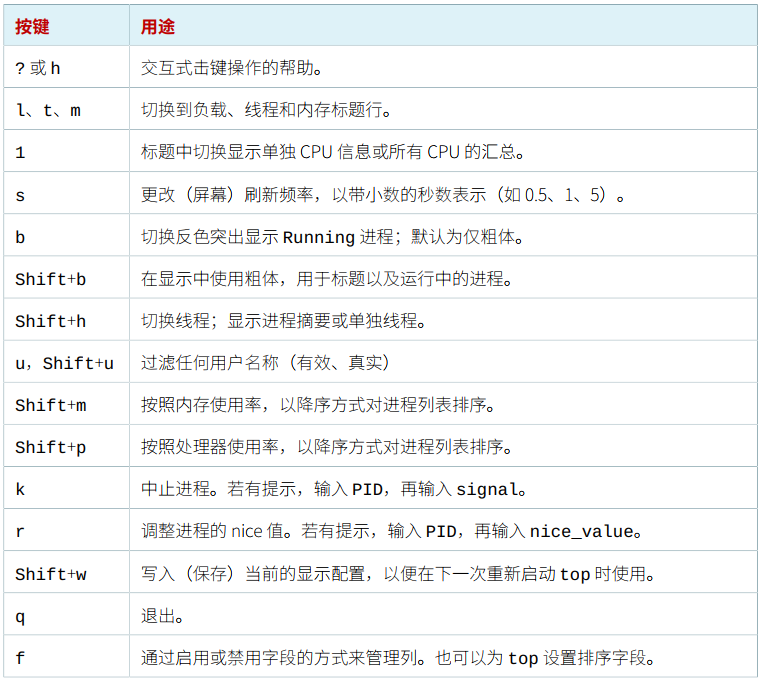
top命令快捷键
常用的命令:数字1,P,M,k,q,h。
free命令
作用:可以显示当前系统未使用的和已使用的内存数目,还可以显示被内核使用的内存缓冲区。
bash
[root@localhost ~]# free --help

Usage:
 free [options]

Options:
 -b, --bytes         show output in bytes
 -k, --kilo          show output in kilobytes
 -m, --mega          show output in megabytes
 -g, --giga          show output in gigabytes
     --tera          show output in terabytes
     --peta          show output in petabytes
 -h, --human         show human-readable output
     --si            use powers of 1000 not 1024
 -l, --lohi          show detailed low and high memory statistics
 -t, --total         show total for RAM + swap
 -s N, --seconds N   repeat printing every N seconds
 -c N, --count N     repeat printing N times, then exit
 -w, --wide          wide output

     --help     display this help and exit
 -V, --version  output version information and exit

For more details see free(1).
sar命令
sar(System Activity Reporter)是 Linux 系统中用于收集和报告系统活动信息的命令。它是 sysstat 包的一部分,能够实时和历史地显示 CPU 负载、内存使用、I/O 设备使用等统计信息。
bash
[root@localhost ~]# sar --help
用法: sar [ 选项 ] [ <时间间隔> [ <次数> ] ]
Options are:
[ -A ] [ -B ] [ -b ] [ -C ] [ -d ] [ -F [ MOUNT ] ] [ -H ] [ -h ] [ -p ] [ -q ] [ -R ]
[ -r ] [ -S ] [ -t ] [ -u [ ALL ] ] [ -V ] [ -v ] [ -W ] [ -w ] [ -y ]
[ -I { <int> [,...] | SUM | ALL | XALL } ] [ -P { <cpu> [,...] | ALL } ]
[ -m { <keyword> [,...] | ALL } ] [ -n { <keyword> [,...] | ALL } ]
[ -j { ID | LABEL | PATH | UUID | ... } ]
[ -f [ <filename> ] | -o [ <filename> ] | -[0-9]+ ]
[ -i <interval> ] [ -s [ <hh:mm:ss> ] ] [ -e [ <hh:mm:ss> ] ]
stress 工具
Linux 中的 stress 工具用于对系统进行压力测试,可模拟 CPU、内存、I/O 和磁盘等资源的高负载状态。通过指定参数(如 -c 压 CPU、-m 压内存)可创建负载,帮助发现系统在压力下的稳定性问题,常用于性能调优或硬件验证。
bash
# 安装
[root@localhost ~]# yum install -y stress

# 帮助信息
[root@localhost ~]# stress --help
`stress' imposes certain types of compute stress on your system

Usage: stress [OPTION [ARG]] ...
 -?, --help         show this help statement
     --version      show version statement
 -v, --verbose      be verbose
 -q, --quiet        be quiet
 -n, --dry-run      show what would have been done
 -t, --timeout N    timeout after N seconds
     --backoff N    wait factor of N microseconds before work starts
 -c, --cpu N        spawn N workers spinning on sqrt()
 -i, --io N         spawn N workers spinning on sync()
 -m, --vm N         spawn N workers spinning on malloc()/free()
     --vm-bytes B   malloc B bytes per vm worker (default is 256MB)
     --vm-stride B  touch a byte every B bytes (default is 4096)
     --vm-hang N    sleep N secs before free (default none, 0 is inf)
     --vm-keep      redirty memory instead of freeing and reallocating
 -d, --hdd N        spawn N workers spinning on write()/unlink()
     --hdd-bytes B  write B bytes per hdd worker (default is 1GB)

Example: stress --cpu 8 --io 4 --vm 2 --vm-bytes 128M --timeout 10s

Note: Numbers may be suffixed with s,m,h,d,y (time) or B,K,M,G (size).
压力测试-CPU
bash
# 消耗2个CPU
[root@localhost ~]# stress -c 2
stress: info: [6944] dispatching hogs: 2 cpu, 0 io, 0 vm, 0 hdd

# top监控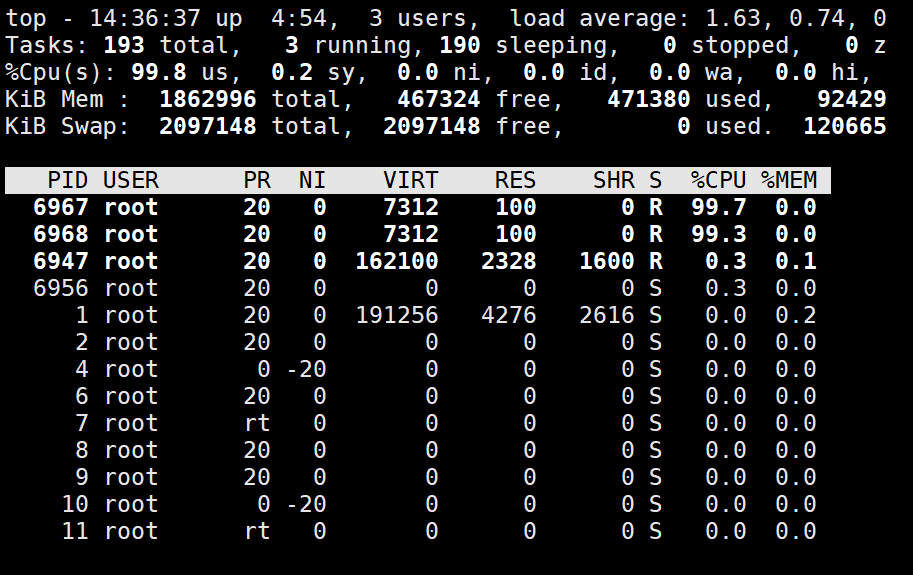
可以发现CPU被大幅占用。
压力测试-内存
bash
# 消耗前内存
[root@localhost ~]# free -m
              total        used        free      shared  buff/cache   available
Mem:           1819         459         457          16         902        1179
Swap:          2047           0        2047

# 消耗1G内存
[root@localhost ~]# stress -m 1 --vm-bytes 1G
stress: info: [6994] dispatching hogs: 0 cpu, 0 io, 1 vm, 0 hdd

# 消耗后内存
[root@localhost ~]# free -m
              total        used        free      shared  buff/cache   available
Mem:           1819        1413         136          15         268         230
Swap:          2047           1        2046
压力测试-磁盘
bash
# 消耗磁盘IO
[root@localhost ~]# stress -d 1 --hdd-bytes 2G
stress: info: [7034] dispatching hogs: 0 cpu, 0 io, 0 vm, 1 hdd

# 监视活动状态百分比,%util
[root@localhost ~]# sar -dp 5
......
14时42分56秒       DEV       tps  rd_sec/s  wr_sec/s  avgrq-sz  avgqu-sz     await     svctm     %util
14时43分01秒       sr0      0.00      0.00      0.00      0.00      0.00      0.00      0.00      0.00
14时43分01秒       sda     81.00     57.60  80283.00    991.86    149.24   1754.75     12.35    100.00
14时43分01秒 centos-root     81.20     57.60  78669.60    969.55    151.56   1761.56     12.32    100.00
14时43分01秒 centos-swap      0.00      0.00      0.00      0.00      0.00      0.00      0.00      0.00
14时43分01秒 centos-home      0.00      0.00      0.00      0.00      0.00      0.00      0.00      0.00

14时43分01秒       DEV       tps  rd_sec/s  wr_sec/s  avgrq-sz  avgqu-sz     await     svctm     %util
14时43分06秒       sr0      0.00      0.00      0.00      0.00      0.00      0.00      0.00      0.00
14时43分06秒       sda     98.40   1177.60  93824.80    965.47    130.20   1312.11     10.06     99.00
14时43分06秒 centos-root     94.80   1179.20  91136.00    973.79    132.13   1396.08     10.44     99.00
14时43分06秒 centos-swap      0.00      0.00      0.00      0.00      0.00      0.00      0.00      0.00
14时43分06秒 centos-home      0.00      0.00      0.00      0.00      0.00      0.00      0.00      0.00
......
网络测试
bash
# 传输一个大文件
[root@localhost ~]# wget http://192.168.43.100/%E7%B3%BB%E7%BB%9F%E9%95%9C%E5%83%8F/CentOS-7-x86_64-DVD-2207-02.iso

# 监控带宽
[root@localhost ~]# sar -n DEV 1
(此处结果可自行尝试)