本文介绍在html中使用leaflet显示高德地图和百度地图的方法。
基础知识
Web地图开发涉及很多内容。
如地图服务商,包括Google Maps、OpenStreetMap 、百度地图、高德地图、腾讯地图,各家服务不同,开放程度不同。
如GIS组件库。包括Leaflet、OpenLayers、Cesium、QGIS、Turf.js,还有后端服务的GeoServer。
还有其它知识,如矢量数据、栅格数据、地理坐标系、投影坐标系、墨卡托投影、GPS、WGS84坐标、GCJ-02坐标、BD-09坐标,等。
鉴于笔者以实用为准,无法深入研究原理,因此有的术语知道名称,有的知识点到为止,能在实际中使用即可。如有现成函数转换坐标系,能使用Leaflet显示预期的标注点,则不再研究墨卡托投影原理了。在编写离线地图服务器能达到预期结果时,则不再研究OGC标准。
实践
本节使用2个简单demo,用以显示两家不同的地图服务商提供的地图服务。
一般套路
本文使用leaflet创建地图,利用其提供的API加载图层,显示标注点。主要思路有:
- 引入
leaflet。包括css和js文件。 - 创建
mapHTML 元素,使用L.map('map')初始化地图。 - 根据不同图商提供的URL,创建地图图层,使用
addTo接口添加到地图中。 - 根据需求,使用
L.marker创建标注点,使用addTo接口添加到地图中。可以设置marker点击事件显示地点信息。
leaflet库功能强大,后续有待深入研究。
高德地图显示
高德地图提供的电子地图URL为http://webrd02.is.autonavi.com/appmaptile?lang=zh_cn&size=1&scale=1&style=8&x={x}&y={y}&z={z}。
显示高德地图demo完整代码文件如下:
html
<!DOCTYPE html>
<html>
<head>
<meta charset="utf-8" />
<title>高德地图 Demo</title>
<link rel="stylesheet" href="https://unpkg.com/leaflet@1.9.4/dist/leaflet.css" />
<style>
body {
margin: 0;
padding: 0;
}
#map {
width: 100vw;
height: 100vh;
}
</style>
</head>
<body>
<div id="map"></div>
<script src="https://unpkg.com/leaflet@1.9.4/dist/leaflet.js"></script>
<script>
// 初始化地图
var map = L.map('map').setView([22.817, 108.366], 12);
// 高德地图
var gaodeUrl = "http://webrd02.is.autonavi.com/appmaptile?lang=zh_cn&size=1&scale=1&style=8&x={x}&y={y}&z={z}";
// 添加高德地图图层
L.tileLayer(gaodeUrl, {
maxZoom: 18,
minZoom: 3,
attribution: '高德地图'
}).addTo(map);
// 添加南宁标记
var marker = L.marker([22.817, 108.366]).addTo(map);
marker.bindPopup("<b>广西南宁</b>");
marker.bindTooltip("<b>广西南宁市</b>")
</script>
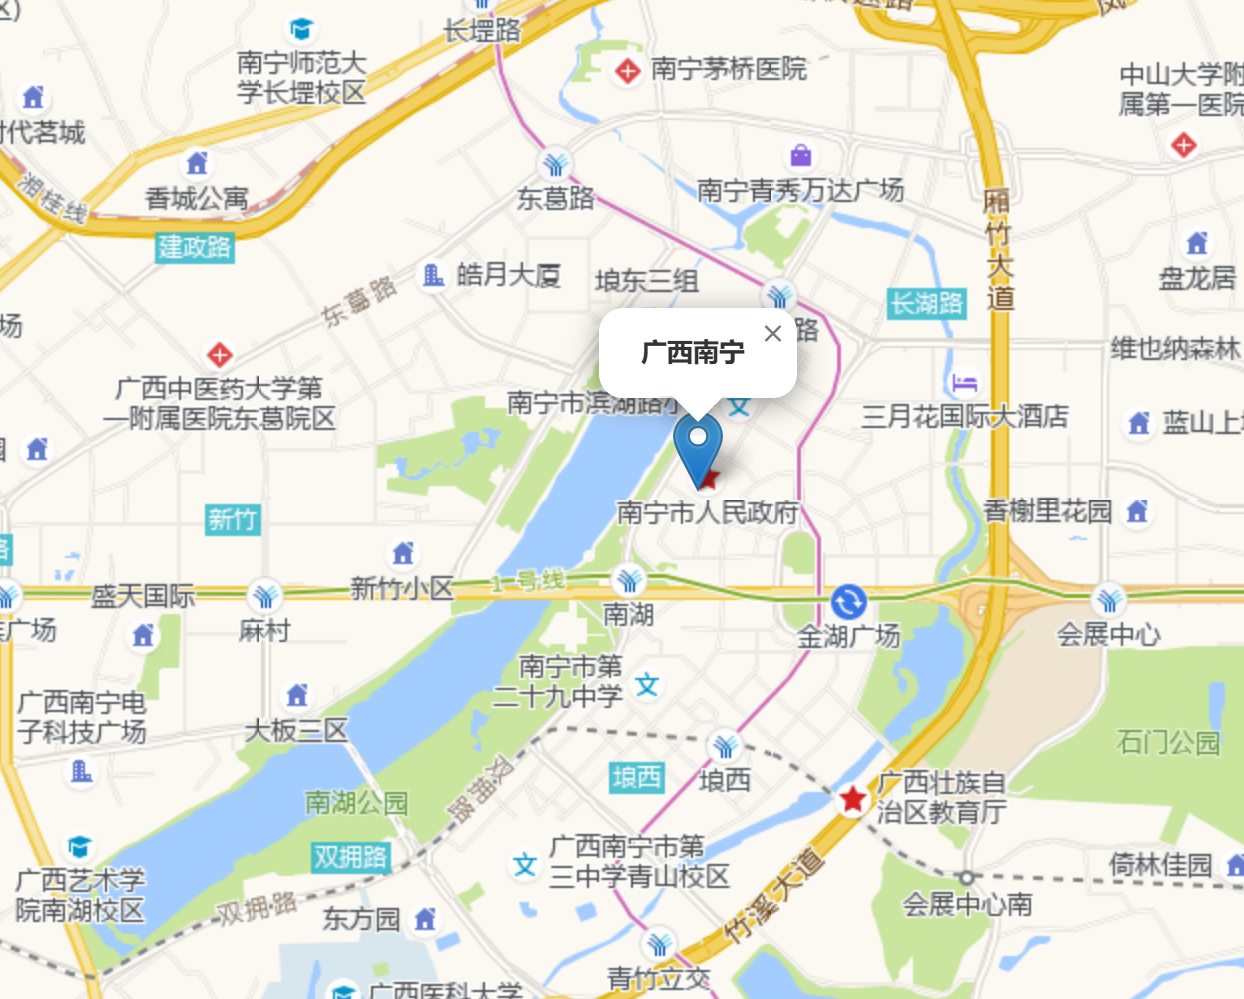
</body>
</html>效果图如下所示:
百度地图显示
高德地图提供的电子地图URL为http://maponline{s}.bdimg.com/tile/?x={x}&y={y}&z={z}&&qt=vtile&styles=pl&showtext=1&scaler=2&v=083。demo完整代码文件如下:
html
<!DOCTYPE html>
<html>
<head>
<title>百度地图 Demo</title>
<meta charset="utf-8">
<style type="text/css">
body { padding: 0; margin: 0; }
html, body, #map { height: 100%; }
#param-test { position: absolute; z-index: 999; left: 10px; top: 10px; background: white; padding: 0 3px; line-height: 28px; font-size: 14px }
#url-input { width: 450px; height: 18px; margin-bottom: 3px; }
</style>
<link rel="stylesheet" href="https://unpkg.com/leaflet@1.9.2/dist/leaflet.css" />
<script src="https://unpkg.com/leaflet@1.9.2/dist/leaflet.js"></script>
<script src="https://unpkg.com/gcoord@0.3.2/dist/gcoord.js"></script>
</head>
<body>
<div id="map" />
</body>
<script type="text/javascript">
L.Projection.BaiduMercator = L.Util.extend({}, L.Projection.Mercator)
L.CRS.Baidu = L.Util.extend({}, L.CRS.Earth, {
code: 'EPSG:Baidu',
projection: L.Projection.BaiduMercator,
transformation: new L.transformation(1, 0.5, -1, 0.5),
scale: function (zoom) { return 1 / Math.pow(2, (18 - zoom)) },
zoom: function (scale) { return 18 - Math.log(1 / scale) / Math.LN2 },
wrapLng: undefined
})
L.TileLayer.BaiDuTileLayer = L.TileLayer.extend({
initialize: function (param, options) {
var templateUrl = "http://maponline{s}.bdimg.com/tile/?x={x}&y={y}&z={z}&&"
var otherUrl = "qt=vtile&styles=pl&showtext=1&scaler=2&v=083" // 电子地图,图形 + 注记
var myUrl = templateUrl + otherUrl
options = L.extend({
getUrlArgs: (o) => { return { x: o.x, y: (-1 - o.y), z: o.z } },
p: param, subdomains: "0123", minZoom: 0, maxZoom: 23, minNativeZoom: 1, maxNativeZoom: 18
}, options)
L.TileLayer.prototype.initialize.call(this, myUrl, options)
},
getTileUrl: function (coords) {
if (this.options.getUrlArgs) {
return L.Util.template(this._url, L.extend({ s: this._getSubdomain(coords), r: L.Browser.retina ? '@2x' : '' }, this.options.getUrlArgs(coords), this.options))
} else {
return L.TileLayer.prototype.getTileUrl.call(this, coords)
}
},
_setZoomTransform: function (level, center, zoom) {
center = L.latLng(gcoord.transform([center.lng, center.lat], gcoord.WGS84, gcoord.BD09).reverse()) // 采用 gcoord 库进行纠偏
L.TileLayer.prototype._setZoomTransform.call(this, level, center, zoom)
},
_getTiledPixelBounds: function (center) {
center = L.latLng(gcoord.transform([center.lng, center.lat], gcoord.WGS84, gcoord.BD09).reverse()) // 采用 gcoord 库进行纠偏
return L.TileLayer.prototype._getTiledPixelBounds.call(this, center)
}
})
// 创建图层
L.tileLayer.baiDuTileLayer = function (param, options) { return new L.TileLayer.BaiDuTileLayer(param, options) }
myLayer = L.tileLayer.baiDuTileLayer()
// 创建map,并叠加
var map = L.map("map", {
crs: L.CRS.Baidu
})
map.setView([22.817, 108.366], 12);
// 添加南宁标记
var marker = L.marker([22.817, 108.366]).addTo(map);
marker.bindPopup("<b>广西南宁</b>");
marker.bindTooltip("<b>广西南宁市</b>")
map.addLayer(myLayer)
</script>
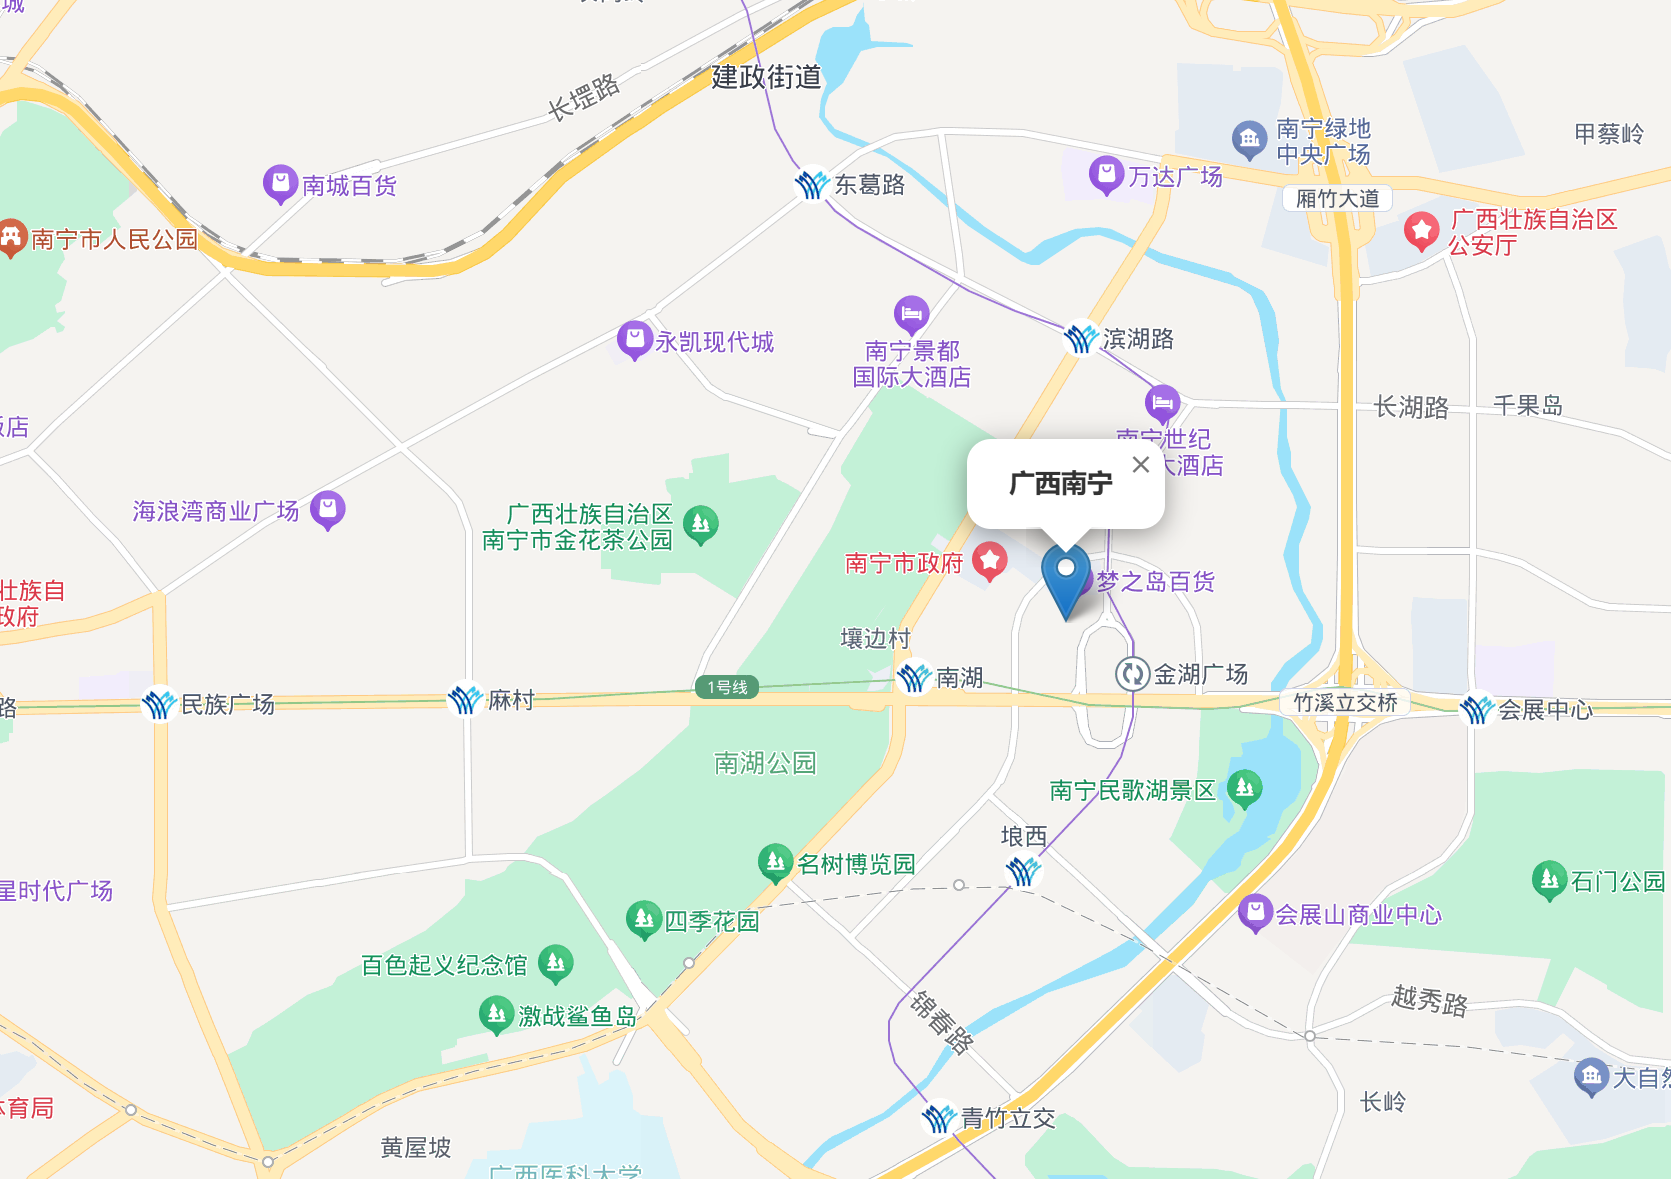
</html>效果图如下所示:
小结
从上面代码可以看到,百度地图的显示稍微复杂些。从显示效果上看,高德地图好一些。
经一段时间调研、测试、使用,发现高德地图相对好一些------无论是开放接口程度还是开发便捷性。因此,后续将使用高德地图平台。
代码
本文有配套代码,工程目录:https://github.com/latelee/mapdemo。demo文件名分别为`0.显示地图-高德.html`、`0.显示地图-百度.html`。