本文介绍使用GeoJSON显示特定地理区域------如省份、市、县的方法。
基础知识
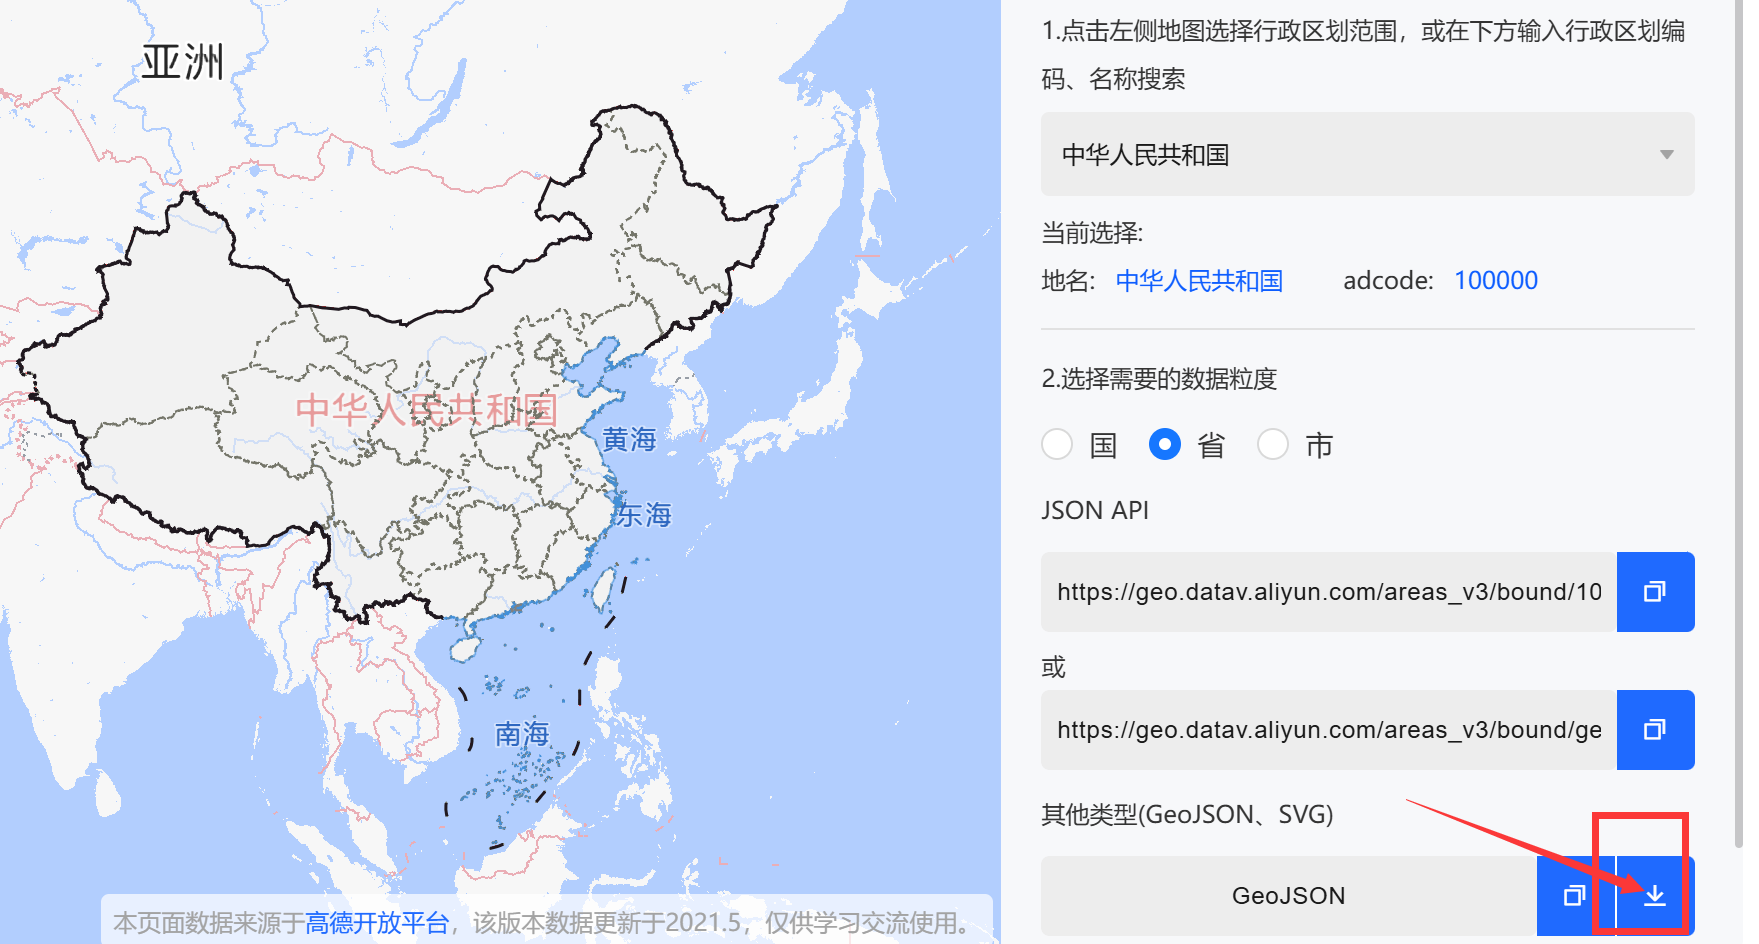
本文使用的地理数据由阿里云"DataV数据可视化平台"提供,下载地址:http://datav.aliyun.com/portal/school/atlas/area_selector
该平台提供全国及各省、市的GeoJSON标准的文件下载,也支持SVG格式,本文使用前者。
实践
从本文开始,对于html引用的第三方组件,将慢慢下载到本地目录,减少对网络的依赖,目录也会多一些。但总的来说,还是尽量保持只有一个html完成demo的演示,如功能较复杂,则再考虑nodejs或go实现后端。
也因此,笔者下载的json文件,会拷贝一份改为js格式,添加变量,将其作为js数据。在实际应用中,应该使用后端提供数据,再用axios之类请求返回结果。
不过,作为demo,能达到demo的目的即可,更完美的功能,待真正应用到项目中再打磨。
下载
打开前述地址,下载json数据,包括全国、全国各省、广西壮族自治区、南宁市等json文件。示例如下:
GeoJSON格式
下面从下载的json文件抽出关键数据,以表示
{
    "type": "FeatureCollection",
    "features": [
        {
            "type": "Feature",
            "properties": {
                "adcode": 450100,
                "name": "南宁市",
                "center": [
                    108.320004,
                    22.82402
                ],
                "centroid": [
                    108.467546,
                    23.055985
                ],
                "childrenNum": 12,
                "level": "city",
                "parent": {
                    "adcode": 450000
                },
                "subFeatureIndex": 0,
                "acroutes": [
                    100000,
                    450000
                ]
            },
            "geometry": {
                "type": "MultiPolygon",
                "coordinates": [
                    [
                      [
                        [109.217018,23.296826],
                        [109.207808,23.299964],
                        // more ...
                      ]
                    ]
                ]
            }
        },
        {
            "type": "Feature",
            "properties": {
                "adcode": 450200,
                "name": "柳州市",
                "center": [
                    109.411703,
                    24.314617
                ],
                "centroid": [
                    109.374902,
                    24.94791
                ],
                "childrenNum": 10,
                "level": "city",
                "parent": {
                    "adcode": 450000
                },
                "subFeatureIndex": 1,
                "acroutes": [
                    100000,
                    450000
                ]
            },
            "geometry": {
                "type": "MultiPolygon",
                "coordinates": [
                    [
                        [
                        ... // 坐标
                        ]
                ]
            }
        },
        // 其它市
        ...
    ]
}
字段说明如下:
- type 根对象,必须为 FeatureCollection
- features 包含所有地理要素的数组,因此features 为复数形式,以广西为例,包含14个地级市,每个市为一个feature。
- features\[\].type 要素类型(必须是 Feature)
- features\[\].properties 自定义属性,如名称、编码、中心坐标等,根据实际情况填写
- features\[\].geometry 几何对象(点/线/面)
- geometry.type 几何类型,如 Point、LineString、Polygon、MultiPolygon等
- geometry.coordinates 经纬度坐标数组,WGS84或GCJ02坐标系,坐标顺序为经度、纬度,就我国位置而言,数值大的在前面。但像leaflet组件,使用的坐标的顺序是纬度、经度,需要注意。
再看一下类似的例子(可重点关注properties内容):
{
  "type": "FeatureCollection",
  "name": "广西壮族自治区",
  "features": [
    {
      "type": "Feature",
      "properties": {
        "name": "南宁市",
        "code": "450100",
        "population": 874.16,
        "area": 22112
      },
      "geometry": {
        "type": "MultiPolygon",
        "coordinates": [
          [
            [
              [108.3201, 22.8245],
              [108.3252, 22.8267],
              [108.3298, 22.8301],
              [108.3315, 22.8342],
              [108.3309, 22.8390],
              [108.3278, 22.8423],
              [108.3201, 22.8245]
            ]
          ]
        ]
      }
    },
    {
      "type": "Feature",
      "properties": {
        "name": "柳州市",
        "code": "450200",
        "population": 415.79,
        "area": 18618
      },
      "geometry": {
        "type": "MultiPolygon",
        "coordinates": [
          [
            [
              [109.4221, 24.3355],
              [109.4263, 24.3389],
              [109.4300, 24.3421],
              [109.4325, 24.3467],
              [109.4318, 24.3512],
              [109.4280, 24.3544],
              [109.4221, 24.3355]
            ]
          ]
        ]
      }
    }
  ]
}
demo代码
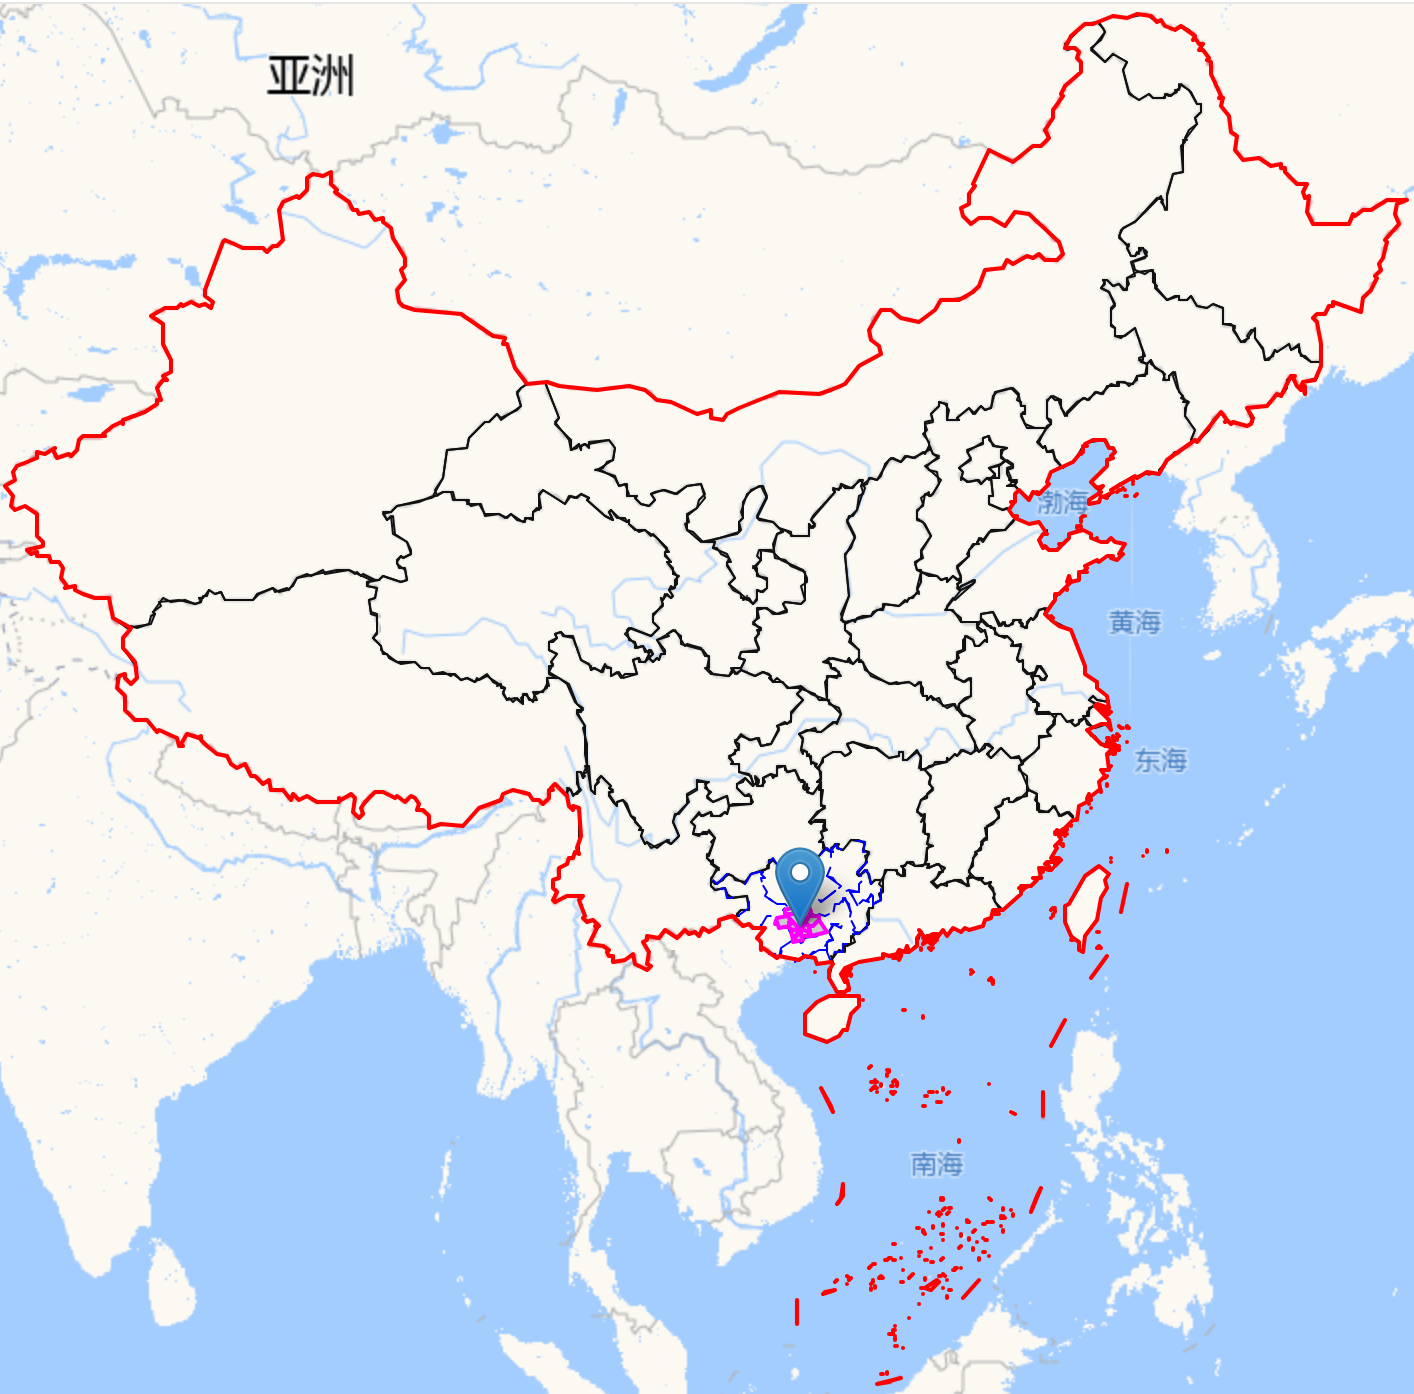
本demo支持叠加在线地图,如仅显示地理区域,则可以不叠加。
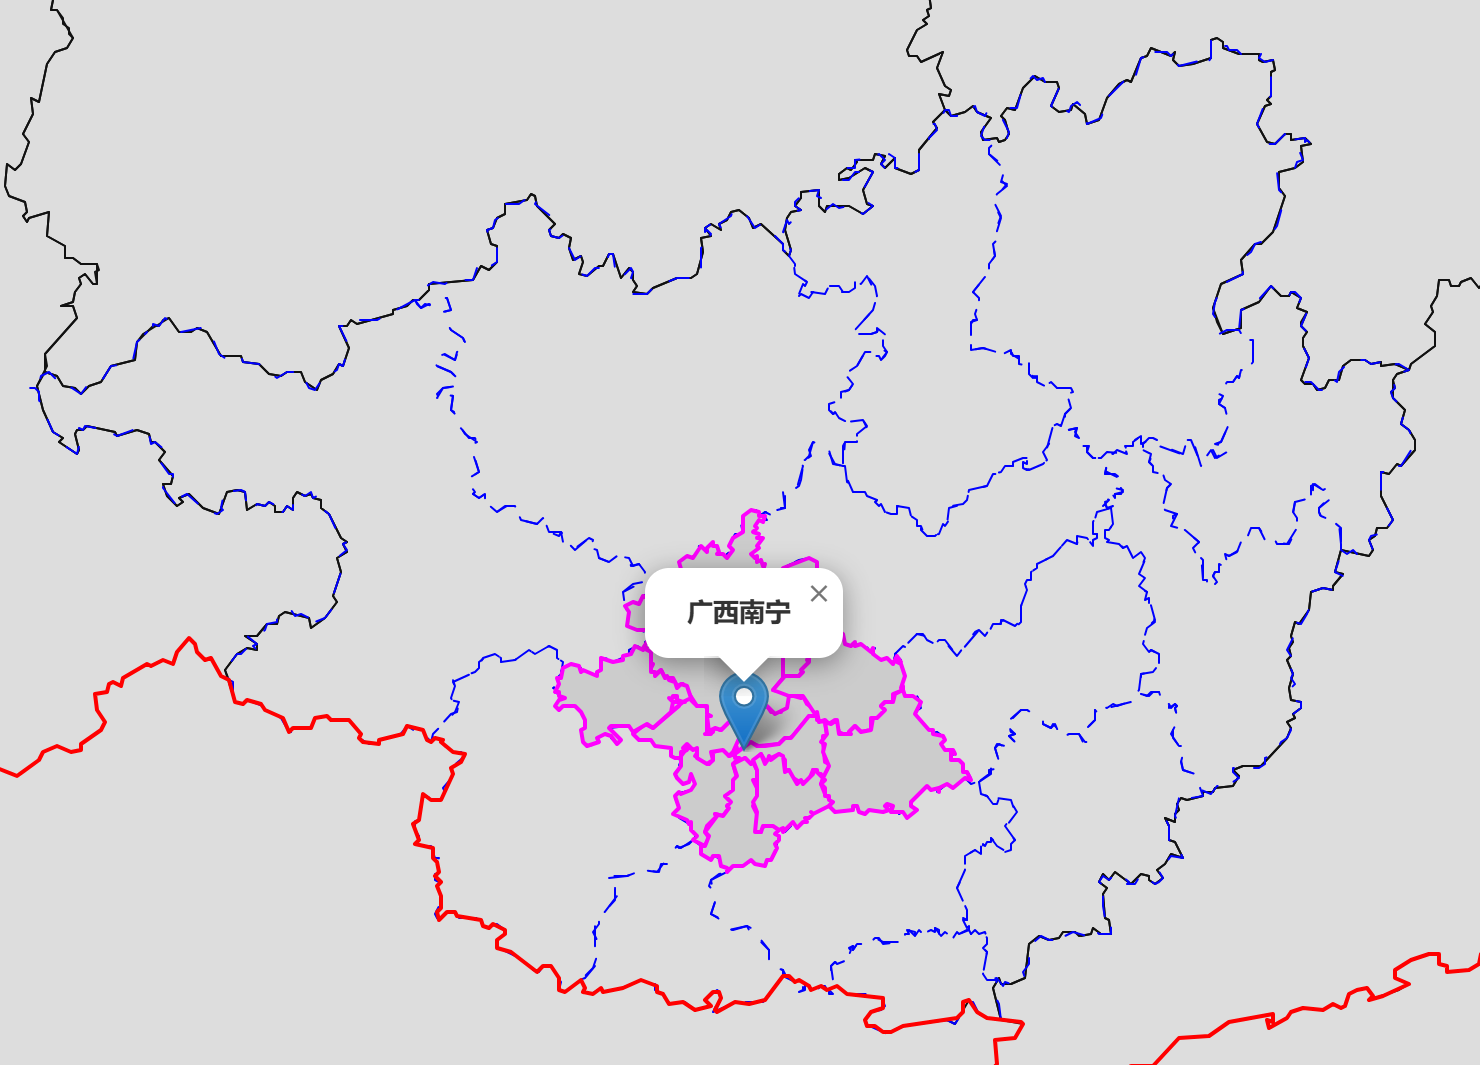
纯轮廓显示效果:
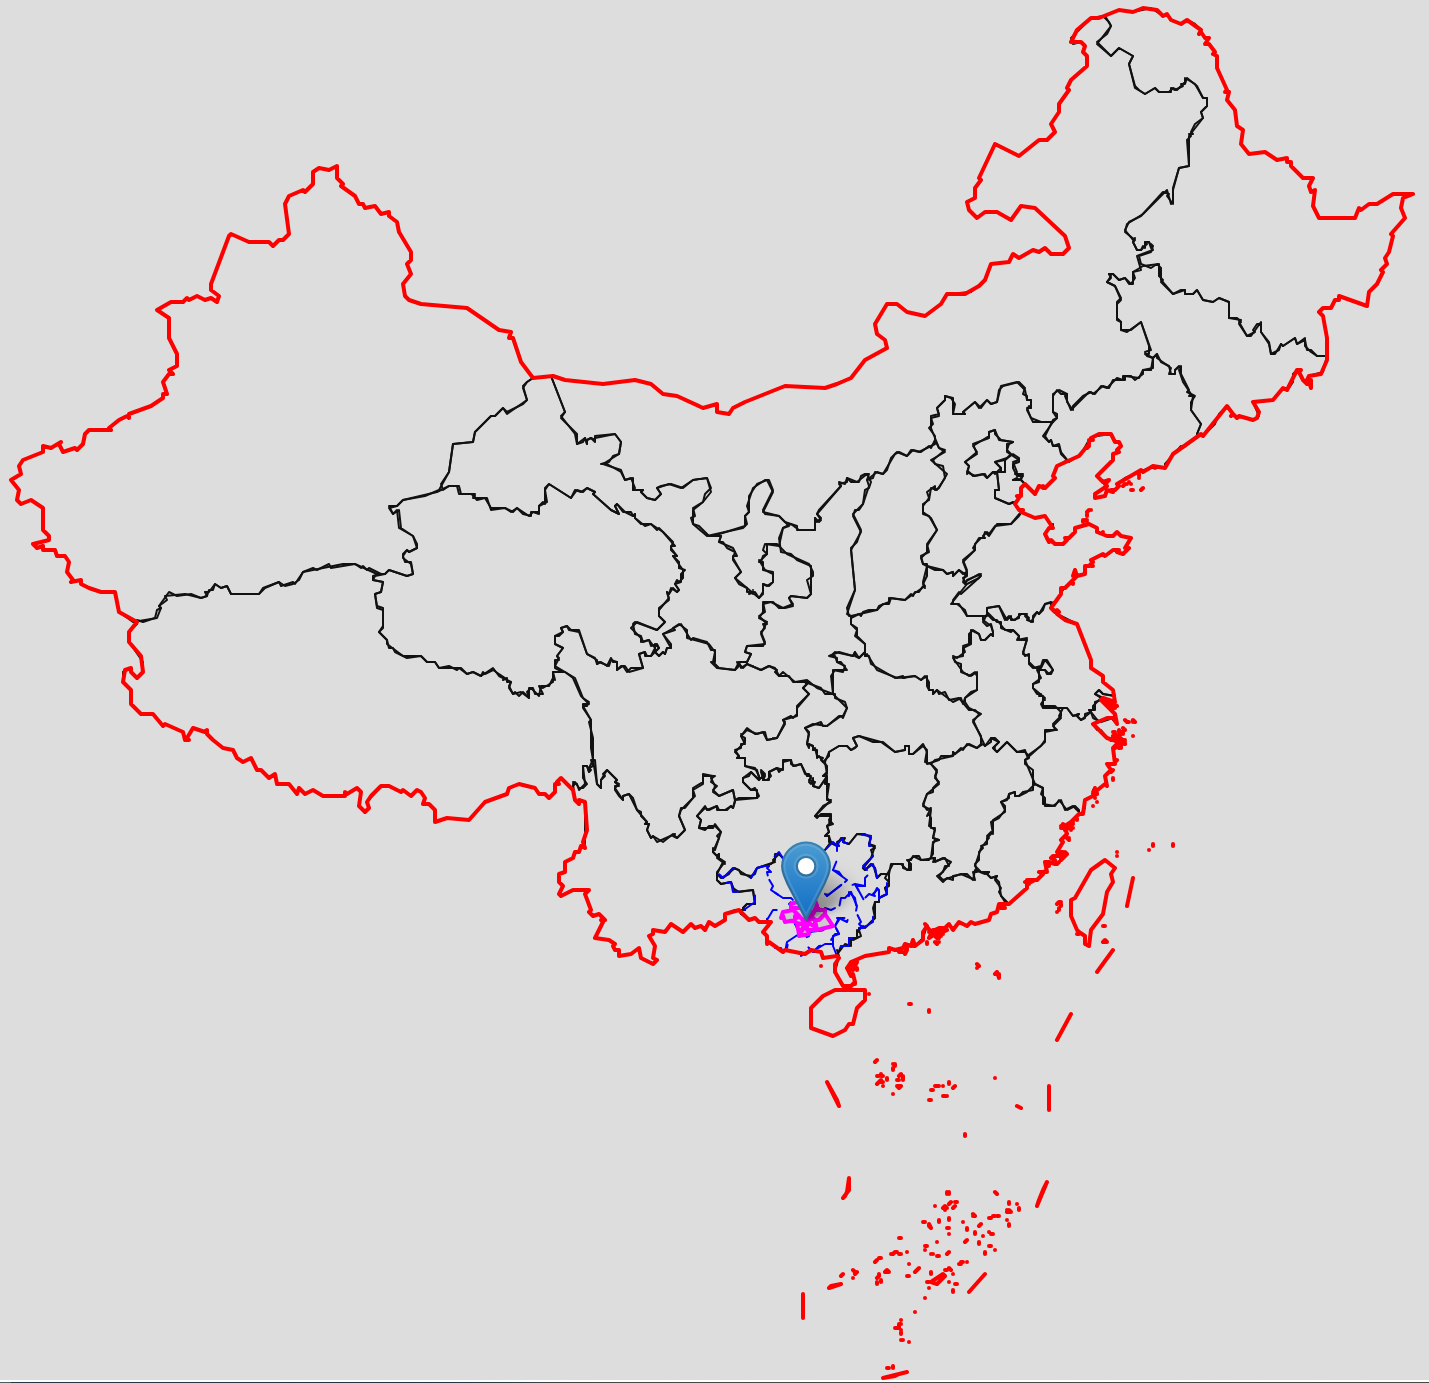
放大广西区域效果如下:
叠加在线地图效果如下:
完整测试代码如下所示,由于引用了本地文件,有兴趣的可直接到文后仓库地址下载代码使用。
<!DOCTYPE html>
<html>
<head>
    <meta charset="utf-8" />
    <title>高德地图 Demo</title>
    <link rel="stylesheet" href="mymap/leaflet/dist/leaflet.css" />
    <style>
        body {
            margin: 0;
            padding: 0;
        }
        #map {
            width: 100vw;
            height: 100vh;
        }
    </style>
</head>

<script src="mymap/leaflet/dist/leaflet.js"></script>

<!-- 本地geojson,直接引入-->
<script src="mymap/data/china.js"></script>
<script src="mymap/data/china_simple.js"></script>
<script src="mymap/data/gxData.js"></script>
<script src="mymap/data/naningData.js"></script>


<body>
    <div id="map"></div>
</body>


<script type="text/javascript">

const myStyle1 = {
    color: "#111111",  // 灰色边框
    weight: 1,
    opcacity: 0.3,
    fillColor: 'transparent',  // 无填充色
    fillOpacity: 0,
};

const myStyle2 = {
    color: "#0000ff", // 蓝色边框
    weight: 1,
    opcacity: 0.3,
    fillColor: 'transparent',
    fillOpacity: 0,
    dashArray: "10, 10", // 边框虚线
};

const myStyle3 = {
    color: "#ff00ff",  // 紫色边框
    weight: 2,
    opcacity: 0.3,
    fillColor: '#cccccc',  // 有填充颜色
    fillOpacity: 1,
};

const myStyleRed = {
    color: "#ff0000",  // 红色边框
    weight: 2,
    opcacity: 0.3,
    fillColor: 'transparent',  // 有填充颜色
    fillOpacity: 1,
};

function main() {
    // 初始化地图
    var mymap = L.map('map').setView([22.817, 108.366], 8);

    var gaodeUrl = "http://webrd02.is.autonavi.com/appmaptile?lang=zh_cn&size=1&scale=1&style=8&x={x}&y={y}&z={z}";

    // 添加高德地图图层
    mapLayer = L.tileLayer(gaodeUrl, {
        maxZoom: 18,
        minZoom: 3,
        attribution: '高德地图'
    })

    // 添加高德在线地图图层
    // mapLayer.addTo(mymap);

    var marker = L.marker([22.817, 108.366]).addTo(mymap);
    marker.bindPopup("<b>广西南宁</b>");
    marker.bindTooltip("<b>广西南宁市</b>")
    showBoundray(mymap) // 显示边界和轮廓图
}

function getProvLayer(geoProv, map, style1) {
    L.geoJSON(geoProv,
    {
        style: style1,
        onEachFeature: function(feature, layer) {
            // 添加城市名称
            if (feature.properties && feature.properties.name) {
                layer.bindTooltip(feature.properties.name, {
                    permanent: false,
                    direction: 'center',
                    className: 'city-label'
                });
            }
        }
    }).addTo(map)
}

function showBoundray(map) {
    // 先全国各省
    getProvLayer(geoJsonChina, map, myStyle1)
    // 再到广西
    getProvLayer(gxData, map, myStyle2)
    // 再到南宁
    getProvLayer(naningData, map, myStyle3)
    // 全国轮廓,最后叠加,红色显示
    getProvLayer(geoJsonChinaSimple, map, myStyleRed)
}

// last....
main();

</script>

</html>
再次重申,本文代码------包括后续的仓库代码,仅用于演示目的,不具生产实践指导作用。
小结
网上有用echarts展示地图及数据的资料,不过目前笔者还未使用到。根据计划,先将一些和地图有关的内容写完,再择机扩展。
代码
本文有配套代码,工程目录:https://github.com/latelee/mapdemo。demo文件名为`1.显示广西轮廓图.html`。