看过的知识不等于学会。唯有用心总结、系统记录,并通过温故知新反复实践,才能真正掌握一二
作为一名摸爬滚打三年的前端开发,开源社区给了我饭碗,我也将所学的知识体系回馈给大家,助你少走弯路!
OpenLayers、Leaflet 快速入门 ,每周保持更新 2 个案例
Cesium 快速入门,每周保持更新 4 个案例
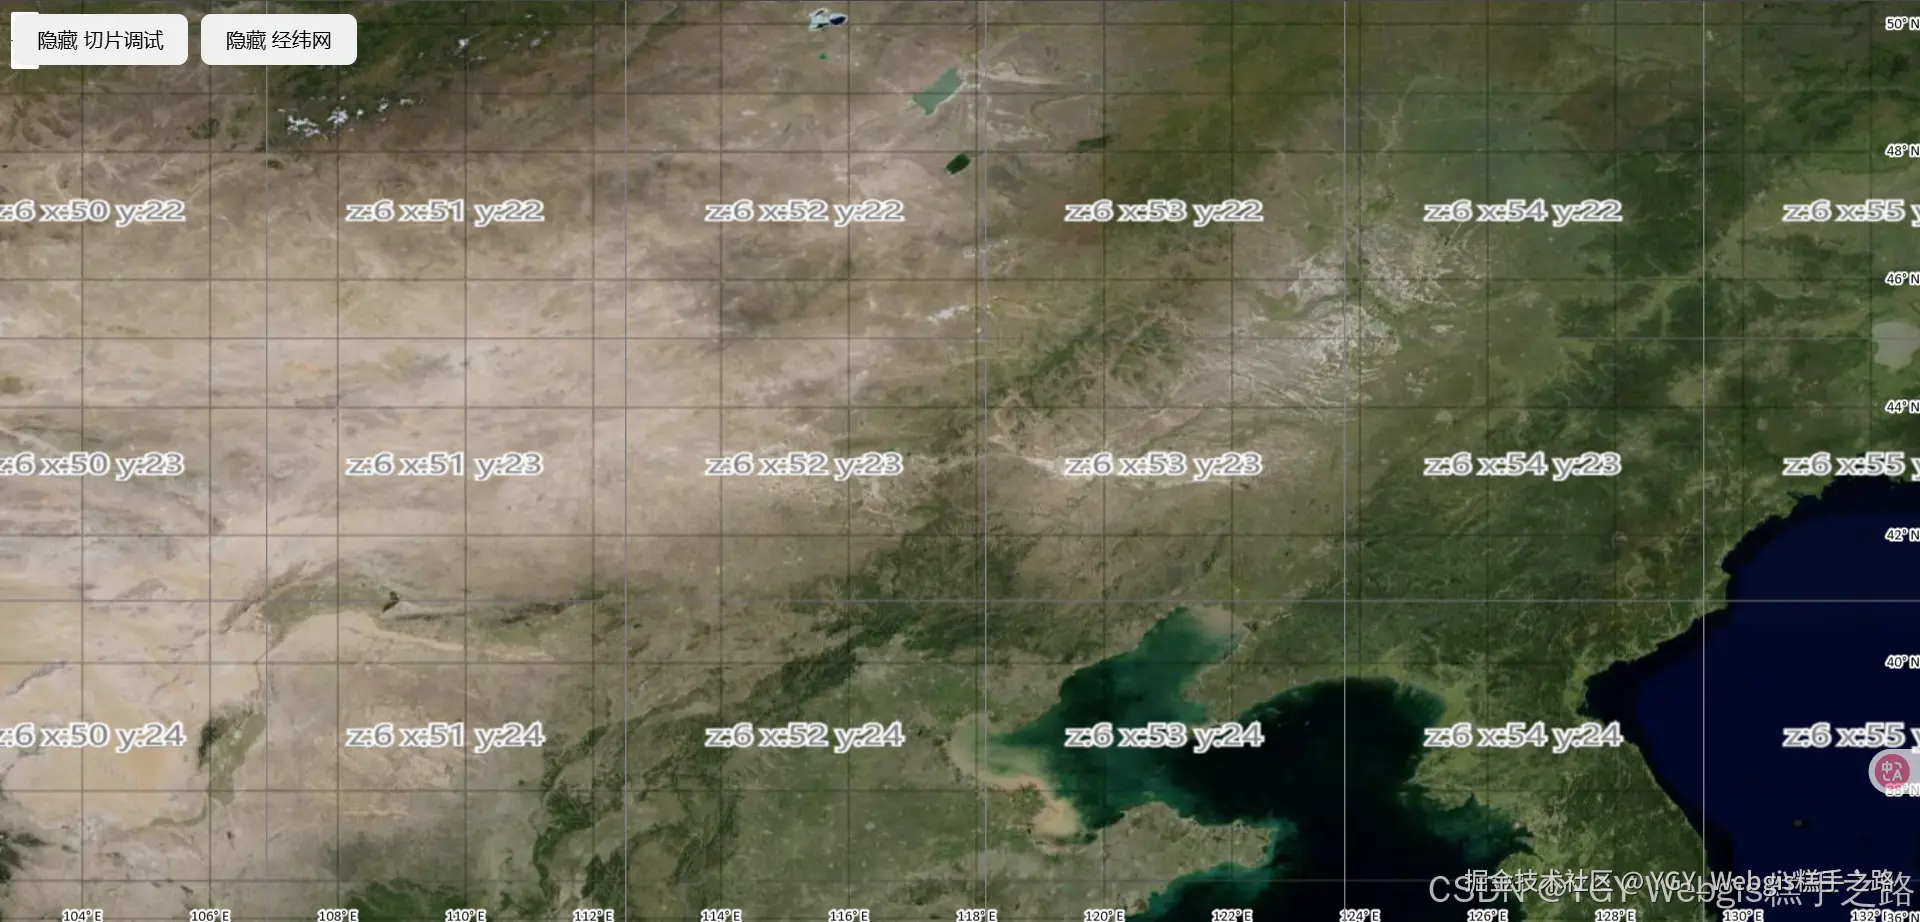
OpenLayers 综合案例-切片坐标与经纬网调试
Vue 3 + OpenLayers 实现的 WebGIS 应用提供了完整的切片坐标与经纬网调试功能
介绍
- 使用切片调试(Tile Debug)和经纬网(Graticule)。
- 切片调试功能可以帮助开发者查看地图切片的加载情况。
- 经纬网功能可以在地图上显示经纬度网格线,便于定位和测量。
技术栈
该环境下代码即拿即用
bash
Vue 3.5.13+
Openlayers 10.5.0+
Vite 6.3.5+
vue
<template>
  <div class="map-container">
    <div ref="mapContainer" class="map-element"></div>
    <!-- 控制按钮区域 -->
    <div class="controls">
      <!-- 切换 Tile Debug 图层的按钮 -->
      <button @click="toggleTileDebug">
        {{ isTileDebugVisible ? "隐藏" : "显示" }} 切片调试
      </button>
      <!-- 切换 Graticule 图层的按钮 -->
      <button @click="toggleGraticule">
        {{ isGraticuleVisible ? "隐藏" : "显示" }} 经纬网
      </button>
    </div>
  </div>
</template>

<script setup>
import { ref, onMounted } from "vue";
import Map from "ol/Map";
import View from "ol/View";
import TileLayer from "ol/layer/Tile";
import XYZ from "ol/source/XYZ";
import Graticule from "ol/layer/Graticule";
import TileDebug from "ol/source/TileDebug";
import Stroke from "ol/style/Stroke";
import "ol/ol.css";

// 地图容器的引用
const mapContainer = ref(null);
// OpenLayers 地图实例
let map = null;
// TileDebug 图层引用
let tileDebugLayer = null;
// Graticule 图层引用
const graticuleLayer = ref(null);

const isTileDebugVisible = ref(true);
const isGraticuleVisible = ref(true);

/**
 * 切换 TileDebug 图层的可见性
 */
const toggleTileDebug = () => {
  isTileDebugVisible.value = !isTileDebugVisible.value;
  if (tileDebugLayer) {
    tileDebugLayer.setVisible(isTileDebugVisible.value);
  }
};

/**
 * 切换 Graticule 图层的可见性
 */
const toggleGraticule = () => {
  isGraticuleVisible.value = !isGraticuleVisible.value;
  if (graticuleLayer.value) {
    graticuleLayer.value.setVisible(isGraticuleVisible.value);
  }
};

onMounted(async () => {
  // 创建高德地图底图层
  const gaodeLayer = new TileLayer({
    source: new XYZ({
      url: "https://webst01.is.autonavi.com/appmaptile?lang=zh_cn&size=1&scale=1&style=6&x={x}&y={y}&z={z}",
      wrapX: false, // 防止地图水平重复
    }),
  });

  // 创建 TileDebug 图层
  tileDebugLayer = new TileLayer({
    source: new TileDebug(),
    visible: isTileDebugVisible.value,
  });

  // 创建 Graticule (经纬网) 图层
  graticuleLayer.value = new Graticule({
    // 网格线的样式
    strokeStyle: new Stroke({
      color: "rgba(0,0,0,0.2)", // 黑色,半透明
      width: 2, // 线宽
    }),
    showLabels: true, // 显示经纬度标签
    wrapX: false, // 防止经纬网水平重复
    visible: isGraticuleVisible.value, // 初始可见性
  });

  // 初始化 OpenLayers 地图
  map = new Map({
    target: mapContainer.value,
    layers: [
      gaodeLayer, // 添加高德底图
      graticuleLayer.value, // 添加经纬网图层
      tileDebugLayer, // 添加切片调试图层
    ],
    view: new View({
      center: [116.397428, 39.90923], // 北京的经纬度坐标
      zoom: 10,
      projection: "EPSG:4326",
    }),
  });
});
</script>

<style>
/* 地图容器的样式 */
.map-container {
  position: relative;
  width: 100vw;
  height: 100vh;
}

.map-element {
  width: 100%;
  height: 100%;
}

.controls {
  position: absolute;
  top: 10px;
  left: 10px;
  display: flex;
  gap: 10px;
  z-index: 1000;
}
</style>