Documentation - Apache ECharts
可自定义设置以下属性
- 甘特图数据(ganttData),类型:Gantt\[\],必传,默认 \[\]
- 容器宽度(width),类型:number | string,默认 '100%'
- 容器高度(height),类型:number | string,默认 '100%'
- 主题色(themeColor),类型: string,默认 '#1677ff'
- 状态映射表(statusMap),类型: Status\[\],默认 \[\]
type Gantt
- 名称(name),类型:string,必传
- 开始时间(start),类型:string | number | Date,必传
- 结束时间(end),类型:string | number | Date,必传
- 状态值(status),类型:number | string,用于着色
type Status
- 状态值(value),类型:number | string,必传
- 状态名(label),类型:string,必传
- 状态颜色(color),类型:string,必传
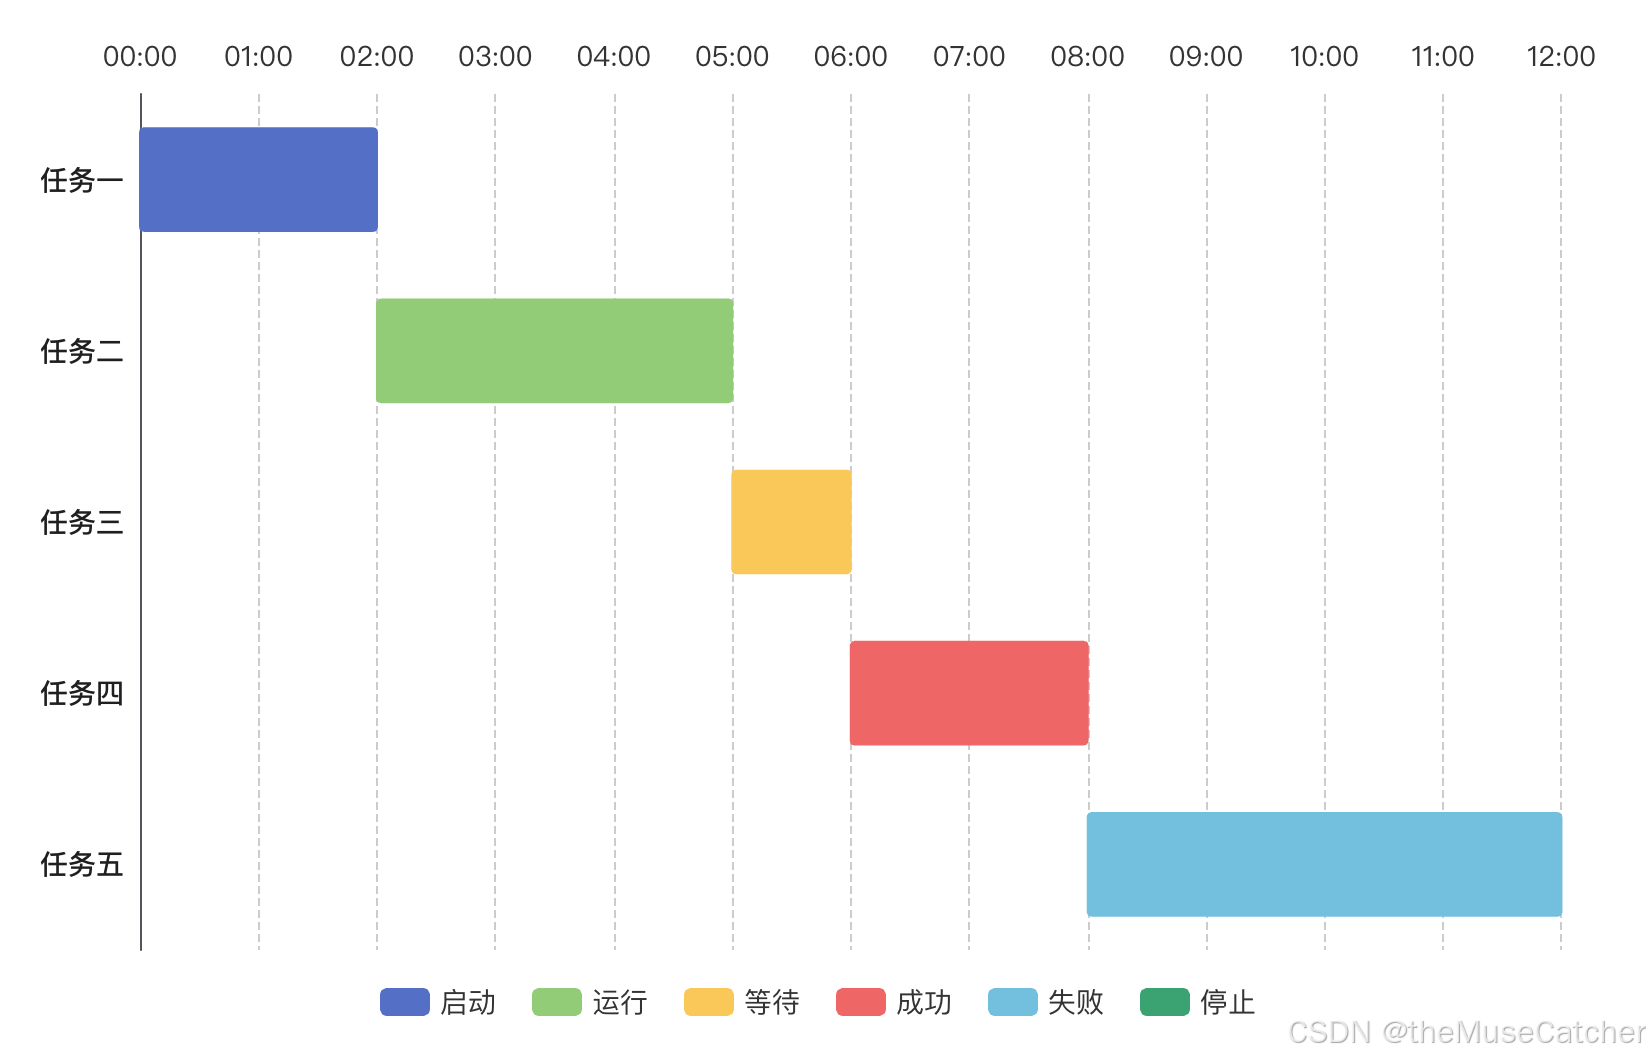
效果如下图:echarts@6.0.0
在线预览
安装插件
bash
pnpm add echarts创建甘特图组件GanttChart.vue
ts
<script setup lang="ts">
import { ref, useTemplateRef, onMounted, onBeforeUnmount, watch, computed } from 'vue'
import { useResizeObserver } from '../utils'
import * as echarts from 'echarts/core'
import { TooltipComponent, GridComponent, LegendComponent } from 'echarts/components'
import { CustomChart } from 'echarts/charts'
import { CanvasRenderer } from 'echarts/renderers'

echarts.use([TooltipComponent, GridComponent, LegendComponent, CustomChart, CanvasRenderer])

const chartRef = useTemplateRef('chartRef')
const myChart = ref<any>()
let option: any

interface Gantt {
  name: string // 名称
  start: string | number | Date // 开始时间
  end: string | number | Date // 结束时间
  status: number | string // 状态值,用于着色
}
interface Status {
  value: number | string // 状态值
  label: string // 状态名
  color: string // 状态颜色
}
interface Props {
  ganttData?: Gantt[] // 数据
  width?: string | number // 容器宽度
  height?: string | number // 容器高度
  themeColor?: string // 主题色
  statusMap?: Status[] // 状态映射表
}
const props = withDefaults(defineProps<Props>(), {
  ganttData: () => [],
  width: '100%',
  height: '100%',
  themeColor: '#1677FF',
  statusMap: () => []
})
const chartWidth = computed(() => {
  if (typeof props.width === 'number') {
    return `${props.width}px`
  }
  return props.width
})
const chartHeight = computed(() => {
  if (typeof props.height === 'number') {
    return `${props.height}px`
  }
  return props.height
})
watch(
  () => props.ganttData,
  () => {
    myChart.value && myChart.value.setOption(buildOption(), true)
  },
  { deep: true }
)
// 统一转换为时间戳格式
function toTimestamp(value: string | number | Date): number {
  if (typeof value === 'number') return value
  if (value instanceof Date) return value.getTime()
  // 替换空格为 'T' 以提升跨浏览器解析稳定性
  const normalized = value.replace(' ', 'T')
  const t = Date.parse(normalized)
  return isNaN(t) ? new Date(value).getTime() : t
}
// 处理数据:输出 y 轴分类与自定义系列的数据
function getSeriesData() {
  const yAxisData = props.ganttData.map((item) => item.name)
  const data = props.ganttData.map((item, index) => {
    return {
      value: [
        index, // 类别索引
        toTimestamp(item.start), // 开始时间戳
        toTimestamp(item.end), // 结束时间戳
        item.status
      ],
      name: item.name
    }
  })
  return { yAxisData, data }
}
// 根据状态值获取对应的颜色
function getStatusColor(value: string | number): string {
  const statusItem = props.statusMap.find((status) => String(status.value) === String(value))
  const color = statusItem ? statusItem.color : '#5470c6' // 默认颜色
  return color
}
function renderGanttBar(params: any, api: any) {
  const categoryIndex = api.value(0)
  const startCoord = api.coord([api.value(1), categoryIndex])
  const endCoord = api.coord([api.value(2), categoryIndex])
  const barHeight = Math.max(api.size([0, 1])[1] * 0.6, 2)

  const rectShape = {
    x: startCoord[0],
    y: startCoord[1] - barHeight / 2,
    width: Math.max(endCoord[0] - startCoord[0], 0),
    height: barHeight
  }

  const shape = echarts.graphic.clipRectByRect(rectShape, {
    x: params.coordSys.x,
    y: params.coordSys.y,
    width: params.coordSys.width,
    height: params.coordSys.height
  })
  if (shape) {
    // 为矩形添加圆角
    ;(shape as any).r = 2
  }

  // 获取状态值
  const statusValue = api.value(3)

  // 获取对应的颜色
  const color = getStatusColor(statusValue)

  return { // 返回自定义矩形元素
    type: 'rect',
    shape,
    style: {
      fill: color,
      stroke: color
    }
  }
}
// 构建图表配置项 option
function buildOption() {
  const { yAxisData, data } = getSeriesData()
  option = {
    grid: {
      top: 0,
      left: 0,
      right: 0,
      bottom: 42,
      containLabel: true
    },
    legend: {
      orient: 'horizontal',
      left: 'center',
      bottom: 0,
      itemGap: 18,
      textStyle: {
        fontWeight: 400,
        fontSize: 14,
        color: '#333',
        lineHeight: 22
      },
      data: props.statusMap.map((status: Status) => {
        return status.label
      })
    },
    tooltip: {
      trigger: 'item',
      formatter: (params: any) => {
        // console.log('params', params)
        const start = params.value[1]
        const end = params.value[2]
        const format = (timestamp: number) => {
          return echarts.time.format(timestamp, '{HH}:{mm}:{ss}', false)
        }
        const piecesMap = new Map(props.statusMap.map((status: Status) => [String(status.value), status.label]))
        const statusLabel = piecesMap.get(String(params.value[3])) || ''
        return `${params.name}<br/>${format(start)} - ${format(end)}${statusLabel ? `<br/>状态:${params.marker} ${statusLabel}` : ''}`
      }
    },
    xAxis: {
      type: 'time',
      position: 'top',
      splitLine: {
        show: true,
        lineStyle: {
          type: 'dashed',
          color: '#ccc'
        }
      },
      axisLabel: {
        color: '#333',
        fontWeight: 400,
        fontSize: 14,
        lineHeight: 22,
        align: 'center',
        showMinLabel: true,
        showMaxLabel: true,
        formatter: (value: number) => {
          // return echarts.time.format(value, '{yyyy}-{MM}-{dd} {HH}:{mm}:{ss}', false)
          return echarts.time.format(value, '{HH}:{mm}', false)
        }
      }
    },
    yAxis: {
      type: 'category',
      inverse: true,
      data: yAxisData,
      axisLabel: {
        color: 'rgba(0, 0, 0, 0.88)',
        fontWeight: 500,
        fontSize: 14,
        lineHeight: 22
      }
    },
    series: props.statusMap.map((status) => ({
      name: status.label,
      type: 'custom',
      renderItem: renderGanttBar, // 以 Function 形式提供图形渲染的逻辑
      encode: { x: [1, 2], y: 0 }, // 定义 data 的哪个维度被编码成什么
      itemStyle: { // 图形样式
        color: getStatusColor(status.value)
      },
      data: data.filter((item) => String(item.value[3]) === String(status.value))
    }))
  }
  return option
}
function initChart() {
  myChart.value = echarts.init(chartRef.value)
  myChart.value.setOption(buildOption())
}
function showLoading (config: any) {
  myChart.value && myChart.value.showLoading('default', { text: '', color: props.themeColor, ...config }) // 显示加载动画效果
}
function hideLoading () {
  myChart.value && myChart.value.hideLoading() // 隐藏动画加载效果
}
// 监听图表容器尺寸变化,重新初始化图表
useResizeObserver(chartRef, () => {
  requestAnimationFrame(() => {
    myChart.value && myChart.value.resize()
  })
})
onMounted(() => {
  initChart()
})
onBeforeUnmount(() => {
  myChart.value && myChart.value.dispose() // 销毁图表实例
})
defineExpose({
  showLoading,
  hideLoading
})
</script>
<template>
  <div
    class="chart-container"
    ref="chartRef"
    :style="`--chart-width: ${chartWidth}; --chart-height: ${chartHeight};`"
  ></div>
</template>
<style lang="less" scoped>
.chart-container {
  width: var(--chart-width);
  height: var(--chart-height);
}
</style>
在要使用的页面引入
ts
<script setup lang="ts">
import GanttChart from './GanttChart.vue'
import { useTemplateRef, ref, onMounted } from 'vue'
const ganttRef = useTemplateRef('ganttRef')
const ganttData = ref<any[]>([])
onMounted(() => {
  getGanttData()
})
function getGanttData () { // 模拟接口调用
  ganttRef.value.showLoading()
  setTimeout(() => {
    ganttData.value.push(
      {
        name: '任务一',
        start: '2025-08-12 00:00:00',
        end: '2025-08-12 04:00:00',
        status: '1'
      },
      {
        name: '任务二',
        start: '2025-08-12 04:00:00',
        end: '2025-08-12 05:00:00',
        status: '2'
      },
      {
        name: '任务三',
        start: '2025-08-12 05:00:00',
        end: '2025-08-12 06:00:00',
        status: '3'
      },
      {
        name: '任务四',
        start: '2025-08-12 06:00:00',
        end: '2025-08-12 08:00:00',
        status: '4'
      },
      {
        name: '任务五',
        start: '2025-08-12 08:00:00',
        end: '2025-08-12 13:00:00',
        status: '5'
      }
    )
    ganttRef.value.hideLoading()
  }, 1500)
}
const statusMap = [
  { value: '1', label: '启动', color: '#5470c6' },
  { value: '2', label: '运行', color: '#91cc75' },
  { value: '3', label: '等待', color: '#fac858' },
  { value: '4', label: '成功', color: '#ee6666' },
  { value: '5', label: '失败', color: '#73c0de' },
  { value: '6', label: '停止', color: '#3ba272' }
]
</script>
<template>
  <div>
    <h1>GaugeChart 参考文档</h1>
    <ul class="m-list">
      <li>
        <a class="u-file" href="https://echarts.apache.org/handbook/zh/get-started" target="_blank">使用手册</a>
      </li>
      <li>
        <a class="u-file" href="https://echarts.apache.org/handbook/zh/basics/import" target="_blank">在项目中引入 ECharts</a>
      </li>
      <li>
        <a class="u-file" href="https://echarts.apache.org/zh/builder.html" target="_blank">ECharts 在线定制</a>
      </li>
    </ul>
    <GanttChart
      ref="ganttRef"
      :gantt-data="ganttData"
      :status-map="statusMap"
      :height="500"
   />
  </div>
</template>