webgis-maps
1. 介绍
本模块是一个前端 WebGIS 通用地图框架模型库,目前初步支持 Leaflet 和 Mapbox 两款主流地图引擎的部分 API 功能。基于 TypeScript 对地图相关的业务逻辑进行抽象建模,封装了日常开发中高频使用的地图操作接口,有效减少了地图交互功能的重复编码,显著提升了开发效率。同时,通过统一的 API 设计降低了开发者对特定地图框架(如 XXX)的学习成本和技术门槛。
version:1.0.35-2025815更新:
- 对mapbox构建style的builder类进行重写,可基于链式调用构建最终的style,操作一气呵成,重写后使用如下:
typescript
import React, { useEffect, useState } from "react";
import "./index.scss";
import {
MapBoxLayer,
MapBoxLayerLayout,
MapBoxLayerPaint,
MapBoxMap,
MapBoxSource,
MapBoxStyle,
MapBoxStyleBuilder,
} from "../../../src";
import MapBoxLayerTypeConsts from "../../../src/model/mapbox/consts/MapBoxLayerTypeConsts";
import MapBoxSourceConsts from "../../../src/model/mapbox/consts/MapBoxSourceConsts";
const MapView = () => {
const [map, setMap] = useState(null);
useEffect(() => {
initMap();
}, []);
const initMap = () => {
initMapBoxMap();
};
const initMapBoxMap = () => {
let vectorServiceId = "sampleDataVec";
let vectorUrl =
"http://10.x.x.x:8866/xx-xx-xx/sample/data/vectortile?crs=EPSG:3857&l={z}&x={x}&y={y}&cache=false&useTolerance=false";
let rasterServiceId = "arcgis";
let rasterUrl =
"https://server.arcgisonline.com/arcgis/rest/services/World_Imagery/MapServer/tile/{z}/{y}/{x}";
let style = new MapBoxStyleBuilder()
.config("mapbox-style", {
sprite: "http://10.x.x.x:8866/xx-xx-xx/xxx/data/sprite",
})
.addSource(vectorServiceId, vectorUrl, {
type: MapBoxSourceConsts.SOURCE_TYPE_VECTOR,
minzoom: 3,
maxzoom: 18,
scheme: "xyz",
})
.addSource(rasterServiceId, rasterUrl, {
type: MapBoxSourceConsts.SOURCE_TYPE_RASTER,
minzoom: 3,
maxzoom: 18,
scheme: "xyz",
})
.addLayer(rasterServiceId, MapBoxLayerTypeConsts.RASTER, rasterServiceId)
.addLayer(
vectorServiceId,
MapBoxLayerTypeConsts.SYMBOL,
vectorServiceId,
{
sourceLayer: vectorServiceId,
layout: {
iconAllowOverlap: true,
iconImage: [
"match",
["get", "dataType"],
["光学遥感影像"],
"ors",
["无人机"],
"unv",
["SAR"],
"sar",
["图片"],
"image",
["视频"],
"video",
["音频"],
"sound",
"ors",
],
iconSize: 1,
},
}
);
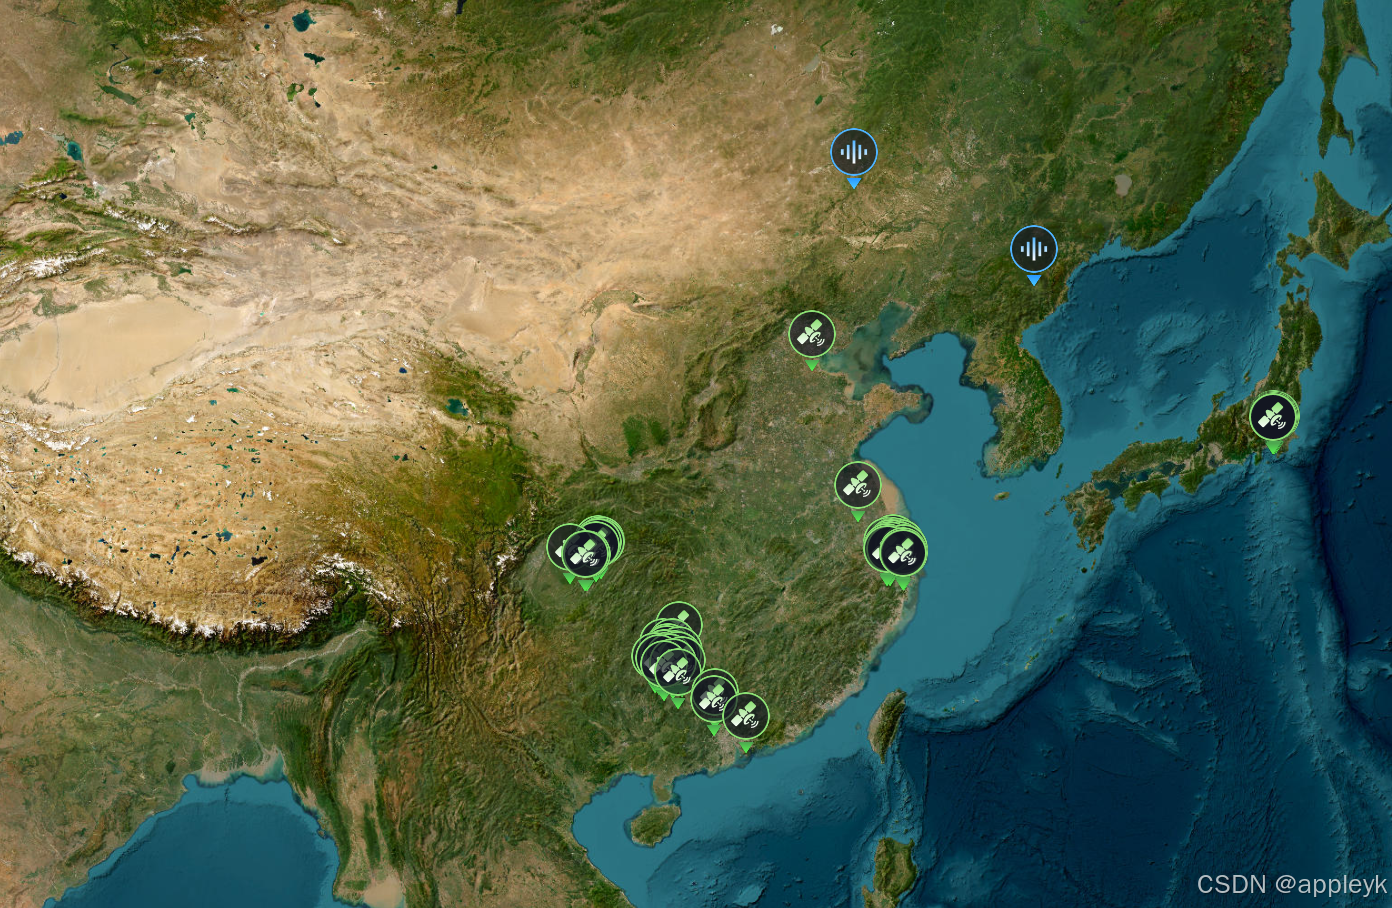
/** 初始化mapbox地图对象 */
let mapBoxMap = new MapBoxMap("map", style.build());
mapBoxMap.addNavigationControl(MapBoxMap.CONTROL_POSITION_TOP_LEFT);
mapBoxMap.addAttribution(MapBoxMap.CONTROL_POSITION_BOTTOM_RIGHT);
setMap(mapBoxMap.getMap());
console.log("style.buildOrigin : "+style.buildOrigin());
};
return <div id="map" className="container"></div>;
};
export default MapView;最终效果如下:
version:1.0.34-2025813更新:
- LeafletVectorLayer对应的Canvas和Svg瓦片渲染,对于自定义Icon超出瓦片部分进行特殊处理--》丢弃
version:1.0.30-20250314更新:
- LeafletGeoJsonLayer构造器新增bMask参数,对于单面的geojsonData进行遮罩处理,默认false,代码如下:
javascript
/**
   * LeafletGeojsonLayer构造器
   * @param id 图层字符串ID
   * @param data 图层geojson字符串数据
   * @param style 图层样式函数
   * @param pane 图层面板容器名称
   * @param bMask 是否为当前数据源构建遮罩效果
   */
  constructor(
    id: string,
    data: any,
    style: StyleFunction,
    pane: string = "",
    bMask = false
  ) {
    super(id, undefined, pane);
    if (bMask) {
      let outerRing = [
        [-180.0, 85.5],
        [180.0, 85.5],
        [180.0, -85.5],
        [-180.0, -85.5],
      ];
      if (data.geometry) {
        if (data.geometry.type === "MultiPolygon") {
          let features = data.geometry.coordinates[0];
          features.unshift(outerRing);
        } else if (data.geometry.type === "Polygon") {
          let features = data.geometry.coordinates;
          features.unshift(outerRing);
        }
      } else {
        if (data.type === "MultiPolygon") {
          let features = data.coordinates[0];
          features.unshift(outerRing);
        } else if (data.type === "Polygon") {
          let features = data.coordinates;
          features.unshift(outerRing);
        }
      }
      this.data = data;
    } else {
      this.data = data;
    }
    this.style = style;
  }
测试数据:
json
{
  "type": "Polygon",
  "coordinates": [
    [
      [117.28583099, 31.59835657],
      [117.3010303, 31.59604101],
      [117.30770317, 31.58151486],
      [117.28286527, 31.57909361],
      [117.28583099, 31.59835657]
    ]
  ]
}
代码案例:
javascript
// 引入数据
import geom from "../geom.json";
// 图层样式
const dataStyles = (feature) => {
  return {
    fillColor: "#000",
    stroke: true,
    fillOpacity: 0.5,
    color: "blue",
    weight: 2,
  };
};
// 构建地图对象
let leftMap = new LeafletMap("map",{ zoomControl: false },14,[31.59835657, 117.28583099]);
// 构建geojsonLayer
let geosjonLayer = new LeafletGeojsonLayer("geojson", geom, dataStyles,"",true);
leftMap.addLayer(geosjonLayer);
展示效果如下:

version:1.0.28-20250314更新:
- AbstractMap地图抽象类新增getLayer方法,用于获取指定layerId的图层对象。
2. 使用
2.1 依赖项
该模块依赖于leaflet和mapbox-gl库,推荐版本如下:
"@types/leaflet": "^1.9.12",
"@types/mapbox-gl": "^2.7.8",
"leaflet": "^1.7.1",
"mapbox-gl": "^2.12.0",
2.2 安装
由于该模块还在不断完善中,npm仓库提交的版本会很频繁,如有检测到最新版本,建议先移除旧版本,然后再安装新版本。
yarn remove webgis-maps && yarn add webgis-maps2.3 axios封装
axios简单封装如下(以下只是参考,主要为了配合该模块做的封装,具体情况基于实际开发环境来):
request.js
javascript
import axios from "axios";

const apiService = axios.create({
  timeout: 60 * 1000,
});

const axiosFn = {
  // get请求
  commonOnGet: (url, params = {}, headers = {}) => {
    return apiService.get(url, {
      params: params,
      headers: headers,
    });
  },
};

export {apiService,axiosFn};
2.3 leaflet使用案例
index.jsx (初始化路由组件)
javascript
import React from "react";
import MapView from "../pages/map-view/MapView";
import {Switch } from "antd";
import { useState } from "react";
import { axiosFn } from "../request";

const switchStyle = {
  position: "absolute",
  top: "50px",
  right: "280px",
  zIndex: 9999999999,
  borderRadius: "3px",
};

const spanStyle = {
    position: "absolute",
    top: "50px",
    right: "200px",
    zIndex: 9999999999,
    borderRadius: "3px",
    fontSize:"15px",
    color:"white"
  };

const MapIndex = (props) => {
  const [showGrid, setShowGrid] = useState(false);
  const onChange = () => {
    setShowGrid(!showGrid);
  };
  return (
    <div className="App">
      <MapView showGrid={showGrid} />
      <Switch
        style={switchStyle}
        checkedChildren="开启"
        unCheckedChildren="关闭"
        defaultChecked
        onChange={onChange}
      >
      </Switch>
      <span style={spanStyle}>经纬线网格</span>
    </div>
  );
};

export default MapIndex;
mapview.css(MapView组件的样式)
css
.container {
  width: 100%;
  height: 100%;
  position: absolute;
  overflow: hidden;
  left: 0;
  top: 0;
}
MapView.jsx(地图视图组件)
javascript
import React, { Component } from "react";
import {
LeafletMap, // LeafLet地图模型类
LeafletDrawLonlatLine, // LeafLet经纬网格插件类
LeafletTileLayer,// LeafLet栅格瓦片图层
OgcXmlParser,// ogc服务能力解析类
LeafletWmtsLayer,// LeafLet·wmts图层
} from "webgis-maps";
import { axiosFn } from "../../request";
import "./mapview.css";
export default class MapView extends Component {
constructor(props) {
super(props);
}
componentDidMount() {
this.initMap();
}
componentWillUnmount() {
/**释放资源,移除经纬线相关图层和地图事件*/
this.lonLatGridLines.removeDrawEvent();
}
initMap() {
/** 构建LeafletMap对象*/
const leafletMap = new LeafletMap("map", { zoomControl: false },[30.3634,107.33643]);
/** 获取LeafletMap对象中的map对象(leaflet api中的map实例)*/
let map = leafletMap.getMap();
/** 添加自定义的缩放控件,默认屏幕位置:topleft */
leafletMap.addZoomSlider();
/** 添加自定义的缩放层级显示span功能,默认屏幕位置:topleft */
leafletMap.addZoomLable();
/** 添加鼠标滑过动态显示经纬度span功能,默认屏幕位置:bottomright */
leafletMap.addMousePosition();
/** arcgis xyz服务类型的地址 */
let arcgisXYZ = "https://server.arcgisonline.com/arcgis/rest/services/World_Imagery/MapServer/tile/{z}/{y}/{x}";
/** 构建leaflet栅格瓦片图层对象 */
let arcgisLayer = new LeafletTileLayer("arcgis", arcgisXYZ);
/** 将栅格瓦片图层添加到leafletMap中 */
leafletMap.addLayer(arcgisLayer);
let suzhouWMTS = "http://10.16.248.40:8080/tile/service/wmts/1572457472291904/0";
/** 解析wmts服务(比如:范围、图层、样式、分辨率、瓦片变化矩阵等) */
axiosFn
.commonOnGet(OgcXmlParser.getWmtsCapabilitiesUrl(suzhouWMTS))
.then((res) => {
/** 获取wmts服务能力xml描述 */
let xmlData = res.data;
/** 获取wmts服务图层的配置项 */
let options = OgcXmlParser.getWmtsOptions(xmlData);
/** 获取wmts服务的范围 */
let fitBounds = OgcXmlParser.getFitBounds(xmlData)
/** 地图定位到wmts服务所在的范围 */
map.fitBounds(fitBounds)
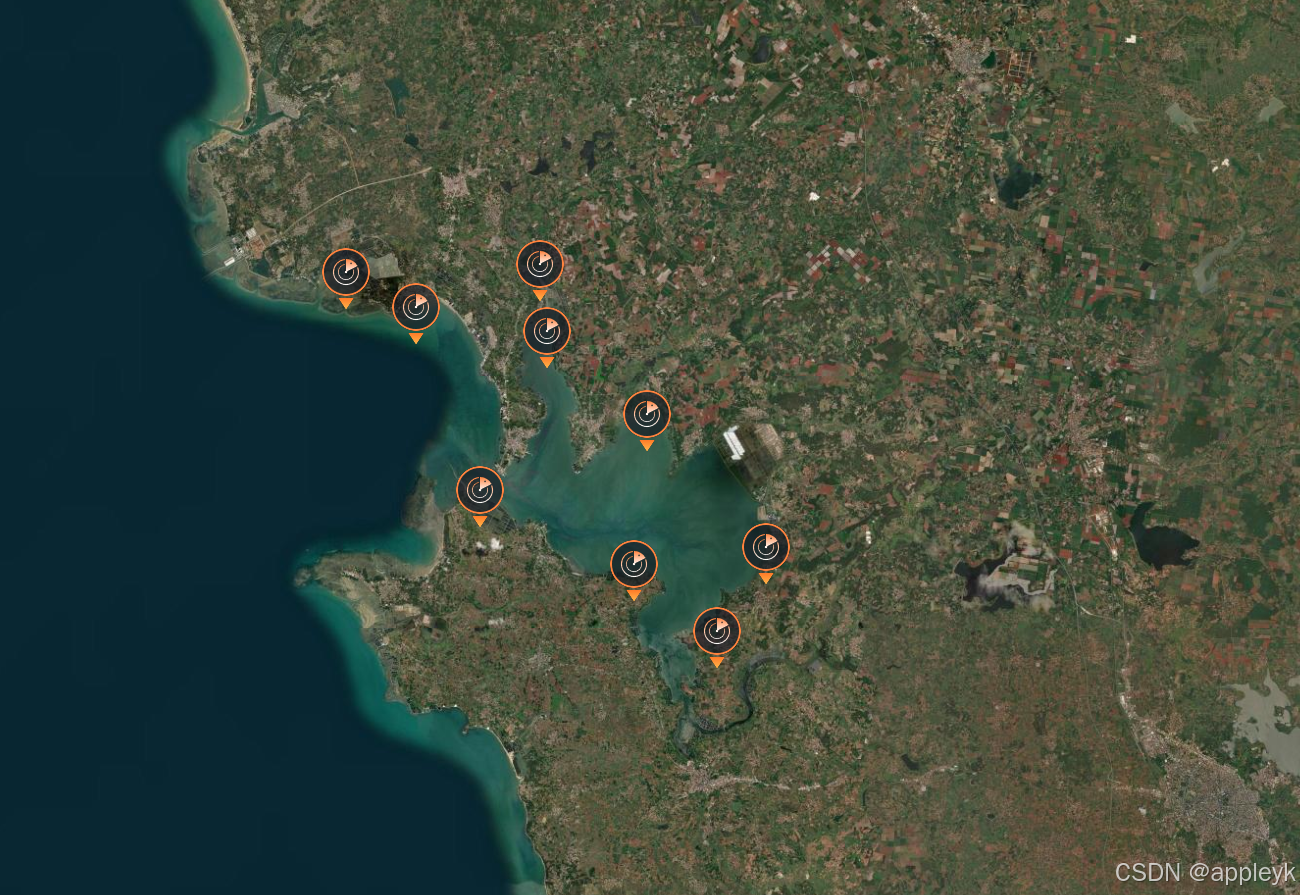
/** 构建wmts图层 */
let suzhouWMTSLayer = new LeafletWmtsLayer("suzhou", suzhouWMTS);
/** 设置wmts图层的配置项 */
suzhouWMTSLayer.setWmtsOptions(options);
/** 将wmts图层添加到leafletMap中 */
leafletMap.addLayer(suzhouWMTSLayer);
});
/** leaflet·wms服务图层与wmts图层类似!!! */
/**以下仅是额外扩展的leaflet插件功能*/
this.lonLatGridLines = new LeafletDrawLonlatLine(map);
/**经纬线设置为红色*/
this.lonLatGridLines.setLineColor("red");
/**经纬线度数文本颜色调整为黄色*/
this.lonLatGridLines.setTextColor("yellow");
/**经纬线度数文本四个方位(东西南北)均显示*/
this.lonLatGridLines.setTextPosition("all");
}
/**展示经纬格网图层*/
doShowGrid(showGrid) {
if (!this.lonLatGridLines) {
return;
}
if (showGrid) {
/** 添加绘制地图事件(即拖动地图时,清除上一次的图层的同时绘制新的图层)*/
this.lonLatGridLines.addDrawEvent();
/** 初始化话的时候,触发一次绘制*/
this.lonLatGridLines.drawLonlatTileGrid();
} else {
this.lonLatGridLines.removeDrawEvent();
}
}
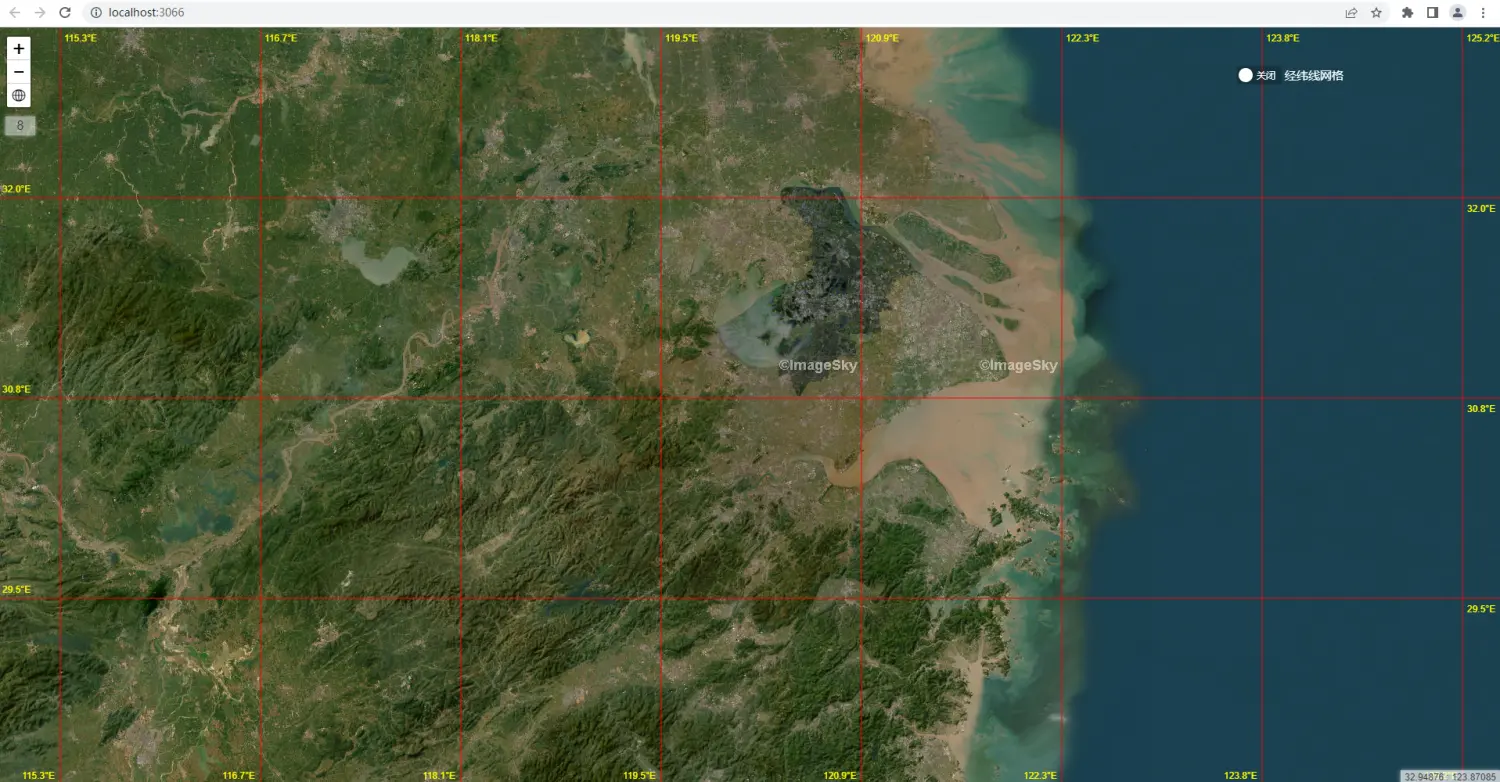
render() {
let { showGrid } = this.props;
this.doShowGrid(showGrid);
return <div id="map" className="container"></div>;
}
}3. 最终效果图