bash
npm install --save @antv/x6
html
<template>
  <div class="app-content">
    <div class="menu-list">
      <div
        v-for="item in moduleList"
        :key="item.id"
        draggable="true"
        @dragend="handleDragEnd($event, item)"
      >
        <img :src="item.image" alt="" />
        <p>{{ item.name }}</p>
      </div>
    </div>
    <!-- 右侧画布区域 -->
    <div class="canvas-container" ref="canvasContainer">
      <div id="graph-container" ref="graphContainer"></div>
    </div>
  </div>
</template>
js
import { onMounted, ref, h } from "vue";
import { Graph, Shape } from "@antv/x6";
import { Transform } from "@antv/x6-plugin-transform";
import { Selection } from "@antv/x6-plugin-selection";
import { Snapline } from "@antv/x6-plugin-snapline";
import { History } from "@antv/x6-plugin-history";
import { Keyboard } from "@antv/x6-plugin-keyboard";
import { Clipboard } from "@antv/x6-plugin-clipboard";
let graph = ref();
const graphContainer = ref<HTMLElement>();
const canvasContainer = ref<HTMLElement>();
const moduleList = ref([
{
id: 1,
name: "节点1",
image:
"https://ts1.tc.mm.bing.net/th/id/OIP-C.mH9YLFEL5YdVxJM82mjVJQHaEo?w=285&h=211&c=8&rs=1&qlt=90&o=6&dpr=2&pid=3.1&rm=2",
},
{
id: 8,
name: "节点2",
image:
"https://ts1.tc.mm.bing.net/th/id/OIP-C.Mq9zt66lU2fko_h2OWHIlAHaE8?w=255&h=211&c=8&rs=1&qlt=90&o=6&dpr=2&pid=3.1&rm=2",
},
{
id: 2,
name: "节点3",
image:
"https://ts1.tc.mm.bing.net/th/id/OIP-C.g9UbVfyVZX-SfD09JcYr5QHaEK?w=283&h=211&c=8&rs=1&qlt=90&o=6&dpr=2&pid=3.1&rm=2",
},
{
id: 3,
name: "节点4",
image:
"https://ts1.tc.mm.bing.net/th/id/OIP-C.IJZgTNx1vp9EML_1wV5p2gHaEo?w=255&h=211&c=8&rs=1&qlt=90&o=6&dpr=2&pid=3.1&rm=2",
},
]);
const ports = {
groups: {
top: {
position: "top" /* 顶部端口 */,
attrs: {
circle: {
r: 4,
magnet: true,
stroke: "#5F95FF",
strokeWidth: 1,
fill: "#fff",
},
},
},
bottom: {
position: "bottom" /* 底部端口 */,
attrs: {
circle: {
r: 4,
magnet: true,
stroke: "#5F95FF",
strokeWidth: 1,
fill: "#fff",
},
},
},
left: {
position: "left" /* 左侧端口 */,
attrs: {
circle: {
r: 4,
magnet: true,
stroke: "#5F95FF",
strokeWidth: 1,
fill: "#fff",
},
},
},
right: {
position: "right" /* 右侧端口 */,
attrs: {
circle: {
r: 4,
magnet: true,
stroke: "#5F95FF",
strokeWidth: 1,
fill: "#fff",
},
},
},
},
items: [
// 端口实例(启用四个方向的端口)
{ group: "top", id: "top" },
{ group: "bottom", id: "bottom" },
{ group: "left", id: "left" },
{ group: "right", id: "right" },
],
};
onMounted(() => {
initGraph();
});
// 初始化画布
const initGraph = () => {
if (!graphContainer.value) return;
graph.value = new Graph({
container: graphContainer.value,
width: graphContainer.value.offsetWidth, // 画布宽度(自适应容器)
height: graphContainer.value.offsetHeight, // 画布高度(自适应容器)
background: false,
snapline: true, // 启用对齐线(节点自动吸附到网格)
// 平移配置
panning: {
enabled: false,
},
// 鼠标滚轮缩放配置
mousewheel: {
enabled: true,
zoomAtMousePosition: true,
modifiers: "ctrl",
minScale: 0.5,
maxScale: 3,
},
// 网格配置
grid: {
type: "dot", // 点状网格
size: 20, // 网格大小
visible: true,
args: {
color: "#a0a0a0",
thickness: 2,
},
},
autoResize: true,
});
// 使用插件
graph.value
.use(new Selection({ rubberband: true, showNodeSelectionBox: true }))
.use(new Snapline())
.use(new History())
.use(new Keyboard({ enabled: true }))
.use(new Clipboard({ enabled: true }));
};
// 添加节点
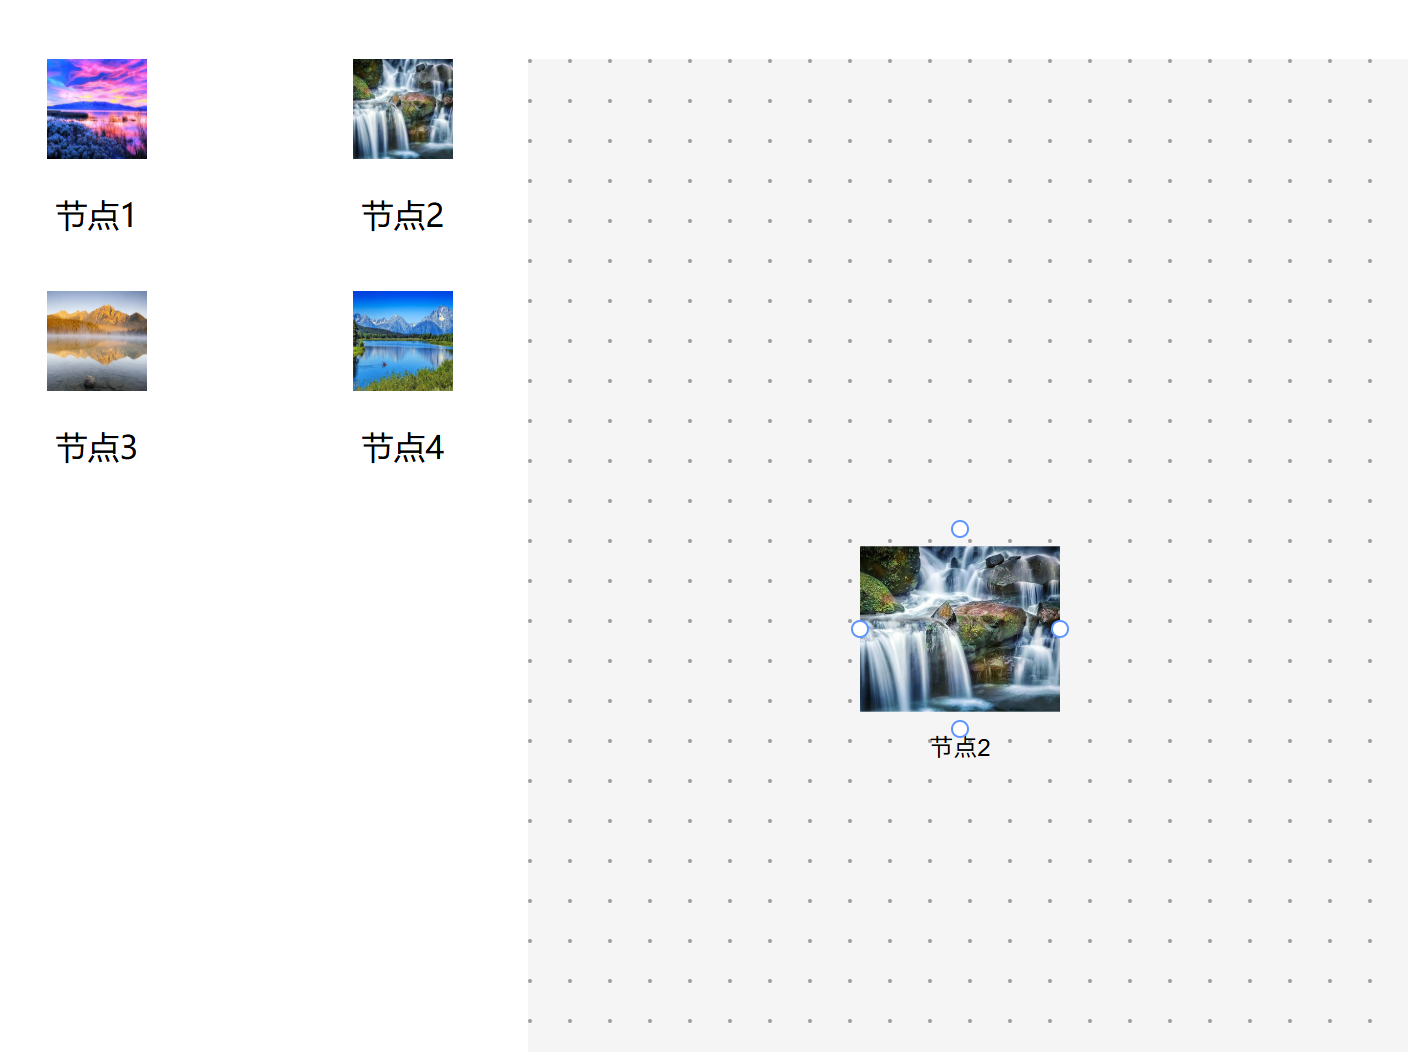
const addHandleNode = (x, y, item) => {
// 创建节点并添加到画布(合并基础样式和类型特定样式)
const IdValue = new Date().getTime();
graph.value.addNode({
shape: "image", // 指定使用何种图形,默认值为 'rect'
id: IdValue, // 节点唯一ID
x: x - 100,
y: y - 50,
width: 100,
height: 100,
imageUrl: item.image,
attrs: {
body: {
stroke: "#ffa940",
fill: "#ffd591",
},
label: {
textWrap: {
width: 90,
text: item.name,
},
fill: "black",
fontSize: 12,
refX: 0.5,
refY: "100%",
refY2: 4,
textAnchor: "middle",
textVerticalAnchor: "top",
},
},
// // 统一添加连接桩配置
ports: { ...ports },
});
};
// 拖动后松开鼠标触发事件,添加节点到画布
const handleDragEnd = (e, item) => {
console.log(e, item); // 可以获取到最后拖动后松开鼠标时的坐标和拖动的节点相关信息
if (!graph.value || !canvasContainer.value) return;
// 计算在画布中的位置
const rect = canvasContainer.value.getBoundingClientRect();
// // 计算节点在画布中的坐标(基于容器左上角)
const x = e.clientX - rect.left; // X坐标 = 鼠标X坐标 - 容器左边界距离视口左边界的距离
const y = e.clientY - rect.top;
// 添加节点到画布
addHandleNode(x, y, item);
};加入节点相关交互事件(鼠标进入/离开、点击等)
nodeAddEvent ()直接写在initGraph里,new Graph后就行
js
// 添加统一显示控制
const showPorts = (show: boolean) => {
  const ports = graph.value?.container?.querySelectorAll(".x6-port-body");
  ports?.forEach((port) => {
    port.style.visibility = show ? "visible" : "hidden";
  });
};
/**
 * 初始化节点相关交互事件(鼠标进入/离开、点击等)
 */
const nodeAddEvent = () => {
  const container = graphContainer.value;
  // // 鼠标进入节点时显示端口
  // graph.value.on("node:mouseenter", ({ node }) => {
  //   showPorts(true); // 显示连接桩
  // });

  // // 鼠标离开节点时隐藏端口
  // graph.value.on("node:mouseleave", ({ node }) => {
  //   showPorts(false);
  // });

  // delete
  graph.value.bindKey(["backspace", "delete"], () => {
    const cells = graph.value.getSelectedCells();
    console.log(cells, "cellscells");

    if (cells.length) {
      graph.value.removeCells(cells);
    }
  });

  // 复制
  graph.value.bindKey("ctrl+c", () => {
    const cells = graph.value.getSelectedCells();
    if (cells.length) {
      graph.value.copy(cells);
    }
    return false;
  });

  // 粘贴
  graph.value.bindKey("ctrl+v", () => {
    if (!graph.value.isClipboardEmpty()) {
      const cells = graph.value.paste({ offset: 32 });
      graph.value.cleanSelection();
      graph.value.select(cells);
    }
    return false;
  });

  // 撤销
  graph.value.bindKey(["ctrl+z"], () => {
    if (graph.value.canUndo()) {
      graph.value.undo();
    }
    return false;
  });

  // 撤销刚才的撤销
  graph.value.bindKey(["ctrl+shift+z"], () => {
    if (graph.value.canRedo()) {
      graph.value.redo();
    }
    return false;
  });

  // 边
  graph.value.on("edge:added", ({ edge }) => {
    edge.attr({
      line: {
        stroke: "#1890ff",
        strokeWidth: 1.5,
        sourceMarker: "circle", // 实心箭头
        targetMarker: {
          name: "circle",
          size: 60,
        },
      },
    });
  });
};
保存画布
js
//保存画布,并提交
const save = () => {
  console.log(graph.value.toJSON(), "graph");
  console.log(graph.value.getNodes(), "node");
};
根据保存的节点数据,创建节点,边
js
const getData = () => {
  const data = datalist;

  const cells = [];
  data.forEach((item: any) => {
    if (item.shape === "edge") {
      cells.push(graph.value.createEdge(item)); // 创建边。
    } else {
      cells.push(graph.value.createNode(item)); // 创建节点。
    }
  });
  // 清空画布并添加用指定的节点/边。
  graph.value.resetCells(cells);
};
参考: