一、介绍
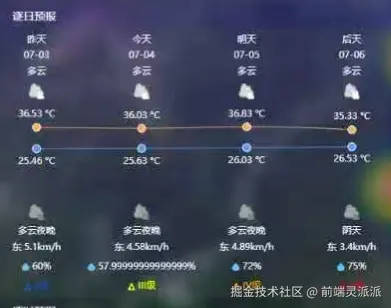
echart实现类似于手机的天气预报。分析天气预报的结构,就是折线图+一些文字类和图标类。
二、实现
首先创建一个div,用于echart的容器
js
<template>
  <div id="temperature-chart"></div>
</template>
<style scoped>
#temperature-chart {
  width: 100%;
  height: 350px;
  background: rgba(80, 80, 80, 0.24);
  border-radius: 10px;
}
</style>
ECharts 中一个类目轴(category axis) 的配置对象,通常用作 X 轴或 Y 轴的配置。它被设计用来展示一系列离散的类目数据(在这里是夜间用电数据),并具有自定义的标签格式。
type: "category":指定这是一个类目轴,适用于离散的类目数据(如文本标签),而不是连续的数值数据。
formatter: function (value, index) { ... } : 一个非常重要的函数,用于自定义每个标签的显示内容。
value: 当前类目的值(来自data数组)。index: 当前类目的索引。
rich: rich : 指定一个外部的 rich 配置对象。这个 rich 对象(在代码片段外定义)包含了 value 和 b 等样式块的具体样式定义(如颜色、背景色、字体大小、对齐方式等)。没有这个 rich 对象的定义,上面的 formatter 就无法正确渲染。
js
import * as echarts from "echarts";
import {weatherIcon} from "../js/config"

//天气图标
const rich = {
  b: {
    color: "white",
    fontSize: 12,
    lineHeight: 30,
    height: 20,
  },
}

Object.keys(weatherIcon).forEach((key) => {
  rich[key] = {
    backgroundColor: {
      image: `/prevent/weather/${weatherIcon[key]}.png`,
    },
    height: 20,
    width: 20,
  }
})

//预警等级图标
let levelRich = {}
let level = ["II", "III", "IV", "V"];
level.forEach((item,index)=>{
   levelRich[index]={
        backgroundColor: {
          image: `/prevent/icon/${item}.png`,
        },
        height: 10,
        width: 10,
   }
})

//湿度图标
let rainRich = {
  b: {
    backgroundColor: {
      image: "/prevent/icon/wet.svg",
    },
    height: 10,
    width: 10,
  },
  a: {
    color: "white",
    fontSize: 12,
  },
};

let levelColor = ["#005EFF", "#F2FF00", "#FFAA00", "#FF0000"];

var option = {
  grid: {
    show: true,
    backgroundColor: "transparent",
    opacity: 0.3,
    borderWidth: "0",
    top: "120",
    bottom: "130",
  },
  tooltip: {
    trigger: "axis",
  },
  legend: {
    show: false,
  },
  xAxis: [
    // 日期
    {
      type: "category",
      boundaryGap: false, //控制坐标轴两端的留白策略。
      position: "top",
      offset: 90,
      zlevel: 100,
      axisLine: {
        show: false,
      },
      axisTick: {
        show: false,
      },
      axisLabel: { //配置坐标轴刻度标签
        interval: 0,
        formatter: ["{a|{value}}"].join("\n"),
        rich: {
          a: {
            color: "white",
            fontSize: 12,
          },
        },
      },
      nameTextStyle: {},//配置坐标轴名称的样式。
      data: ["昨天", "今天", "明天", "后天"],
    },
    // 日期
    {
      type: "category",
      boundaryGap: false,
      position: "top",
      offset: 70,
      zlevel: 100,
      axisLine: {
        show: false,
      },
      axisTick: {
        show: false,
      },
      axisLabel: {
        interval: 0,
        formatter: ["{a|{value}}"].join("\n"),
        rich: {
          a: {
            color: "white",
            fontSize: 12,
          },
        },
      },
      nameTextStyle: {
        fontWeight: "bold",
        fontSize: 12,
      },
      data: props.data.days,
    },
    // 天气图标
    {
      type: "category",
      boundaryGap: false,
      position: "top",
      offset: 20,
      zlevel: 100,
      axisLine: {
        show: false,
      },
      axisTick: {
        show: false,
      },
      axisLabel: {
        interval: 0,
        formatter: function (value, index) {
          return "{b|" + weatherIcon[value] + "}\n{" + value + "| }";
        },
        rich: rich,
      },
      nameTextStyle: {
        fontWeight: "bold",
        fontSize: 12,
      },
      data: props.data.dayCons,
    },
    // 天气图标
    {
      type: "category",
      boundaryGap: false,
      position: "bottom",
      offset: 0,
      zlevel: 100,
      axisLine: {
        show: false,
      },
      axisTick: {
        show: false,
      },
      axisLabel: {
        interval: 0,
        formatter: function (value, index) {
          return "{" + value + "| }\n{b|" + weatherIcon[value] + "}";
        },
        rich: rich,
      },
      nameTextStyle: {
        fontWeight: "bold",
        fontSize: 12,
      },
      data:  props.data.nightCons,
    },
    //风向
    {
      type: "category",
      boundaryGap: false,
      position: "bottom",
      offset: 50,
      zlevel: 100,
      axisLine: {
        show: false,
      },
      axisTick: {
        show: false,
      },
      axisLabel: {
        interval: 0,
        formatter: ["{a|{value}}"].join("\n"),
        rich: {
          a: {
            color: "white",
            fontSize: 12,
          },
        },
      },
      nameTextStyle: {},
      data:props.data.daywinds,
    },
    //降雨量
    {
      type: "category",
      boundaryGap: false,
      position: "bottom",
      offset: 75,
      zlevel: 100,
      axisLine: {
        show: false,
      },
      axisTick: {
        show: false,
      },
      axisLabel: {
        interval: 0,
        formatter: function (value, index) {
          return "{b| }\r{a|" + value + "}";
        },
        rich: rainRich,
      },
      nameTextStyle: {},
      data: props.data.dayhumiditys,
    },
    //分级
    {
      type: "category",
      boundaryGap: false,
      position: "bottom",
      offset: 100,
      zlevel: 100,
      axisLine: {
        show: false,
      },
      axisTick: {
        show: false,
      },
      axisLabel: {
        interval: 0,
        formatter: function (value, index) {
          return "{" + value + "| }\r" + level[value] + "级";
        },
        textStyle: {
          color: function (value, index) {
            return levelColor[value];
          },
          fontSize: 12,
          lineHeight:12,
        },
        rich: levelRich,
      },
      nameTextStyle: {},
      data: [0, 1, 2, 3],
    },
  ],
  yAxis: {
    type: "value",
    show: false,
    axisLabel: {
      formatter: "{value} °C",
      color: "white",
    },
  },
  series: [
    {
      name: "最高气温",
      type: "line",
      data: props.data.dayMaxTemps,
      symbol: "circle",
      symbolSize: 10,
      showSymbol: true,
      smooth: true,
      itemStyle: {
        color: "#FFAF4E",
        borderWidth: 1,
        borderColor: "#fff",
      },
      label: {
        show: true,
        position: "top",
        color: "white",
        formatter: "{c} °C",
      },
      lineStyle: {
        width: 1,
        color: "#FFAF4E",
      },
      areaStyle: {
        opacity: 1,
        color: "transparent",
      },
    },
    {
      name: "最低气温",
      type: "line",
      data: props.data.dayMinTemps,
      symbol: "circle",
      symbolSize: 10,
      showSymbol: true,
      smooth: true,
      itemStyle: {
        borderWidth: 1,
        borderColor: "#fff",
        color: "#4E9EFF",
      },
      label: {
        show: true,
        position: "bottom",
        color: "white",
        formatter: "{c} °C",
      },
      lineStyle: {
        width: 1,
        color: "#4E9EFF",
      },
      areaStyle: {
        opacity: 1,
        color: "transparent",
      },
    },
  ],
};
onMounted(() => {
  const chartDom = document.getElementById("temperature-chart");
  const myChart = echarts.init(chartDom);
  myChart.setOption(option);
});