项目结构:uniapp + vue2 + uni-ui + uCharts
1、chunk-vendors.js:2765Vue warn: Invalid prop: custom validator check failed for prop "navigationBarTextStyle".
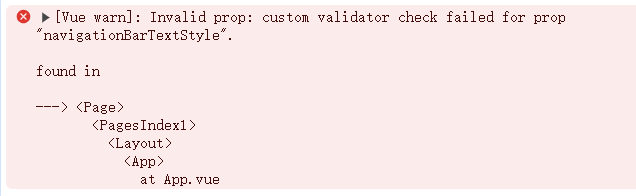
检索发现原因: 在 pages.json 文件中,navigationBarTextStyle 属性被设置为 "#ffffff",但根据 uni-app 的规范,该属性只接受 "black" 或 "white" 两个值。
2、<template>标签前有黄色波浪线,且提示:Failed to write the global types file. Make sure that:
"node_modules" directory exists.
"vue" is installed as a direct dependency.
Alternatively, you can manually set "vueCompilerOptions.globalTypesPath" in your "tsconfig.json".
If all dependencies are installed, try running the "vue.action.restartServer" command to restart Vue and TS servers.vue(404)
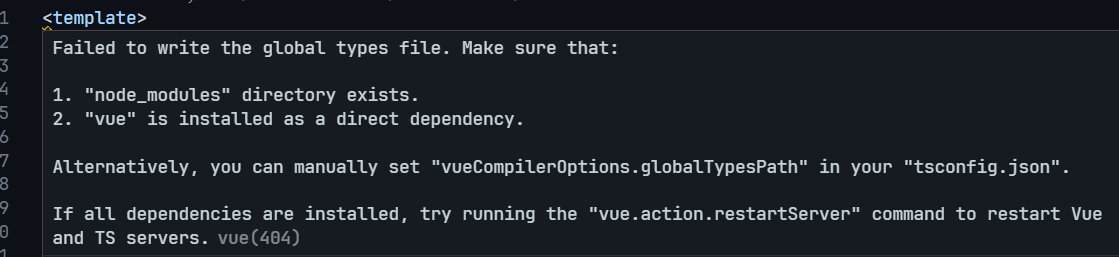
当前项目不支持ts
3、uCharts写法
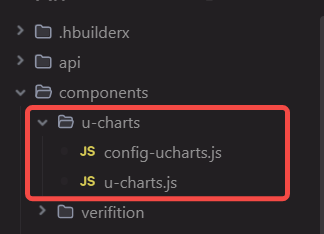
npm安装ucharts,之后将node_modules/@qiun/uni-charts/components/u-charts文件夹下的config-charts.js和u-charts.js文件放到代码路径components中。
实现方法
html
<qiun-data-charts
      ref="chartRef"
      type="mix"
      :chartData="data"
      :ontouch="true"
      :onzoom="true"
      inScrollView="true"
      canvas2d
      canvasId="canvasId"
      @getIndex="showMyTooltip"
      :opts="lineOptions"
      class="chart-content"
/>
type=mix是因为使用双坐标轴。
ontouch和onzoom是为了支持手指触摸方法的
lineOptions是图表的配置,配置字段和常规echarts有一些不同。
然后就开始了ucharts的踩坑记录啦!
4、ucharts实现图表后,鼠标放在折线图上不显示tooltip,点击图例lengend无反应。
解决方法:
(1)确认图表是否放在scroll-view滚动区域内,有则删除。
(2)确认添加ontouch和onzoom
(3)确认父级元素的样式是否有position定义,有则删除。
(4)确认父级元素是否使用uni-card,这个组件也不行,有的话用普通view实现。
(5)比较私人的一个因素,查看发现页面背景使用了backdrop-filter: blur(10px);删除就好了。
5、ucharts折线图的Y轴展示数字无法格式化。
注意ucharts的yAxis配置方法不一样,是写在data中的。
javascript
yAxis: {
          gridType: "dash", //横向网格样式  solid实线
          axisLine: false, //坐标轴线是否显示
          axisLineColor: "#767272", //坐标轴颜色
          gridColor: "rgba(86,94,107,0.1)", //网格颜色
          // dashLength: 3, //网格dash宽度
          showTitle: true,
          splitNumber: 5,
          data: [
            {
              //这里y轴分组   left是下标为0的第一组y数据在最左侧
              position: "left",
              axisLine: false, //坐标轴轴线是否显示
              axisLineColor: "#767272", //坐标轴轴线颜色
              fontColor: "#767272",
              fontSize: 10,
              titleFontSize: 10,
              disabled: false, //是否绘画y轴  true不 默认为false
              title: '金额',
              titleOffsetY: -6,
              titleOffsetX: 0,
              formatter: function (value) {
                 const formattedValue = value / 10000; // 转换为"万"
                 return `${formattedValue.toFixed(0)}万`; // 保留两位小数并添加"万"单位
              },
            },
            {
              //这里y轴分组   right是下标为1的第二组y数据在最右侧
              position: "right",
              axisLine: false, //坐标轴轴线是否显示
              axisLineColor: "#767272", //坐标轴轴线颜色
              fontColor: "#767272",
              fontSize: 10,
              titleFontSize: 10,
              disabled: false, //是否绘画y轴  true不 默认为false
              title: "指标",
              titleOffsetY: -6,
              titleOffsetX: 0,
              formatter: function (value) {
                 console.log("Formatting y-axis value:", value); // 打印原始值
                 const formattedValue = value / 10000; // 转换为"万"
                 return `${formattedValue.toFixed(2)}万`; // 保留两位小数并添加"万"单位
               },
            },
          ],
        },
上述formatter配置是不生效的。
需要将fomatter方法写在components/u-charts/config-ucharts.js文件中,然后在当前折线图配置中使用。
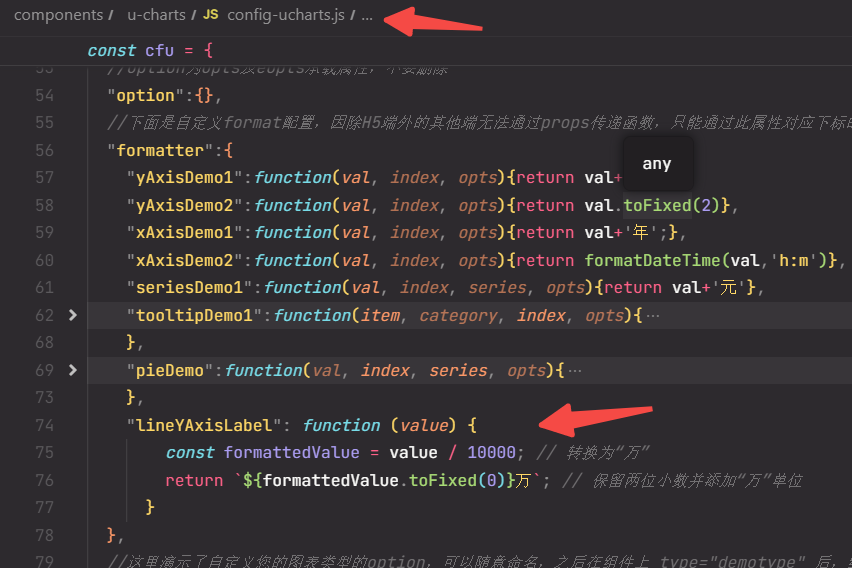
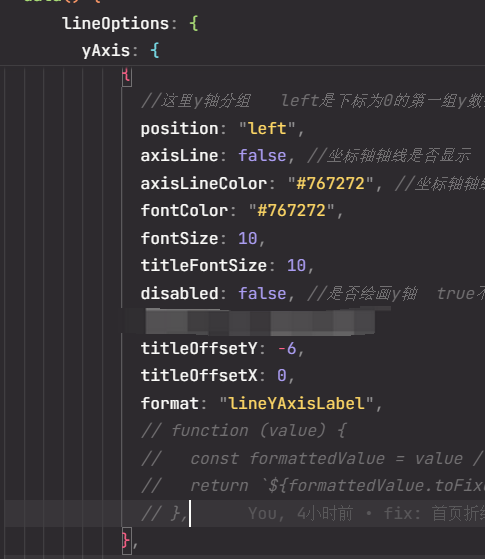
原因上面截图里写了,"因除H5端外的其他端无法通过props传递函数,只能通过此属性对应下标的方式来替换"。
6、ucharts救命恩属(性)啊!
disableScroll: true,

一直很烦,滚动图表的时候会连累整个页面滚动条,滑动起来体验特别差,现在好多了