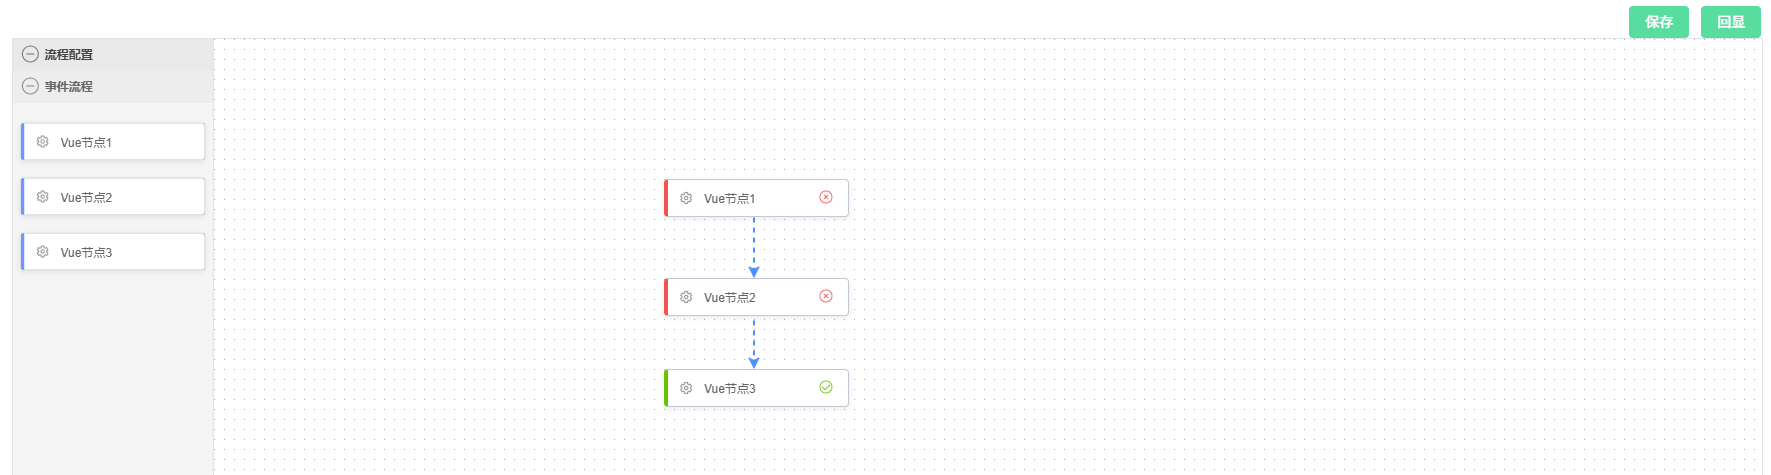
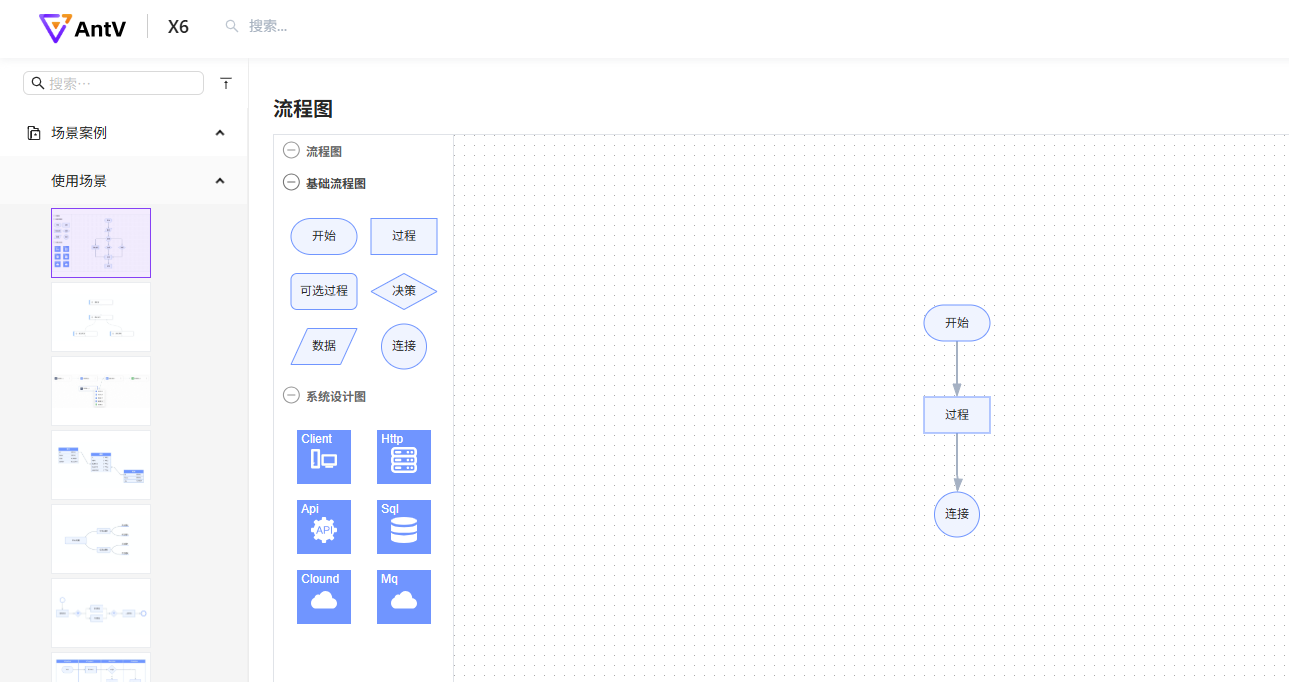
一、实现效果:
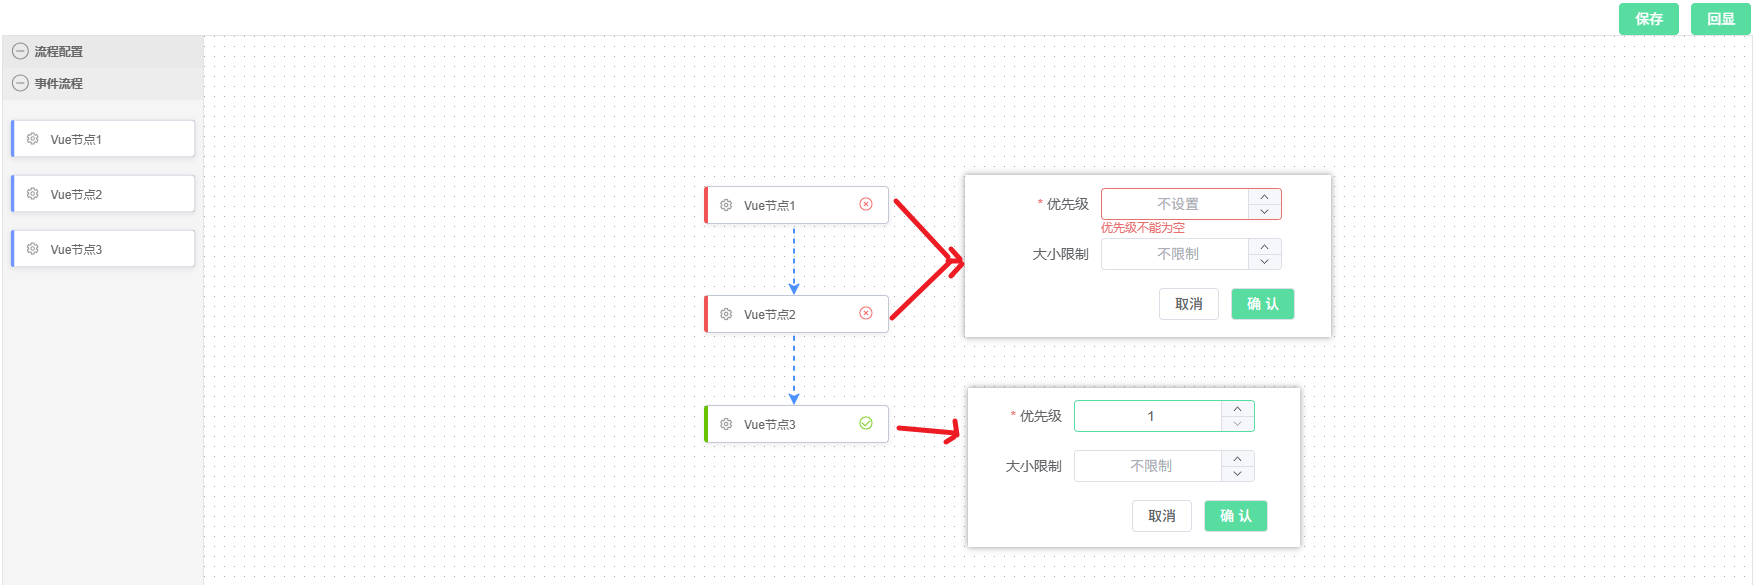
左侧节点拖拽到右侧画布,可进行节点连接,同时点击节点弹出弹框填写表单,表单校验失败,节点为红色;表单校验成功,节点为绿色。
插件: 【antv x6】https://x6.antv.antgroup.com/
技术栈: vue3 + ts
二、具体实现:
1、安装antv x6以及相关插件
1.1 安装antv x6
bash
# npm
$ npm install @antv/x6 --save

# yarn
$ yarn add @antv/x6 --save
1.2 安装其他依赖插件(见官网文档:插件描述)
npm方式
bash
npm install @antv/x6-plugin-stencil @antv/x6-plugin-transform @antv/x6-plugin-selection @antv/x6-plugin-snapline @antv/x6-plugin-keyboard @antv/x6-plugin-clipboard @antv/x6-plugin-history --saveyarn方式
bash
yarn add @antv/x6-plugin-stencil @antv/x6-plugin-transform @antv/x6-plugin-selection @antv/x6-plugin-snapline @antv/x6-plugin-keyboard @antv/x6-plugin-clipboard @antv/x6-plugin-history --save我这里只安装了我用到的
2、封装自定义vue节点组件
由于
antv x6已有的基础图形形状呢,不能满足我的需求,所以采用【自定义vue节点组件 】的方式,自定义节点样式。详见官方文档:自定义vue节点配置
在components/graph文件夹下新建process-node.vue,书写自定义节点代码
typescript
<template>
  <div :class="['node', nodeStatus]">
    <img :src="image.logo" alt="logo" />
    <span class="label">{{ nodeLabel }}</span>
    <span class="status">
      <img v-if="nodeStatus === 'success'" :src="image.success" alt="success" />
      <img v-if="nodeStatus === 'failed'" :src="image.failed" alt="failed" />
      <img v-if="nodeStatus === 'running'" :src="image.running" alt="running" />
    </span>
  </div>
</template>

<script setup lang="ts">
import { computed, inject, onMounted, onUnmounted, ref, watch } from 'vue'

const props = defineProps({
  node: {
    type: Object,
  }
})
const { node } = props
const nodeData = ref({})
const nodeLabel = ref('')
const nodeStatus = ref('default')

const updateData = () => {
  const data = node.getData()
  nodeData.value = data || {}
  nodeLabel.value = data?.label || ''
  nodeStatus.value = data?.status || 'default'
}

onMounted(() => {
  updateData()
  node.on('change:data', updateData)
})

onUnmounted(() => {
  node.off('change:data', updateData)
})
const image = {
  logo: 'https://gw.alipayobjects.com/mdn/rms_43231b/afts/img/A*evDjT5vjkX0AAAAAAAAAAAAAARQnAQ',
  success:
    'https://gw.alipayobjects.com/mdn/rms_43231b/afts/img/A*6l60T6h8TTQAAAAAAAAAAAAAARQnAQ',
  failed:
    'https://gw.alipayobjects.com/mdn/rms_43231b/afts/img/A*SEISQ6My-HoAAAAAAAAAAAAAARQnAQ',
  running:
    'https://gw.alipayobjects.com/mdn/rms_43231b/afts/img/A*t8fURKfgSOgAAAAAAAAAAAAAARQnAQ',
}

</script>

<style lang="scss">
.node {
  display: flex;
  align-items: center;
  width: 100%;
  height: 100%;
  background-color: #fff;
  border: 1px solid #c2c8d5;
  border-left: 4px solid #5F95FF;
  border-radius: 4px;
  box-shadow: 0 2px 5px 1px rgba(0, 0, 0, 0.06);
}
.node img {
  width: 20px;
  height: 20px;
  flex-shrink: 0;
  margin-left: 8px;
}
.node .label {
  display: inline-block;
  flex-shrink: 0;
  width: 104px;
  margin-left: 8px;
  color: #666;
  font-size: 12px;
}
.node .status {
  flex-shrink: 0;
}
.node.success {
  border-left: 4px solid #52c41a;
}
.node.failed {
  border-left: 4px solid #ff4d4f;
}
.node.running .status img {
  animation: spin 1s linear infinite;
}
.x6-node-selected .node {
  border-color: #1890ff;
  border-radius: 2px;
  box-shadow: 0 0 0 4px #d4e8fe;
}
.x6-node-selected .node.success {
  border-color: #52c41a;
  border-radius: 2px;
  box-shadow: 0 0 0 4px #ccecc0;
}
.x6-node-selected .node.failed {
  border-color: #ff4d4f;
  border-radius: 2px;
  box-shadow: 0 0 0 4px #fedcdc;
}
.x6-edge:hover path:nth-child(2){
  stroke: #1890ff;
  stroke-width: 1px;
}

.x6-edge-selected path:nth-child(2){
  stroke: #1890ff;
  stroke-width: 1.5px !important;
}

@keyframes running-line {
  to {
    stroke-dashoffset: -1000;
  }
}
@keyframes spin {
  from {
      transform: rotate(0deg);
  }
  to {
      transform: rotate(360deg);
  }
}
</style>
3、使用x6插件,绘制流程图
安装好第一步所有antv插件之后,就可进行正常引入和配置了
在components/graph文件夹下新建process-flow.vue,进行流程图、节点、连线的配置,最终绘制流程图
2.1 dom部分:
html
<template>
<div class="process-flow">
    <div class="top-btn">
        <el-button type="primary" @click="sumbit">保存</el-button>
        <el-button type="primary" @click="showProperty">回显</el-button>
    </div>
    <div id="container">
        <!-- 节点库 -->
        <div id="stencil"></div>
        <!-- 画布 -->
        <div id="graph-container"></div>
     </div>
     <!--  自定义节点需配置 -->
     <TeleportContainer />
     <!-- 弹窗 -->
     <el-dialog title="节点属性" v-model="formVisible" width="408px" :draggable="true">
     <!-- 表单组件 -->
            <TableEdit
                :key="selectedNodeId"
                :form-data="rowData"
                :initData="rowData"
                :options="options"
                :update="updateFormData"
                :close-dialog="closeDialog"
                :is-form-show="true"
                >
            </TableEdit>
     </el-dialog>
</div>
</template>
2.2 方法实现部分:
typescript
<script setup lang="ts">
import { Graph, Shape } from '@antv/x6'
import { Stencil } from '@antv/x6-plugin-stencil/lib' // 如果你加上/lib会报错,那你就去掉试试
import { Transform } from '@antv/x6-plugin-transform/lib'
import { Selection } from '@antv/x6-plugin-selection/lib'
import { Snapline } from '@antv/x6-plugin-snapline/lib'
import { Keyboard } from '@antv/x6-plugin-keyboard/lib'
import { Clipboard } from '@antv/x6-plugin-clipboard/lib'
import { History } from '@antv/x6-plugin-history/lib'
import { register, getTeleport } from '@antv/x6-vue-shape'
import ProcessNode from './process-node.vue'
import { computed, nextTick, onMounted, provide, reactive, ref } from 'vue'
import { ElMessage } from 'element-plus'

// 存储各节点的表单数据
const nodeFormData = ref({})
// 当前选中节点的ID
const selectedNodeId = ref(null)
const rowData = ref({})
const formVisible = ref(false)


// 配置自定义节点数据
const nodeData = [{
  shape: 'custom-vue-node',
  label: 'Vue节点',
  data: {
    label: 'Vue节点1',
    type: 1
  }
},{
  shape: 'custom-vue-node',
  label: 'Vue节点',
  data: {
    label: 'Vue节点2',
    type: 1
  }
},{
  shape: 'custom-vue-node',
  label: 'Vue节点',
  data: {
    label: 'Vue节点3',
    type: 1
  }
},{
  shape: 'custom-vue-node',
  label: 'Vue节点',
  data: {
    label: 'Vue节点4',
    type: 1
  }
}]

// 节点表单配置  --- start
const tableEdit = ref()
// 配置各种表单字段
let options1 = {
    labelWidth: '150px',
    span: 24,
    list: [
        { type: 'number', label: '姓名', prop: 'priority', placeholder: '不设置', min: 1,required: true },
        { type: 'number', label: '职位', prop: 'threshold_max_power', placeholder: '不限制', clearable: true, min: 1},
    ]
}
let options2 = {
    labelWidth: '150px',
    span: 24,
    list: [
         { type: 'number', label: '部门', prop: 'threshold_total_power', placeholder: '不限制', clearable: true, min: 1},
    ]
}
// 定义节点类型与options的映射关系
const nodeTypeToOptionsMap = {
  1: options1,
  2: options2,
  3: options1,
};

// 获取选中节点的类型
const getSelectedNodeType = (nodeId?) => {
  const NodeId = nodeId || selectedNodeId.value
  if (!NodeId) return null;
  const node = graph.getCellById(NodeId);
  return node?.data?.type;
};
// 根据点击的节点,确定展示不同表单
let options = computed(() => {
  const nodeType = getSelectedNodeType();
  return nodeTypeToOptionsMap[nodeType];
})
// 关闭弹窗
const closeDialog = () => {
    formVisible.value = false
}
// 表单更新
const updateFormData = (formData) => {
    nodeFormData.value[selectedNodeId.value] = formData
    // 判断状态
    checkNodeStatus()

    setTimeout(() => {
        closeDialog()
    }, 100)
}
// 【检查节点状态】根据表单校验,展示不同状态
const checkNodeStatus = () => {
    let flag = false
    const nodes = graph.getNodes();
    nodes.forEach(node => {
         const data = node.getData()
        // 检查nodeFormData.value是否有这个node.id的key
        if (nodeFormData.value?.hasOwnProperty(node.id)) {
            // 如果存在,标绿
            node.attr('body/stroke', 'green');
            node.setData({
                ...data,
                status: 'success',
            })
            console.log('成功', node)
            flag = true
        } else {
            // 如果不存在,标红
            node.attr('body/stroke', 'red');
            node.setData({
                ...data,
                status: 'failed',
            })
            console.log('失败', node)
            flag = false
        }
    })
    return flag

}
// 节点表单配置  --- end


// 【保存流程图】可将节点json数据提交到后端
const sumbit = async () => {
    if(!checkNodeStatus()){
        ElMessage.error('请完善节点信息')
        return
    }

    const res = graph.toJSON() // 获取节点json数据,可用于回显数据
}

// 链接桩配置
const ports = {
    groups: {
        top: {
        position: 'top',
        attrs: {
            circle: {
            r: 4,
            magnet: true,
            stroke: '#5F95FF',
            strokeWidth: 1,
            fill: '#fff',
            style: {
                visibility: 'hidden',
            },
            },
        },
        },
        right: {
        position: 'right',
        attrs: {
            circle: {
            r: 4,
            magnet: true,
            stroke: '#5F95FF',
            strokeWidth: 1,
            fill: '#fff',
            style: {
                visibility: 'hidden',
            },
            },
        },
        },
        bottom: {
        position: 'bottom',
        attrs: {
            circle: {
            r: 4,
            magnet: true,
            stroke: '#5F95FF',
            strokeWidth: 1,
            fill: '#fff',
            style: {
                visibility: 'hidden',
            },
            },
        },
        },
        left: {
        position: 'left',
        attrs: {
            circle: {
            r: 4,
            magnet: true,
            stroke: '#5F95FF',
            strokeWidth: 1,
            fill: '#fff',
            style: {
                visibility: 'hidden',
            },
            },
        },
        },
    },
    items: [
        {
        group: 'top',
        },
        {
        group: 'right',
        },
        {
        group: 'bottom',
        },
        {
        group: 'left',
        },
    ],
  }
// 注册vue自定义形状节点
register({
    shape: 'custom-vue-node',
    width: 180,
    height: 36,
    component: ProcessNode,
    ports: ports,
})
const TeleportContainer = getTeleport()
provide('notifyParent', (node) => {
  return node.getData()
})
let graph = null
// 初始化画布
const initGraph = () => {
  graph = new Graph({
    container: document.getElementById('graph-container')!,
    grid: true,
    mousewheel: {
        enabled: true,
        zoomAtMousePosition: true,
        modifiers: 'ctrl',
        minScale: 0.5,
        maxScale: 3,
    },
    connecting: {
        router: 'manhattan',
        connector: {
            name: 'rounded',
            args: {
                radius: 8,
            },
        },
        snap: { radius: 20 },
        allowBlank: false,
        allowLoop: false,
        allowMulti: false,
        highlight: true,
        connectionPoint: 'anchor',
        anchor: 'center',
        createEdge() { // 连接线配置
            return new Shape.Edge({
                attrs: {
                    line: {
                        stroke: '#1890ff',
                        strokeDasharray: 5,
                        targetMarker: 'classic',
                        style: {
                            animation: 'ant-line 30s infinite linear',
                        },
                    },
                },
                zIndex: 0,
            })
        },
        validateConnection({ targetMagnet }) {
            return !!targetMagnet
        },
        validateEdge({ edge }) {
            const { source, target } = edge
            return true
        }
    },
    highlighting: {
        magnetAdsorbed: {
        name: 'stroke',
        args: {
            attrs: {
            fill: '#5F95FF',
            stroke: '#5F95FF',
            },
        },
        },
    },
  })
}

// 配置插件
const configurePlugins = () => {
  graph
    .use(
        new Transform({
        resizing: true,
        rotating: true,
        }),
    )
    .use(
        new Selection({
        rubberband: true,
        showNodeSelectionBox: true,
        }),
    )
    .use(new Snapline())
    .use(new Keyboard())
    .use(new Clipboard())
    .use(new History())
}

// 初始化Stencil
const initStencil = () => {
  const stencil = new Stencil({
    title: '流程配置',
    target: graph,
    stencilGraphWidth: 250,
    stencilGraphHeight: 180,
    collapsable: true,
    groups: [
        {
        title: '事件流程',
        name: 'group1',
        },
    ],
    layoutOptions: {
        columns: 1,
        columnWidth: 175,
        rowHeight: 55,
    },
  })
  document.getElementById('stencil')!.appendChild(stencil.container)
  return stencil
}

// 绑定快捷键
const bindKeys = () => {
  graph.bindKey(['meta+c', 'ctrl+c'], () => {
    const cells = graph.getSelectedCells()
    if (cells.length) {
        graph.copy(cells)
    }
    return false
  })
  graph.bindKey(['meta+x', 'ctrl+x'], () => {
    const cells = graph.getSelectedCells()
    if (cells.length) {
        graph.cut(cells)
    }
    return false
  })
  graph.bindKey(['meta+v', 'ctrl+v'], () => {
    if (!graph.isClipboardEmpty()) {
        const cells = graph.paste({ offset: 32 })
        graph.cleanSelection()
        graph.select(cells)
    }
    return false
  })

  // undo redo
  graph.bindKey(['meta+z', 'ctrl+z'], () => {
    if (graph.canUndo()) {
        graph.undo()
    }
    return false
  })
  graph.bindKey(['meta+shift+z', 'ctrl+shift+z'], () => {
    if (graph.canRedo()) {
        graph.redo()
    }
    return false
  })

  // select all
  graph.bindKey(['meta+a', 'ctrl+a'], () => {
    const nodes = graph.getNodes()
    if (nodes) {
        graph.select(nodes)
    }
  })

  // delete
  graph.bindKey('backspace', () => {
    const cells = graph.getSelectedCells()
    if (cells.length) {
        graph.removeCells(cells)
    }
  })

  // zoom
  graph.bindKey(['ctrl+1', 'meta+1'], () => {
    const zoom = graph.zoom()
    if (zoom < 1.5) {
        graph.zoom(0.1)
    }
  })
  graph.bindKey(['ctrl+2', 'meta+2'], () => {
    const zoom = graph.zoom()
    if (zoom > 0.5) {
        graph.zoom(-0.1)
    }
  })
}

// 控制连接桩显示/隐藏
const showPorts = (ports: NodeListOf<SVGElement>, show: boolean) => {
  for (let i = 0, len = ports.length; i < len; i += 1) {
    ports[i].style.visibility = show ? 'visible' : 'hidden'
  }
}

// 绑定事件----start
const bindEvents = () => {
  graph.on('node:mouseenter', ({ node }) => {
    const container = document.getElementById('graph-container')!
    const ports = container.querySelectorAll(
        '.x6-port-body',
    ) as NodeListOf<SVGElement>
    showPorts(ports, true)
    // 鼠标 Hover 节点时添加删除按钮
    node.addTools({
        name: "button-remove",
        args: {
        x: -10,
        y: -10,
        offset: { x: 10, y: 10 },
        markup: [
            {
            tagName: 'circle',
            selector: 'button',
            attrs: {
                r: 8,
                stroke: '#F25C54',
                strokeWidth: 1,
                fill: 'rgba(214, 40, 40, 0.25)',
                cursor: 'pointer',
            },
            },
            {
            tagName: 'text',
            textContent: '✕',
            selector: 'icon',
            attrs: {
                fill: '#F25C54',
                fontSize: 7,
                textAnchor: 'middle',
                pointerEvents: 'none',
                y: '0.3em',
            },
            },
        ],
        },
    });
  })
  graph.on('node:mouseleave', ({ node }) => {
    const container = document.getElementById('graph-container')!
    const ports = container.querySelectorAll(
        '.x6-port-body',
    ) as NodeListOf<SVGElement>
    showPorts(ports, false)
    // 鼠标移开节点时删除删除按钮
    node.removeTools();
  })

  graph.on("node:removed", ({ node, options }) => {
    if (!options.ui) {
      return;
    }
  });

  // 线删除操作
  graph.on("edge:mouseenter", ({ edge }) => {
    // 鼠标 Hover 边时添加删除按钮
    edge.addTools([
      "target-arrowhead",
      {
        name: "button-remove",
        args: {
          distance: -30,
        },
      },
    ]);
  });

  graph.on("edge:removed", ({ edge, options }) => {
    if (!options.ui) {
      return;
    }
    const cellId = edge.getTargetCellId()
    const target = graph.getCellById(cellId)
    if (target) {
      const id = target.ports.items[0].id
      target && target.setPortProp(id, 'connected', false)
    }else{
      target && target.setPortProp(cellId+'_in', 'connected', false)
    }
  });

  graph.on("edge:mouseleave", ({ edge }) => {
    // 鼠标移开边时删除删除按钮
    edge.removeTools();
  });

  graph.on('node:change:data', ({ node }) => {
    // 修改节点数据的实时响应事件
  })
   // 节点单击事件
  graph.on('node:click', ({ e, x, y, node, view }) => {
    formVisible.value = true

    // 设置新选中的节点
    selectedNodeId.value = node.id

    // 加载该节点之前保存的表单数据(如果有的话)
    if (nodeFormData.value[node.id]) {
        rowData.value = nodeFormData.value[node.id]
    } else {
        // 如果没有保存的数据,则清空表单
        rowData.value = {}
    }
  })
}
// 绑定事件-----end

// 在onMounted中调用这些函数
onMounted(() => {
  initGraph()
  configurePlugins()
  const stencil = initStencil()
  bindKeys()
  bindEvents()
  stencil.load(nodeData, 'group1')
})
</script>
2.3 css部分:
连接线动画,需要单独写个全局的
css
<style>
@keyframes ant-line {
    to {
        stroke-dashoffset: -1000
    }
  }
</style>
style部分
css
<style scoped lang="scss">
.top-btn {
    text-align: right;
}
  #container {
      width: 100%;
      height: 100vh;
      display: flex;
      border: 1px solid #dfe3e8;
    }
    #stencil {
      min-width: 200px;
      height: 100%;
      position: relative;
      border-right: 1px solid #dfe3e8;
    }
    #graph-container {
      width: calc(100% - 200px)!important;
      height: 100%!important;
    }
    #property {
        min-width: 350px;
        height: 100%;
        border-left: 1px solid #dfe3e8;
        .pro-title {
            font-size: 16px;
            font-weight: 500;
            padding: 12px 20px;
            border-bottom: 1px solid #dfe3e8;
            margin-bottom: 24px;
        }

    }
    .x6-widget-stencil  {
      background-color: #fff;
    }
    .x6-widget-stencil-title {
      background-color: #fff;
    }
    .x6-widget-stencil-group-title {
      background-color: #fff !important;
    }
    .x6-widget-transform {
      margin: -1px 0 0 -1px;
      padding: 0px;
      border: 1px solid #239edd;
    }
    .x6-widget-transform > div {
      border: 1px solid #239edd;
    }
    .x6-widget-transform > div:hover {
      background-color: #3dafe4;
    }
    .x6-widget-transform-active-handle {
      background-color: #3dafe4;
    }
    .x6-widget-transform-resize {
      border-radius: 0;
    }
    .x6-widget-selection-inner {
      border: 1px solid #239edd;
    }
    .x6-widget-selection-box {
      opacity: 0;
    }
</style>
4、表单组件 封装(拓展)
相信你也看到我实现【点击节点展示不同表单】,其实是用了一个组件
TableEdit,也是为了简化代码,如果你不需要 ,可忽略原理其实就是不同类型的节点,对应的是不同的表单配置项
options
实现代码如下:
typescript
<template>
	<el-form ref="formRef" :model="form" :rules="rules" :label-width="options?.labelWidth" v-show="isFormShow">
		<el-row v-for="item in options?.list">
			<el-col :span="i.span ? i.span : options.span / item.list.length" v-for="i in item.list">
				<el-divider v-if="i.type === 'divider'" content-position="left"> {{ i.placeholder }}</el-divider>
				<el-form-item v-else :label="i.label" :prop="i.prop" :rules="addRule(i)"
					:label-width="i.labelWidth ? i.labelWidth : options.labelWidth">
					<!-- 文本框、数字框、下拉框、日期框、开关、上传、按钮、滑块 -->
					<el-input v-if="i.type === 'input'" v-model.trim="form[i.prop]" :disabled="i.disabled || item.disabled"
						:placeholder="i.placeholder" :type="i.inputType" :clearable="i.clearable"
						@change="onchange($event, i.onChange)"></el-input>
					<el-input-number v-else-if="i.type === 'number'" v-model.trim="form[i.prop]" :placeholder="i.placeholder"
						:disabled="i.disabled || item.disabled" controls-position="right" :clearable="i.clearable" step-strictly
						@change="onchange($event, i.onChange)" :min="i.min" :max="i.max" :step="i.step"></el-input-number>
					<el-select v-else-if="i.type === 'select'" v-model="form[i.prop]" :clearable="i.clearable"
						:disabled="i.disabled || item.disabled" :multiple="i.selectMultiple"
						:placeholder="i.placeholder" @change="onchange($event, i.onChange)">
						<el-option v-for="opt in i.opts" :label="opt.label" :value="opt.value"
							:disabled="opt.disabled"></el-option>
					</el-select>
					<el-cascader v-else-if="i.type === 'cascader'" expand-trigger="hover" :options="i.opts"
						:disabled="i.disabled || item.disabled" v-model="form[i.prop]"></el-cascader>
					<el-date-picker v-else-if="i.type === 'date'" type="date" v-model="form[i.prop]"
						:disabled="i.disabled || item.disabled" :value-format="i.format"></el-date-picker>
					<el-time-picker v-else-if="i.type === 'time'" v-model="form[i.prop]" value-format="HH:mm"
						format="HH:mm" @change="onchange($event, i.onChange)" :disabled="i.disabled || item.disabled"
						:editable="false" :clearable="false" :default-value="new Date(new Date().setMinutes(0))"></el-time-picker>
					<div v-else-if="i.type === 'timerange'" class='el-time-picker'>
						<el-time-picker  is-range v-model="form[i.prop]" :clearable="i.clearable"
						:editable=false :disabled="i.disabled || item.disabled" range-separator="到" :value-format="i.valueFormat"
						:start-placeholder="i.placeholder" :end-placeholder="i.placeholder" @change="onchange($event, i.onChange)"></el-time-picker>
					</div>
					<div v-else-if="i.type === 'slider'" class="sliderBox">
						<el-slider v-model="form[i.prop]" range show-stops :max="24" :format-tooltip="formatText" :marks="marks"/>
					</div>
					<el-switch v-else-if="i.type === 'switch'" v-model="form[i.prop]"
						:disabled="i.disabled || item.disabled" :active-value="i.activeValue"
						:inactive-value="i.inactiveValue" :active-text="i.activeText"
						:inactive-text="i.inactiveText" @change="onchange($event, i.onChange)"></el-switch>
					<el-upload v-else-if="i.type === 'upload'" action="#" list-type="picture-card" class="uploader"
						:disabled="i.disabled || item.disabled" :file-list="initUploadFileList(i.prop)[i.prop + 'upload']"
						:http-request="i.onUpload" :on-preview="handlePictureCardPreview"
						:on-success="handleUploadSuccess" :on-remove="handleUploadRemove" :limit="i.fileLimit"
						:on-exceed="handleUploadExceed" :before-upload="i.beforeUpload">
						<el-icon>
							<Plus />
						</el-icon>
					</el-upload>
					<el-button v-else-if="i.type === 'button'" v-text="i.activeText" @click="i.click()"
						:disabled="i.disabled || item.disabled"></el-button>
					<slot :name="i.prop" v-else></slot>
					<text v-else>{{ i.placeholder }}</text>
				</el-form-item>
			</el-col>
		</el-row>
		<el-form-item label-width="0">
			<div class="footer" v-if="isFooterShow">
				<el-button plain @click="cancel">取消</el-button>
				<el-button class="submit-btn" @click="saveEdit(formRef)">确 认</el-button>
			</div>
		</el-form-item>
	</el-form>
	<el-dialog v-model="dialogVisible">
		<img w-full :src="dialogImageUrl" alt="预览图片" />
	</el-dialog>
</template>

<script lang="ts" setup>
import { FormInstance, FormRules, UploadProps, ElMessage } from 'element-plus';
import { PropType, ref, watch } from 'vue';

const { options, formData, initData, edit, update, closeDialog } = defineProps({
	options: {
		type: Object,
		required: true
	},
	formData: {
		type: Object,
		required: true
	},
	initData: {
		type: Object,
		required: false
	},
	edit: {
		type: Boolean,
		required: false
	},
	update: {
		type: Function,
		required: true
	},
	closeDialog: {
		type: Function,
		required: true
	},
	// 表单是否显示
	isFormShow: {
		type: Boolean,
		required: false
	},
	// 表单是否显示底部按钮
	isFooterShow: {
		type: Boolean,
		required: false,
		default: true
	}
});

console.log('props===', formData, initData)

const form = ref({ ...(edit ? formData : initData) });
const marks = {
	0: '00:00',
	12: '12:00',
	24: '24:00'
}
const formatText = (value: number) => {
	return `${value}:00`;
}
const rules: FormRules = options?.list?.map(item => {
	if (item.required) {
		return { [item.prop]: [{ required: true, message: `${item.label}不能为空`, trigger: ['blur', 'change'] }] };
	}
	return {};
}).reduce((acc, cur) => ({ ...acc, ...cur }), {});

for (var i = 0; i < options?.list?.length; i++) {
	if (options?.list[i]?.list == null) {
		options.list[i].list = []
		options.list[i].list.push(options?.list[i])
	}
}

const formRef = ref<FormInstance>();
const saveEdit = (formEl: FormInstance | undefined) => {
	if (!formEl) return;
	formEl.validate(valid => {
		if (!valid) return;
		update(form.value);
	});
};

const cancel = () => {
	closeDialog()
}
const onchange = (val: string, onChange?: (val: string, form?) => void) => {
	if (onChange != null) {
		onChange(val, form)
	}
}

const addRule = (item) => {
	if (item.required) {
		return { required: true, message: `${item.label}不能为空`, trigger: 'blur' };
	}
	if (item.rules) {
		return {
			...item.rules,
			validator: (rule, value, callback) => {
				item.rules[0].validator.call(this, rule, value, callback, form.value);
			}
		};
    }
	return null;
}

const dialogImageUrl = ref('')
const dialogVisible = ref(false)

const initUploadFileList = (prop: string) => {
	if (!form.value[prop + "upload"] && form.value[prop]) {
		form.value[prop + "upload"] = form.value[prop].map((value) => { return { name: prop, url: value, status: 'ready' } })
	}
	return form.value
}

const handleUploadRemove: UploadProps['onRemove'] = (uploadFile, uploadFiles) => {
	form.value[uploadFile.name] = uploadFiles.map(value => value.url)
}

const handleUploadSuccess: UploadProps['onSuccess'] = (data, uploadFile, uploadFiles) => {
	if (data) {
		uploadFile.name = data.prop
		uploadFile.url = data.imgUrl
		uploadFile.status = 'ready'
		form.value[data.prop] = uploadFiles.map(value => value.url)
	}
}

const handlePictureCardPreview: UploadProps['onPreview'] = (uploadFile) => {
	dialogImageUrl.value = uploadFile.url!
	dialogVisible.value = true
}

const handleUploadExceed: UploadProps['onExceed'] = () => {
	ElMessage.warning("最多上传4张图片");
}
// 暴露几个字段
defineExpose({
  formRef,
  form,
  saveEdit,
});
</script>

<style scoped>
.sliderBox {
	width: 90%;
	margin-bottom: 18px;
}
.uploader /deep/ .el-upload-list__item {
	transition: none !important;
}

.el-form-item__content {
	max-width: 70%;
}

.el-select {
	--el-select-width: 80%;
}

.el-input {
	--el-input-width: 80%;
}

.el-textarea {
	width: 80%;
	resize: none;
}

.el-input-number {
	width: 80%;
}

.el-cascader {
	width: 80%;
}

.el-time-picker {
	width: 80%;
}
.submit-btn {
	color: #FFF;
	background: var(--main-color);
}
.footer {
	width: 100%;
	margin:0 32px;
	display: flex;
	align-items: center;
	justify-content: flex-end;
}
</style>
三、插件其他常用功能补充:
1、自定义基础图形
某些情况下,如果你需要使用基础图形,而不是像我上面一样自定义vue节点,那么可直接注册相关基础图形
实现方法如下,直接注册即可
typescript
// 初始化基础图形
const initShapes = () => {
Graph.registerNode(
'custom-rect',
{
inherit: 'rect',
width: 66,
height: 36,
attrs: {
body: {
strokeWidth: 1,
stroke: '#5F95FF',
fill: '#EFF4FF',
},
text: {
fontSize: 12,
fill: '#262626',
},
},
ports: { ...ports }, // port链接桩配置可如上
},
true,
)
Graph.registerNode(
'custom-polygon',
{
inherit: 'polygon',
width: 66,
height: 36,
attrs: {
body: {
strokeWidth: 1,
stroke: '#5F95FF',
fill: '#EFF4FF',
},
text: {
fontSize: 12,
fill: '#262626',
},
},
ports: {
...ports,
items: [
{
group: 'top',
},
{
group: 'bottom',
},
],
},
},
true,
)
Graph.registerNode(
'custom-circle',
{
inherit: 'circle',
width: 45,
height: 45,
attrs: {
body: {
strokeWidth: 1,
stroke: '#5F95FF',
fill: '#EFF4FF',
},
text: {
fontSize: 12,
fill: '#262626',
},
},
ports: { ...ports },
},
true,
)
Graph.registerNode(
'custom-image',
{
inherit: 'rect',
width: 52,
height: 52,
markup: [
{
tagName: 'rect',
selector: 'body',
},
{
tagName: 'image',
},
{
tagName: 'text',
selector: 'label',
},
],
attrs: {
body: {
stroke: '#5F95FF',
fill: '#5F95FF',
},
image: {
width: 26,
height: 26,
refX: 13,
refY: 16,
},
label: {
refX: 3,
refY: 2,
textAnchor: 'left',
textVerticalAnchor: 'top',
fontSize: 12,
fill: '#fff',
},
},
ports: { ...ports },
},
true,
)
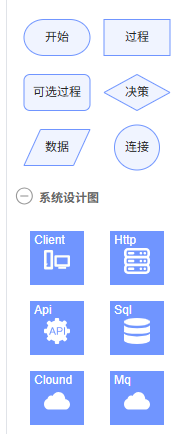
}2、流程图的数据保存和回显
如官网的这个例子,绘制的流程图:
2.1 保存
如果整个流程图绘制完成后,保存的方式就是:
typescript
let jsondata = graph.toJSON()这样得到的一个大json数据,可以console.log出来,如下:
typescript
let jsondata =  [
    {
        "shape": "edge",
        "id": "d941e09e-e938-4041-9861-1d081bfd01d1",
        "zIndex": 0,
        "source": {
            "cell": "b39149ab-070e-4dfc-8d50-305f16950ffc",
            "port": "35e782cd-cf54-4000-911e-1e9fa3209bce"
        },
        "target": {
            "cell": "b7af14b3-e20a-4421-966c-4f370636193c",
            "port": "61603aea-93ed-4af5-8535-fc6ef1c27ba6"
        }
    },
    {
        "shape": "edge",
        "id": "151a7294-5129-45fd-8797-cde24c539c66",
        "zIndex": 0,
        "source": {
            "cell": "b7af14b3-e20a-4421-966c-4f370636193c",
            "port": "d3e6af3d-a4c7-4637-a732-fbf208bea189"
        },
        "target": {
            "cell": "c02638ad-28e3-44d8-acb2-132291921774",
            "port": "7210f722-bb69-449f-9c31-769f3b612ec8"
        }
    },
    {
        "label": "开始",
        "x": 560,
        "y": 160,
        "ports": [
            {
                "group": "top",
                "id": "d2a67c86-01df-4825-a753-c2bb50ad904c"
            },
            {
                "group": "right",
                "id": "77a8625e-157d-440d-b9c7-ad6ac7124de3"
            },
            {
                "group": "bottom",
                "id": "35e782cd-cf54-4000-911e-1e9fa3209bce"
            },
            {
                "group": "left",
                "id": "26ff3e2f-5fa4-4b7a-acaa-d4477a9116b8"
            }
        ],
        "data": {
            "isStart": true
        },
        "shape": "custom-rect",
        "id": "b39149ab-070e-4dfc-8d50-305f16950ffc",
        "zIndex": 1
    },
    {
        "label": "过程",
        "x": 560,
        "y": 244,
        "ports": [
            {
                "group": "top",
                "id": "61603aea-93ed-4af5-8535-fc6ef1c27ba6",
                "connected": false
            },
            {
                "group": "right",
                "id": "73f3699c-e013-49a3-8118-d32f7b6c1094"
            },
            {
                "group": "bottom",
                "id": "d3e6af3d-a4c7-4637-a732-fbf208bea189"
            },
            {
                "group": "left",
                "id": "1b7bf6b8-d93b-4c29-9001-de1ae1b043b7"
            }
        ],
        "shape": "custom-rect",
        "id": "b7af14b3-e20a-4421-966c-4f370636193c",
        "zIndex": 2
    },
    {
        "label": "连接",
        "x": 570.5,
        "y": 343,
        "ports": [
            {
                "group": "top",
                "id": "7210f722-bb69-449f-9c31-769f3b612ec8"
            },
            {
                "group": "right",
                "id": "7c2f5921-a4ac-400d-8260-f4a75e8dd9e4"
            },
            {
                "group": "bottom",
                "id": "1bbebb2b-8d52-49ac-b0fe-b6da02d82295"
            },
            {
                "group": "left",
                "id": "3884d732-c382-4db5-a340-04435decf83f"
            }
        ],
        "shape": "custom-circle",
        "id": "c02638ad-28e3-44d8-acb2-132291921774",
        "zIndex": 3
    }
]
数据处理: 如果后端能同意这样存储到后端那当然可以啦,如果不行,那就需要处理一下,比如:
typescript
// 【保存】数据处理
const saveData = (jsondata) =>{
    return jsondata.map(item =>{
        if(item.shape === 'edge'){
            return item
        }
        return {
            label: item.attrs?.text?.text,
            x: item.position?.x,
            y: item.position?.y,
            ports: item.ports?.items,
            data: item.data, // 该节点的自定义数据
            shape: item.shape,
            id: item.id,
            zIndex: item.zIndex,
        }
    })
}
当然,你可以按照你的实际情况,按照跟后端约定好的数据格式处理,之后进行存储
2.2 回显
存储到后端之后,我们在编辑或者查看场景下,还是需要回显一下流程图的,官网的图形回显渲染api是:
typescript
graph.fromJSON(jsondata)1、【直接回显】
如果你是在保存的时候,保存的
graph.toJSON()api保存的原json数据,那么直接调用graph.fromJSON就可以了
2、【处理后回显】如果你保存时进行了【数据处理】,那么,就需要把处理的json数据,还原成
graph.toJSON()得到的这种数据格式之后,再调用graph.fromJSON回显数据
end~
希望记录的问题能帮助到你!