前言
你是不是看到ui设计的3d柱状图,然后觉得好酷炫,想学习一下怎么实现,但是又不知道从哪里开始,今天我就来带你一步一步实现一个3d柱状图。
依旧是使用我们的Trae大师,我们一步一步来,一点点拆解3d柱状图,慢慢将我们要的细节补充给Trae,争取不写一行代码将这个效果实现出来。
首先把ui设计的图发出来,让Trae进行模仿,看看Trae是怎么做的。我们可以学习他的思路,后续遇到类似的可以游刃有余的开发,开发思维真的很重要哦 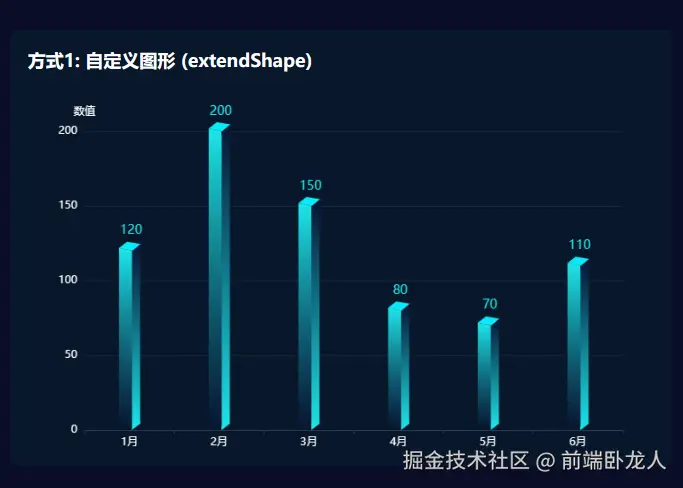
向Trae进行提问

然后Trae输出了第一个版本,这是啥啊,跟图片完全不一样

再次对Trae进行提问,告诉他这是3d柱状图,要按照图片的样式来

这次生成的效果就很不错
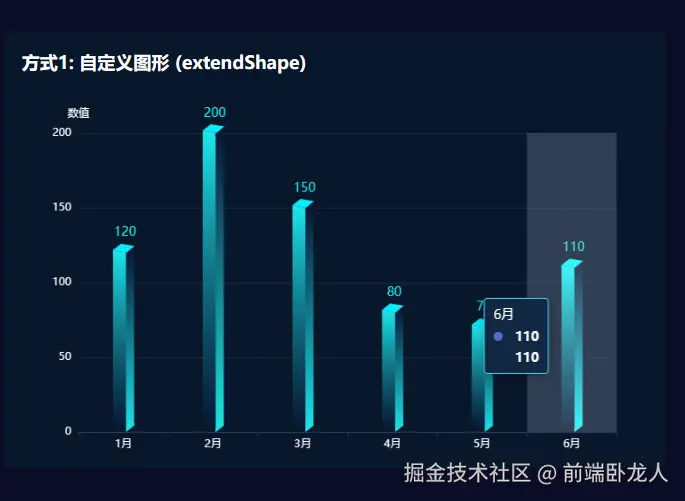 鼠标悬浮的效果也是有的,看起来就很高大上,接下来我们一步一步来拆解这个3d柱状图,看看Trae是怎么实现的。
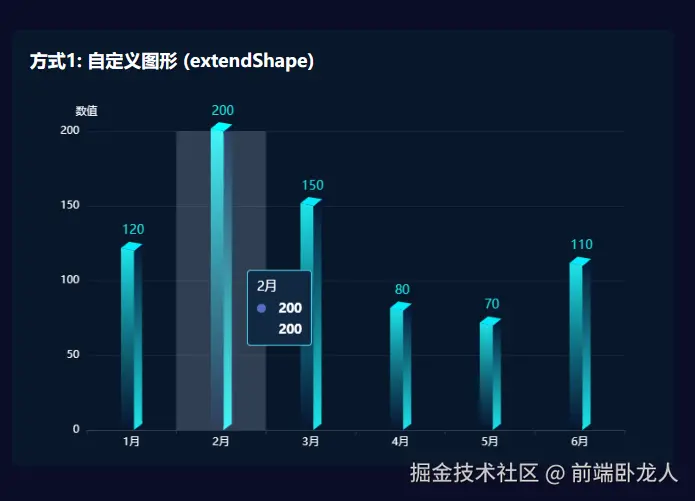
Trae代码分析
定义3D柱状图参数
ini
        const BAR_WIDTH = 60;
        const BAR_DEPTH = 30;
        const BAR_TOP_OFFSET = 15;
自定义左侧面 - 使用渐变色
ini
        const CubeLeft = echarts.graphic.extendShape({
            shape: { x: 0, y: 0, width: 0, height: 0 },
            buildPath: function(ctx, shape) {
                const xAxisPoint = shape.xAxisPoint;
                const c0 = [shape.x, shape.y];
                const c1 = [shape.x - BAR_DEPTH, shape.y - BAR_TOP_OFFSET];
                const c2 = [shape.x - BAR_DEPTH, xAxisPoint[1] - BAR_TOP_OFFSET];
                const c3 = [shape.x, xAxisPoint[1]];

                ctx.moveTo(c0[0], c0[1]);
                ctx.lineTo(c1[0], c1[1]);
                ctx.lineTo(c2[0], c2[1]);
                ctx.lineTo(c3[0], c3[1]);
                ctx.closePath();
            }
        });
自定义右侧面
ini
        const CubeRight = echarts.graphic.extendShape({
            shape: { x: 0, y: 0, width: 0, height: 0 },
            buildPath: function(ctx, shape) {
                const xAxisPoint = shape.xAxisPoint;
                const c0 = [shape.x + shape.width, shape.y];
                const c1 = [shape.x + shape.width - BAR_DEPTH, shape.y - BAR_TOP_OFFSET];
                const c2 = [shape.x + shape.width - BAR_DEPTH, xAxisPoint[1] - BAR_TOP_OFFSET];
                const c3 = [shape.x + shape.width, xAxisPoint[1]];

                ctx.moveTo(c0[0], c0[1]);
                ctx.lineTo(c1[0], c1[1]);
                ctx.lineTo(c2[0], c2[1]);
                ctx.lineTo(c3[0], c3[1]);
                ctx.closePath();
            }
        });
自定义顶部面
ini
        const CubeTop = echarts.graphic.extendShape({
            shape: { x: 0, y: 0, width: 0, height: 0 },
            buildPath: function(ctx, shape) {
                const c0 = [shape.x, shape.y];
                const c1 = [shape.x + shape.width, shape.y];
                const c2 = [shape.x + shape.width - BAR_DEPTH, shape.y - BAR_TOP_OFFSET];
                const c3 = [shape.x - BAR_DEPTH, shape.y - BAR_TOP_OFFSET];

                ctx.moveTo(c0[0], c0[1]);
                ctx.lineTo(c1[0], c1[1]);
                ctx.lineTo(c2[0], c2[1]);
                ctx.lineTo(c3[0], c3[1]);
                ctx.closePath();
            }
        });
注册自定义图形
arduino
echarts.graphic.registerShape('CubeLeft', CubeLeft);
charts.graphic.registerShape('CubeRight', CubeRight);
echarts.graphic.registerShape('CubeTop', CubeTop);
总结
通过自定义图形,我们可以实现更加丰富和个性化的图表效果。例如,我们可以自定义柱状图的柱子、折线图的折线、饼图的扇形等,再也不怕ui设计出让前端头疼的echarts图表
当然最好还是跟ui设计友好相处,最好是让他按照原来的echart组件进行小改动,不要天天想着创新,开发排期又很紧,这样会让前端和ui设计师之间闹得不愉快。
在本文中,我们使用Trae通过自定义立方体图形,实现了柱状图中的3d柱子效果,并且通过鼠标事件实现了柱子的悬停效果,如果你没有头绪怎么实现3d柱状图可以让Trae尝试一下,毕竟还是免费,大胆的去使用Trae。
希望本文对你有所帮助,如果你有任何问题或建议,欢迎在评论区留言。