AWR 报告中的"Global Cache and Enqueue Services - Workload Characteristic"部分反映了 Oracle RAC 节点通过全局缓存服务 (GCS) 和全局入队服务 (GES) 协调块访问的效率。换句话说,它告诉我们节点之间块传输的速度,以及互连和块管理是否健康或存在争用。
以下是一个健康 AWR 报告的样本: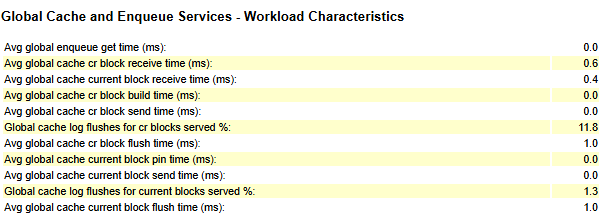
| Avg global enqueue get time (ms): | 0.0 |
| Avg global cache cr block receive time (ms): | 0.6 |
| Avg global cache current block receive time (ms): | 0.4 |
| Avg global cache cr block build time (ms): | 0.0 |
| Avg global cache cr block send time (ms): | 0.0 |
| Global cache log flushes for cr blocks served %: | 11.8 |
| Avg global cache cr block flush time (ms): | 1.0 |
| Avg global cache current block pin time (ms): | 0.0 |
| Avg global cache current block send time (ms): | 0.0 |
| Global cache log flushes for current blocks served %: | 1.3 |
| Avg global cache current block flush time (ms): | 1.0 |
理解接收时间
"Avg global cache cr block receive time"和"Avg global cache current block receive time"指标分别测量 RAC 节点从另一个节点缓存中获取一致读 (CR) 块(用于 SELECT 查询)和当前块(用于 INSERT/UPDATE 等 DML 操作)的平均持续时间。
在单实例数据库中,这些块将直接从本地磁盘或内存中获取,而无需节点间通信。因此,如果 RAC 中从远程节点获取块的时间慢于从磁盘读取,则表明对于该工作负载,使用 RAC 可能不是正确的架构选择。
健康值通常低于 1 ms。在示例中,CR 块的 0.6 ms 和当前块的 0.4 ms 反映了很好的性能。
计算平均接收时间
这些平均值来源于同一 AWR 报告中的"关键实例活动统计"部分:
| Statistic | Total | per Second | per Trans |
|---|---|---|---|
| gc cr block receive time | 10,099 | 2.81 | 0.10 |
| gc cr blocks received | 180,209 | 50.08 | 1.77 |
| gc current block receive time | 10,923 | 3.04 | 0.11 |
| gc current blocks received | 263,216 | 73.14 | 2.58 |
注意:"gc cr block receive time"和"gc current block receive time"的单位是百分秒(1/100 秒)。
Oracle 计算平均值如下:
sql
平均 CR 块接收时间 (ms) = (gc cr block receive time per second / gc cr blocks received per second) × 10
= (2.81 / 50.08) × 10 ≈ 0.56 ms

平均当前块接收时间 (ms) = (gc current block receive time per second / gc current blocks received per second) × 10
= (3.04 / 73.14) × 10 ≈ 0.41 ms
这些值与 AWR 报告上的值一致。
块传输的三个阶段
RAC 中的块传输在服务节点上发生三个阶段。这些阶段根据块类型略有不同:
CR block:
- gc cr block build time:构建块的读一致图像。
- gc cr block flush time:如果必要,将更改刷新到重做日志。
- gc cr block send time:通过互连发送块。
Current block:
- gc current block pin time:固定(锁定)块以进行独占传输。
- gc current block flush time:强制将任何脏更改写入重做日志。
- gc current block send time:将块发送到请求节点。
Flush阶段通常是最慢的,但并非每次传输都需要它。因此,报告中包括flush比率:
- Global cache log flushes for cr blocks served %
- Global cache log flushes for current blocks served %
通常,工作负载中的数据被修改的越多,这两个百分比越大。
这3个阶段发生在服务节点上,因此不能直接将这3个阶段相加来获取接收节点上的接收时间。尽管接收节点和服务节点花的时间可能相似。
不健康案例研究
为了对比,分析一下这个不健康的案例,其中过高的flush时间大大降低了性能。
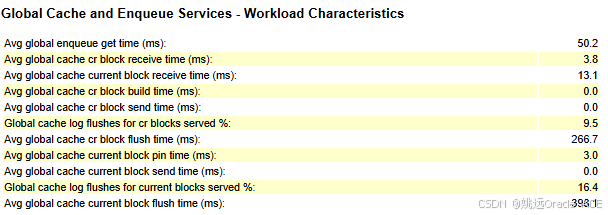
Global Cache and Enqueue Services - Workload Characteristics
Avg global enqueue get time (ms): 50.2
Avg global cache cr block receive time (ms): 3.8
Avg global cache current block receive time (ms): 13.1
Avg global cache cr block build time (ms): 0.0
Avg global cache cr block send time (ms): 0.0
Global cache log flushes for cr blocks served %: 9.5
Avg global cache cr block flush time (ms): 266.7
Avg global cache current block pin time (ms): 3.0
Avg global cache current block send time (ms): 0.0
Global cache log flushes for current blocks served %: 16.4
Avg global cache current block flush time (ms): 398.1
在这里,无法容忍的高flush时间(CR 的 266.7 ms,CURRENT的 398.1 ms)是主要罪魁祸首,导致接收时间膨胀和入队等待增加。这表明可能存在重做日志争用或 I/O 瓶颈。
号主在certview.oracle.com网站上的证书清单截图。

关于号主,姚远:
- Oracle ACE(Oracle和MySQL数据库方向)
- 华为云最有价值专家
- 《MySQL 8.0运维与优化》的作者
- 拥有 Oracle 10g、12c和19c OCM等数十项数据库认证
- 曾任IBM公司数据库部门经理
- 20+年DBA经验,服务2万+客户
- 精通C和Java,发明两项计算机专利