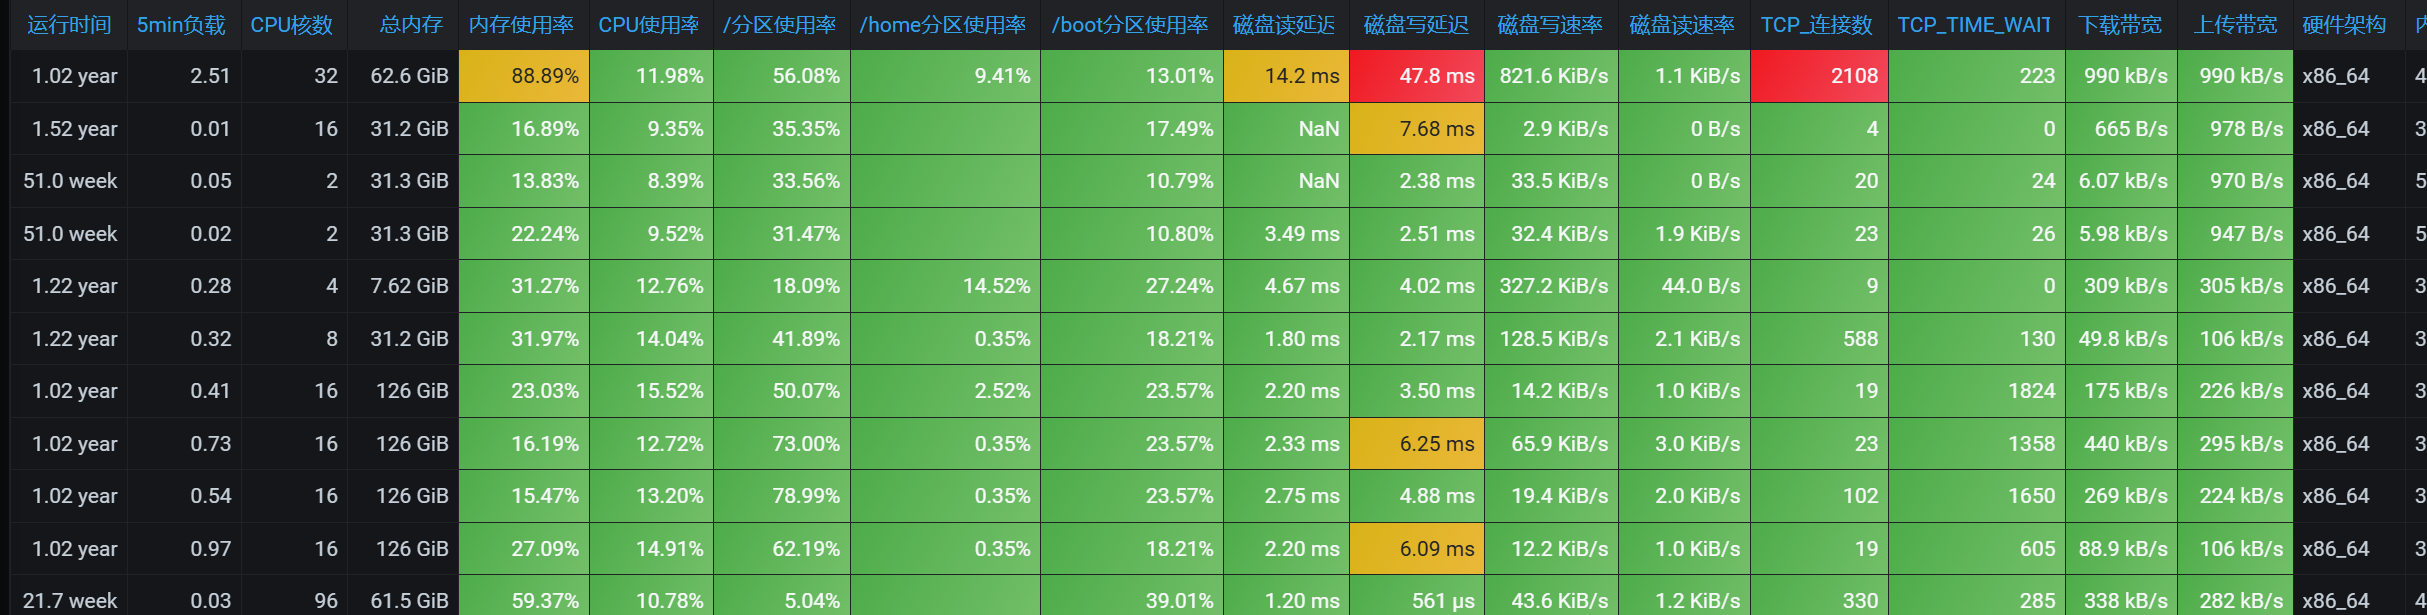
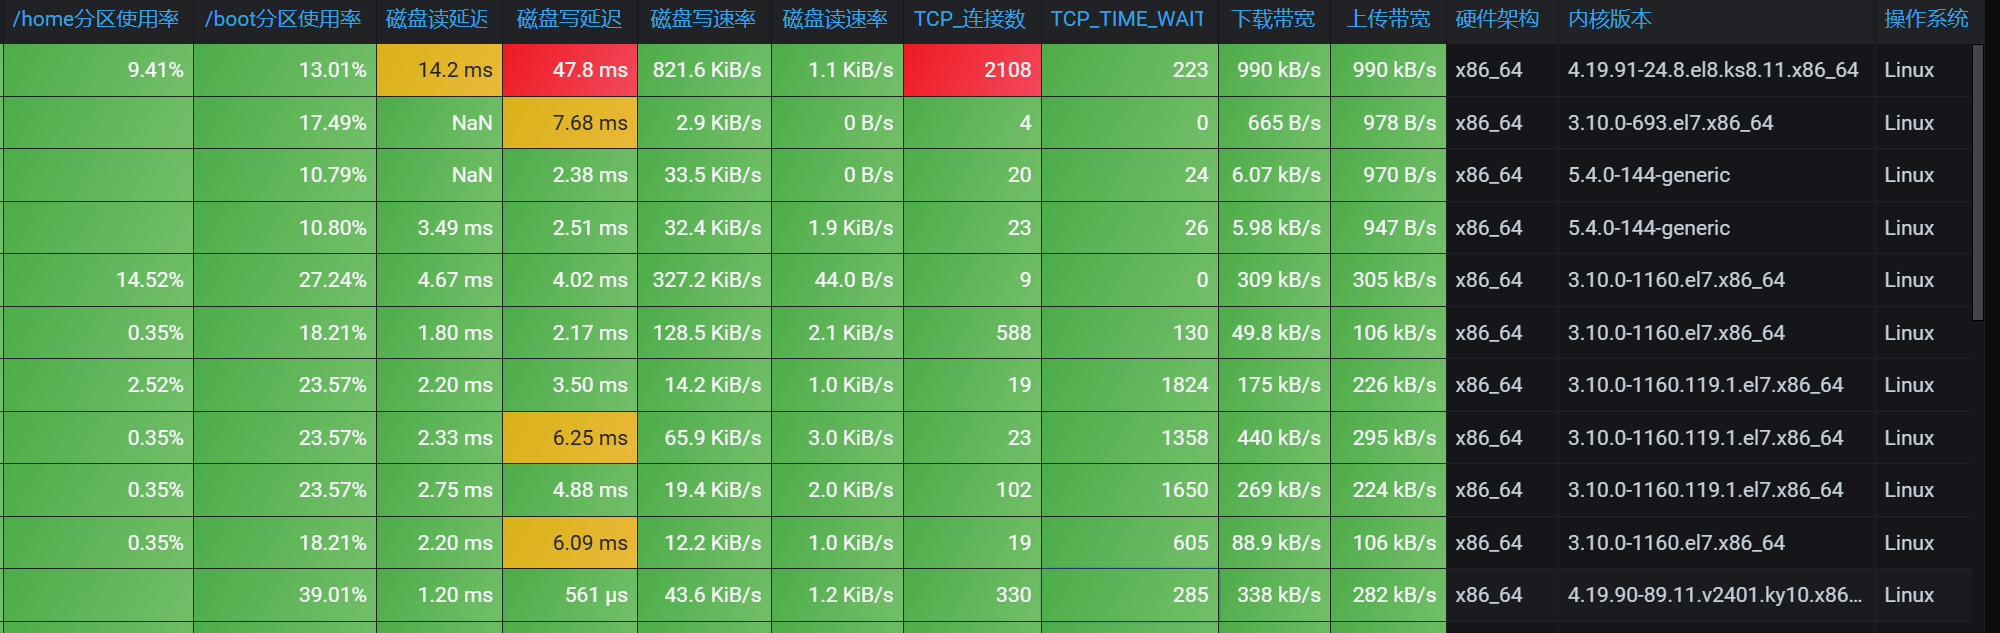
成品如下图展示,前面没展示主机名和IP地址(注:因为我的prometheus主机分组(job)都是自定义互相对应,在grafana上的Metrics都是按照job进行分组的,可以自行改成
instance分组 )
对应的json
{
"annotations": {
"list": [
{
"builtIn": 1,
"datasource": "-- Grafana --",
"enable": true,
"hide": true,
"iconColor": "rgba(0, 211, 255, 1)",
"name": "Annotations & Alerts",
"type": "dashboard"
}
]
},
"editable": true,
"gnetId": null,
"graphTooltip": 0,
"id": 14,
"links": \[\],
"panels": [
{
"datasource": null,
"description": "服务器整体情况概览",
"fieldConfig": {
"defaults": {
"color": {
"mode": "thresholds"
},
"custom": {
"align": null,
"filterable": false
},
"mappings": \[\],
"thresholds": {
"mode": "absolute",
"steps": [
{
"color": "green",
"value": null
},
{
"color": "red",
"value": 80
}
]
}
},
"overrides": [
{
"matcher": {
"id": "byName",
"options": "sysname"
},
"properties": [
{
"id": "custom.width",
"value": 79
}
]
},
{
"matcher": {
"id": "byName",
"options": "硬件架构"
},
"properties": [
{
"id": "custom.width",
"value": 75
}
]
},
{
"matcher": {
"id": "byName",
"options": "IP地址"
},
"properties": [
{
"id": "custom.width",
"value": 103
}
]
},
{
"matcher": {
"id": "byName",
"options": "操作系统"
},
"properties": [
{
"id": "custom.width",
"value": 72
}
]
},
{
"matcher": {
"id": "byName",
"options": "内核版本"
},
"properties": [
{
"id": "custom.width",
"value": 211
}
]
},
{
"matcher": {
"id": "byName",
"options": "运行时间"
},
"properties": [
{
"id": "custom.width",
"value": 78
},
{
"id": "unit",
"value": "s"
}
]
},
{
"matcher": {
"id": "byName",
"options": "总内存"
},
"properties": [
{
"id": "custom.width",
"value": 74
},
{
"id": "unit",
"value": "bytes"
}
]
},
{
"matcher": {
"id": "byName",
"options": "CPU核数"
},
"properties": [
{
"id": "custom.width",
"value": 71
}
]
},
{
"matcher": {
"id": "byName",
"options": "5min负载"
},
"properties": [
{
"id": "custom.width",
"value": 76
},
{
"id": "decimals",
"value": 2
}
]
},
{
"matcher": {
"id": "byName",
"options": "主机"
},
"properties": [
{
"id": "custom.width",
"value": 163
}
]
},
{
"matcher": {
"id": "byName",
"options": "CPU使用率"
},
"properties": [
{
"id": "custom.width",
"value": 83
},
{
"id": "decimals",
"value": 2
},
{
"id": "unit",
"value": "percent"
},
{
"id": "custom.displayMode",
"value": "color-background"
},
{
"id": "thresholds",
"value": {
"mode": "absolute",
"steps": [
{
"color": "green",
"value": null
},
{
"color": "#EAB839",
"value": 70
},
{
"color": "red",
"value": 80
}
]
}
}
]
},
{
"matcher": {
"id": "byName",
"options": "内存使用率"
},
"properties": [
{
"id": "custom.width",
"value": 87
},
{
"id": "custom.displayMode",
"value": "color-background"
},
{
"id": "thresholds",
"value": {
"mode": "absolute",
"steps": [
{
"color": "green",
"value": null
},
{
"color": "#EAB839",
"value": 80
},
{
"color": "red",
"value": 90
}
]
}
},
{
"id": "unit",
"value": "percent"
},
{
"id": "decimals",
"value": 2
}
]
},
{
"matcher": {
"id": "byName",
"options": "/分区使用率"
},
"properties": [
{
"id": "custom.width",
"value": 91
},
{
"id": "unit",
"value": "percent"
},
{
"id": "decimals",
"value": 2
},
{
"id": "custom.displayMode",
"value": "color-background"
},
{
"id": "thresholds",
"value": {
"mode": "absolute",
"steps": [
{
"color": "green",
"value": null
},
{
"color": "#EAB839",
"value": 80
},
{
"color": "red",
"value": 90
}
]
}
}
]
},
{
"matcher": {
"id": "byName",
"options": "TCP_TIME_WAIT"
},
"properties": [
{
"id": "custom.width",
"value": 118
},
{
"id": "custom.displayMode",
"value": "color-background"
},
{
"id": "thresholds",
"value": {
"mode": "absolute",
"steps": [
{
"color": "green",
"value": null
},
{
"color": "#EAB839",
"value": 5000
},
{
"color": "red",
"value": 10000
}
]
}
}
]
},
{
"matcher": {
"id": "byName",
"options": "TCP_连接数"
},
"properties": [
{
"id": "custom.width",
"value": 92
},
{
"id": "custom.displayMode",
"value": "color-background"
},
{
"id": "thresholds",
"value": {
"mode": "absolute",
"steps": [
{
"color": "green",
"value": null
},
{
"color": "#EAB839",
"value": 1000
},
{
"color": "red",
"value": 2000
}
]
}
}
]
},
{
"matcher": {
"id": "byName",
"options": "磁盘读速率"
},
"properties": [
{
"id": "custom.width",
"value": 88
},
{
"id": "custom.displayMode",
"value": "color-background"
},
{
"id": "thresholds",
"value": {
"mode": "absolute",
"steps": [
{
"color": "green",
"value": null
},
{
"color": "#EAB839",
"value": 500000000
},
{
"color": "red",
"value": 800000000
}
]
}
},
{
"id": "unit",
"value": "binBps"
},
{
"id": "decimals",
"value": 1
}
]
},
{
"matcher": {
"id": "byName",
"options": "下载带宽"
},
"properties": [
{
"id": "custom.width",
"value": 75
},
{
"id": "unit",
"value": "Bps"
},
{
"id": "custom.displayMode",
"value": "color-background"
},
{
"id": "thresholds",
"value": {
"mode": "absolute",
"steps": [
{
"color": "green",
"value": null
},
{
"color": "#EAB839",
"value": 800000000
},
{
"color": "red",
"value": 950000000
}
]
}
}
]
},
{
"matcher": {
"id": "byName",
"options": "上传带宽"
},
"properties": [
{
"id": "custom.width",
"value": 77
},
{
"id": "unit",
"value": "Bps"
},
{
"id": "custom.displayMode",
"value": "color-background"
},
{
"id": "thresholds",
"value": {
"mode": "absolute",
"steps": [
{
"color": "green",
"value": null
},
{
"color": "#EAB839",
"value": 800000000
},
{
"color": "red",
"value": 950000000
}
]
}
}
]
},
{
"matcher": {
"id": "byName",
"options": "磁盘写延迟 "
},
"properties": [
{
"id": "custom.width",
"value": 90
},
{
"id": "unit",
"value": "s"
},
{
"id": "custom.displayMode",
"value": "color-background"
},
{
"id": "thresholds",
"value": {
"mode": "absolute",
"steps": [
{
"color": "green",
"value": null
},
{
"color": "#EAB839",
"value": 0.005
},
{
"color": "red",
"value": 0.035
}
]
}
}
]
},
{
"matcher": {
"id": "byName",
"options": "磁盘读延迟"
},
"properties": [
{
"id": "custom.width",
"value": 84
},
{
"id": "unit",
"value": "s"
},
{
"id": "custom.displayMode",
"value": "color-background"
},
{
"id": "thresholds",
"value": {
"mode": "absolute",
"steps": [
{
"color": "green",
"value": null
},
{
"color": "#EAB839",
"value": 0.005
},
{
"color": "red",
"value": 0.035
}
]
}
}
]
},
{
"matcher": {
"id": "byName",
"options": "/boot分区使用率"
},
"properties": [
{
"id": "custom.width",
"value": 122
},
{
"id": "unit",
"value": "percent"
},
{
"id": "decimals",
"value": 2
},
{
"id": "custom.displayMode",
"value": "color-background"
},
{
"id": "thresholds",
"value": {
"mode": "absolute",
"steps": [
{
"color": "green",
"value": null
},
{
"color": "#EAB839",
"value": 80
},
{
"color": "red",
"value": 90
}
]
}
}
]
},
{
"matcher": {
"id": "byName",
"options": "/home分区使用率"
},
"properties": [
{
"id": "custom.width",
"value": 127
},
{
"id": "unit",
"value": "percent"
},
{
"id": "decimals",
"value": 2
},
{
"id": "custom.displayMode",
"value": "color-background"
},
{
"id": "thresholds",
"value": {
"mode": "absolute",
"steps": [
{
"color": "green",
"value": null
},
{
"color": "#EAB839",
"value": 80
},
{
"color": "red",
"value": 90
}
]
}
}
]
},
{
"matcher": {
"id": "byName",
"options": "主机名"
},
"properties": [
{
"id": "custom.width",
"value": 157
}
]
},
{
"matcher": {
"id": "byName",
"options": "磁盘写速率"
},
"properties": [
{
"id": "custom.width",
"value": 89
},
{
"id": "unit",
"value": "binBps"
},
{
"id": "decimals",
"value": 1
},
{
"id": "custom.displayMode",
"value": "color-background"
},
{
"id": "thresholds",
"value": {
"mode": "absolute",
"steps": [
{
"color": "green",
"value": null
},
{
"color": "#EAB839",
"value": 400000000
},
{
"color": "red",
"value": 600000000
}
]
}
}
]
}
]
},
"gridPos": {
"h": 20,
"w": 24,
"x": 0,
"y": 0
},
"id": 2,
"options": {
"showHeader": true,
"sortBy": \[\]
},
"pluginVersion": "7.5.17",
"targets": [
{
"exemplar": true,
"expr": "node_uname_info",
"format": "table",
"instant": true,
"interval": "",
"legendFormat": "",
"refId": "A"
},
{
"exemplar": true,
"expr": "time() - node_boot_time_seconds",
"format": "table",
"hide": false,
"instant": true,
"interval": "",
"legendFormat": "运行时间",
"refId": "B"
},
{
"exemplar": true,
"expr": "node_memory_MemTotal_bytes",
"format": "table",
"hide": false,
"instant": true,
"interval": "",
"legendFormat": "服务器总内存",
"refId": "C"
},
{
"exemplar": true,
"expr": "count by (job)(rate(node_cpu_seconds_total{mode=\"idle\"}5m))",
"format": "table",
"hide": false,
"instant": true,
"interval": "",
"intervalFactor": 1,
"legendFormat": "CPU总核数",
"refId": "D"
},
{
"exemplar": true,
"expr": "node_load5",
"format": "table",
"hide": false,
"instant": true,
"interval": "",
"legendFormat": "5min负载",
"refId": "E"
},
{
"exemplar": true,
"expr": "(1 - rate(node_cpu_seconds_total{mode=\"idle\"}5m)) * 100",
"format": "table",
"hide": false,
"instant": true,
"interval": "",
"legendFormat": "CPU使用率",
"refId": "F"
},
{
"exemplar": true,
"expr": "(1 - (node_memory_MemAvailable_bytes / node_memory_MemTotal_bytes)) * 100",
"format": "table",
"hide": false,
"instant": true,
"interval": "",
"legendFormat": "内存使用率",
"refId": "G"
},
{
"exemplar": true,
"expr": "(node_filesystem_size_bytes{mountpoint=\"/\"} - node_filesystem_free_bytes{mountpoint=\"/\"}) / node_filesystem_size_bytes{mountpoint=\"/\"} * 100\r",
"format": "table",
"hide": false,
"instant": true,
"interval": "",
"legendFormat": "/分区使用率",
"refId": "H"
},
{
"exemplar": true,
"expr": "(node_filesystem_size_bytes{mountpoint=\"/home\"} - node_filesystem_free_bytes{mountpoint=\"/home\"}) / node_filesystem_size_bytes{mountpoint=\"/home\"} * 100\r",
"format": "table",
"hide": false,
"instant": true,
"interval": "",
"legendFormat": "/home分区使用率",
"refId": "I"
},
{
"exemplar": true,
"expr": "(node_filesystem_size_bytes{mountpoint=\"/boot\"} - node_filesystem_free_bytes{mountpoint=\"/boot\"}) / node_filesystem_size_bytes{mountpoint=\"/boot\"} * 100\r",
"format": "table",
"hide": false,
"instant": true,
"interval": "",
"legendFormat": "/boot分区使用率",
"refId": "J"
},
{
"exemplar": true,
"expr": "max by(instance,job) (rate(node_disk_read_time_seconds_total5m) / rate(node_disk_reads_completed_total5m))\r",
"format": "table",
"hide": false,
"instant": true,
"interval": "",
"legendFormat": "磁盘读延迟 ",
"refId": "L"
},
{
"exemplar": true,
"expr": "max(rate(node_disk_written_bytes_total5m)) by (instance,job)",
"format": "table",
"hide": false,
"instant": true,
"interval": "",
"legendFormat": "磁盘写速率",
"refId": "M"
},
{
"exemplar": true,
"expr": "max by(job) (rate(node_disk_write_time_seconds_total5m) / rate(node_disk_writes_completed_total5m))",
"format": "table",
"hide": false,
"instant": true,
"interval": "",
"legendFormat": "磁盘写延迟 ",
"refId": "N"
},
{
"exemplar": true,
"expr": "node_netstat_Tcp_CurrEstab",
"format": "table",
"hide": false,
"instant": true,
"interval": "",
"legendFormat": "TCP_连接数",
"refId": "R"
},
{
"exemplar": true,
"expr": "node_sockstat_TCP_tw",
"format": "table",
"hide": false,
"instant": true,
"interval": "",
"legendFormat": "TCP_TIME_WAIT",
"refId": "S"
},
{
"exemplar": true,
"expr": "max(rate(node_network_receive_bytes_total5m)) by (job)",
"format": "table",
"hide": false,
"instant": true,
"interval": "",
"legendFormat": "下载带宽",
"refId": "T"
},
{
"exemplar": true,
"expr": "max(rate(node_network_transmit_bytes_total5m)) by (job)",
"format": "table",
"hide": false,
"instant": true,
"interval": "",
"legendFormat": "上传带宽",
"refId": "U"
},
{
"exemplar": true,
"expr": "max(rate(node_disk_read_bytes_total5m)) by (instance,job)",
"format": "table",
"hide": false,
"instant": true,
"interval": "",
"legendFormat": "磁盘读速率",
"refId": "K"
}
],
"title": "服务器整体情况概览",
"transformations": [
{
"id": "seriesToColumns",
"options": {
"byField": "job"
}
},
{
"id": "filterFieldsByName",
"options": {
"include": {
"names": [
"job",
"instance 1",
"machine",
"nodename",
"release",
"sysname",
"Value #B",
"Value #C",
"Value #D",
"Value #E",
"Value #F",
"Value #G",
"Value #H",
"Value #I",
"Value #J",
"Value #L",
"Value #M",
"Value #N",
"Value #O",
"Value #P",
"Value #Q",
"Value #R",
"Value #S",
"Value #T",
"Value #U",
"Value #K"
]
}
}
},
{
"id": "sortBy",
"options": {
"fields": {},
"sort": [
{
"field": "job"
}
]
}
},
{
"id": "organize",
"options": {
"excludeByName": {},
"indexByName": {
"Value #B": 3,
"Value #C": 6,
"Value #D": 5,
"Value #E": 4,
"Value #F": 8,
"Value #G": 7,
"Value #H": 9,
"Value #I": 10,
"Value #J": 11,
"Value #K": 15,
"Value #L": 12,
"Value #M": 14,
"Value #N": 13,
"Value #R": 16,
"Value #S": 17,
"Value #T": 18,
"Value #U": 19,
"instance 1": 1,
"job": 0,
"machine": 20,
"nodename": 2,
"release": 21,
"sysname": 22
},
"renameByName": {
"Value #A": "运行时间",
"Value #B": "运行时间",
"Value #C": "总内存",
"Value #D": "CPU核数",
"Value #E": "5min负载",
"Value #F": "CPU使用率",
"Value #G": "内存使用率",
"Value #H": "/分区使用率",
"Value #I": "/home分区使用率",
"Value #J": "/boot分区使用率",
"Value #K": "磁盘读速率",
"Value #L": "磁盘读延迟",
"Value #M": "磁盘写速率",
"Value #N": "磁盘写延迟 ",
"Value #O": "操作最频繁的磁盘(IOPS)",
"Value #P": "最"忙"的磁盘 (利用率)",
"Value #Q": "总数据量最大的磁盘",
"Value #R": "TCP_连接数",
"Value #S": "TCP_TIME_WAIT",
"Value #T": "下载带宽",
"Value #U": "上传带宽",
"instance 1": "IP地址",
"job": "主机",
"machine": "硬件架构",
"nodename": "主机名",
"release": "内核版本",
"sysname": "操作系统"
}
}
}
],
"type": "table"
}
],
"schemaVersion": 27,
"style": "dark",
"tags": \[\],
"templating": {
"list": \[\]
},
"time": {
"from": "now-6h",
"to": "now"
},
"timepicker": {},
"timezone": "",
"title": "New dashboard Copy",
"uid": "pT2rBDeHk",
"version": 14
}