(1)头文件
#pragma once
#include <QtWidgets/QMainWindow>
#include "ui_QCustomplotDemo1.h"
#include "qcustomplot.h"
class QCustomplotDemo1 : public QMainWindow
{
Q_OBJECT
public:
QCustomplotDemo1(QWidget *parent = nullptr);
~QCustomplotDemo1();
private:
Ui::QCustomplotDemo1Class ui;
QCustomPlot* m_pCurve;
void initGraph(void);
};
(2)实现文件
#include "QCustomplotDemo1.h"
QCustomplotDemo1::QCustomplotDemo1(QWidget *parent)
: QMainWindow(parent)
{
ui.setupUi(this);
m_pCurve = new QCustomPlot;
setCentralWidget(m_pCurve);
initGraph();
}
QCustomplotDemo1::~QCustomplotDemo1()
{}
void QCustomplotDemo1::initGraph(void)
{
//背景色
// m_pCurve->setBackground(QBrush(QColor(0, 0, 0)));
m_pCurve->xAxis->setLabel("X");//x轴名称
m_pCurve->yAxis->setLabel("Y");//y轴名称
m_pCurve->xAxis->setLabelColor(QColor(0, 0, 0));//坐标轴名称的颜色
m_pCurve->yAxis->setLabelColor(QColor(0, 0, 0));
//坐标轴刻度标注的颜色
m_pCurve->xAxis->setTickLabelColor(QColor(0, 0, 0));
m_pCurve->yAxis->setTickLabelColor(QColor(0, 0, 0));
//坐标轴的颜色
QPen pen1 = m_pCurve->xAxis->basePen();
pen1.setColor(QColor(0, 0, 0));
m_pCurve->xAxis->setTickPen(pen1);
m_pCurve->xAxis->setBasePen(pen1);
m_pCurve->xAxis->setSubTickPen(pen1);
QPen pen2 = m_pCurve->yAxis->basePen();
pen2.setColor(QColor(255, 255, 255));
m_pCurve->yAxis->setTickPen(pen2);
m_pCurve->yAxis->setBasePen(pen2);
m_pCurve->yAxis->setSubTickPen(pen2);
m_pCurve->setInteractions(QCP::iRangeDrag | QCP::iRangeZoom);
QCPGraph* pGraph = m_pCurve->addGraph();//返回值就是m_pCurve->graph(0)
if (pGraph)
{
pGraph->setPen(QPen(QColor(255, 0, 0)));
}
}
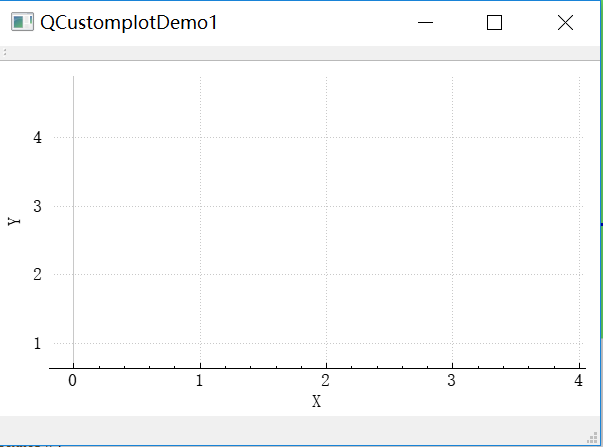
实现效果如下所示: