React+dhtmlx基础配置设置
前言
在现代企业生产管理系统中,甘特图是不可或缺的数据可视化工具,它能直观展示任务的时间安排、进度和依赖关系。本文将详细介绍如何在 React 项目中集成 dhtmlx-gantt 组件,实现功能丰富的生产排程甘特图。
环境介绍
本文采用 Vite + React + dhtmlx-gantt
javascript
# 安装 dhtmlx-gantt 及其样式
npm install dhtmlx-gantt
npm install dhtmlx-gantt/codebase/dhtmlxgantt.css
遇到npm安装报错时,可以尝试切换数据源或改用yarn进行安装。
基础甘特图实现
javascript
import React, { useRef, useEffect } from 'react';
import { gantt } from 'dhtmlx-gantt';
import 'dhtmlx-gantt/codebase/dhtmlxgantt.css';

const GanttChart = () => {
    const ganttContainer = useRef(null);

    useEffect(() => {
        if (ganttContainer.current) {
            // 列配置
            gantt.config.columns = [
                { name: "text", label: "任务名称", width: 200, tree: true },
                { name: "start_date", label: "开始时间", width: 100 },
                { name: "duration", label: "工期", width: 80 },
                { name: "progress", label: "进度", width: 80, template: gantt.templates.percent }
            ];

            // 初始化
            gantt.init(ganttContainer.current);

            // 加载数据
            const data = {
                data: [
                    { id: 1, text: "项目总计划", start_date: "2025-01-01", duration: 20, progress: 0.2 },
                    // parent指定父级数据 duration持续的天数  progress展示的百分比
                    { id: 2, text: "需求阶段", start_date: "2025-01-01", duration: 5, progress: 0.8, parent: 1 },
                    { id: 3, text: "设计阶段", start_date: "2025-01-06", duration: 6, progress: 0.4, parent: 1 },
                    { id: 4, text: "开发阶段", start_date: "2025-01-13", duration: 8, progress: 0.1, parent: 1 }
                ]
            };

            gantt.parse(data);
        }

        return () => {
            gantt.clearAll();
        };
    }, []);

    return (
        <div className="gantt-container">
            <div ref={ganttContainer} style={{ width: "100%", height: "400px" }}></div>
        </div>
    );
};

export default GanttChart;
简单的配置表格列和数据后,得到最初的效果
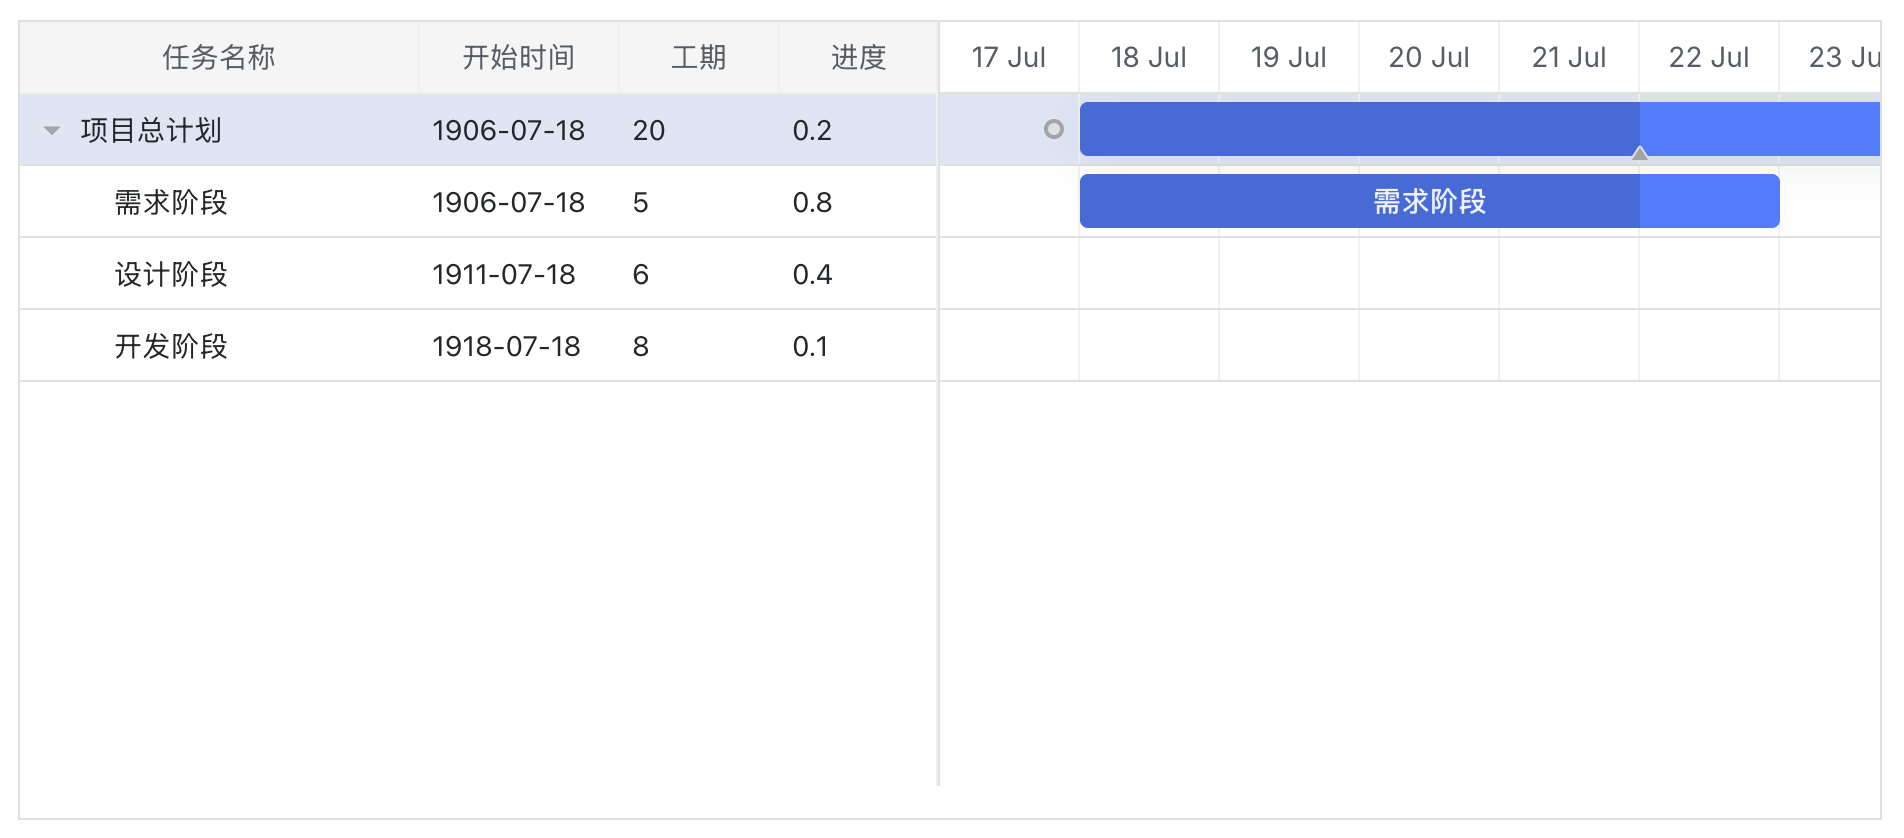
效果基本出来了,已经实现了树形数据的展示,以及点击表格行定位对应的甘特图的效果。
但是跟我预期的效果还有些差距。
需求完善
目前的问题
- 目前左右两个区域共享一个滚动条,只有右侧图表内容可以滚动。当表格项较多时,图表区域的显示空间会被大幅压缩。
- 时间线目前仅显示月份和日期,缺少年份信息。此外,月份默认仍采用英文格式显示。
- 在甘特图中,仅需显示色块部分,无需展示任务名称,同时不要显示进度百分比的颜色区分。
新增的需求
- 图表中需对周末列需要采用颜色区分
- 基于数据状态动态调整显示图表颜色
- 添加复选框实现可选并实现树形数据的上下级联动及全选/全不选功能
具体实现
自定义布局(左右分区)
javascript
// 实现左右均分布局,并实现左右区域横向各自独立滚动,共享垂直滚动条
gantt.config.layout = {
    css: "gantt_container",
    cols: [
        {
            min_width: 400, // 避免左侧表格过度收缩
            rows: [
                {
                    group: "gantt",
                    cols: [
                        {
                            rows: [
                                { view: 'grid', scrollX: 'gridScrollX', scrollable: true, scrollY: 'gridScrollY' },
                                { view: 'scrollbar', id: 'gridScrollX' }
                            ]
                        }
                    ]
                },
            ]
        },
        { resizer: true, width: 1 },
        {
            rows: [
                {
                    group: "gantt",
                    cols: [
                        {
                            rows: [
                                { view: "timeline", scrollX: "scrollHor", scrollY: "gridScrollY" },
                                { view: "scrollbar", id: "scrollHor" }
                            ]
                        }
                    ]
                },
            ]
        },
        { view: 'scrollbar', id: 'gridScrollY' }
    ]
};

// 启用弹性列
gantt.config.grid_elastic_columns = true;
日期线设置
javascript
gantt.config.date_format = "%Y-%m-%d";
// 日期分两行呈现: 上方显示年月 下方显示具体日期
gantt.config.scales = [
    { unit: "month", step: 1, format: "%Y年%F" },
    { unit: "day", step: 1, format: "%j日" }
];
// 优化月份与星期的本地化显示
gantt.locale = {
    date: {
        month_short: ["一月", "二月", "三月", "四月", "五月", "六月", "七月", "八月", "九月", "十月", "十一月", "十二月"],
        month_full: ["1月", "2月", "3月", "4月", "5月", "6月", "7月", "8月", "9月", "10月", "11月", "12月"],
        day_full: ["星期日", "星期一", "星期二", "星期三", "星期四", "星期五", "星期六"],
        day_short: ["日", "一", "二", "三", "四", "五", "六"]
    }
}

// 周末添加指定class
gantt.templates.timeline_cell_class = (task, date) => {
    if (date.getDay() === 0 || date.getDay() === 6) {
        return "weekend";
    }
    return "";
},
// 在css文件中添加高亮样式
.weekend {
    background-color: #f9f9f9 !important;
}
甘特图设置
javascript
// 任务名称显示为空
task_text: () => '',
// 区分数据状态,设置相应的class
task_class: (start, end, task) => {
switch(task.status) {
case "未派发":
return "wait-task";
case "已派发":
return "completed-task";
default:
return "";
}
}
// 在css文件中设置样式
.wait-task {
background-color: #ffa940 !important;
border-color: #ffa940 !important;
}
.completed-task {
background-color: #52c41a !important;
border-color: #52c41a !important;
}
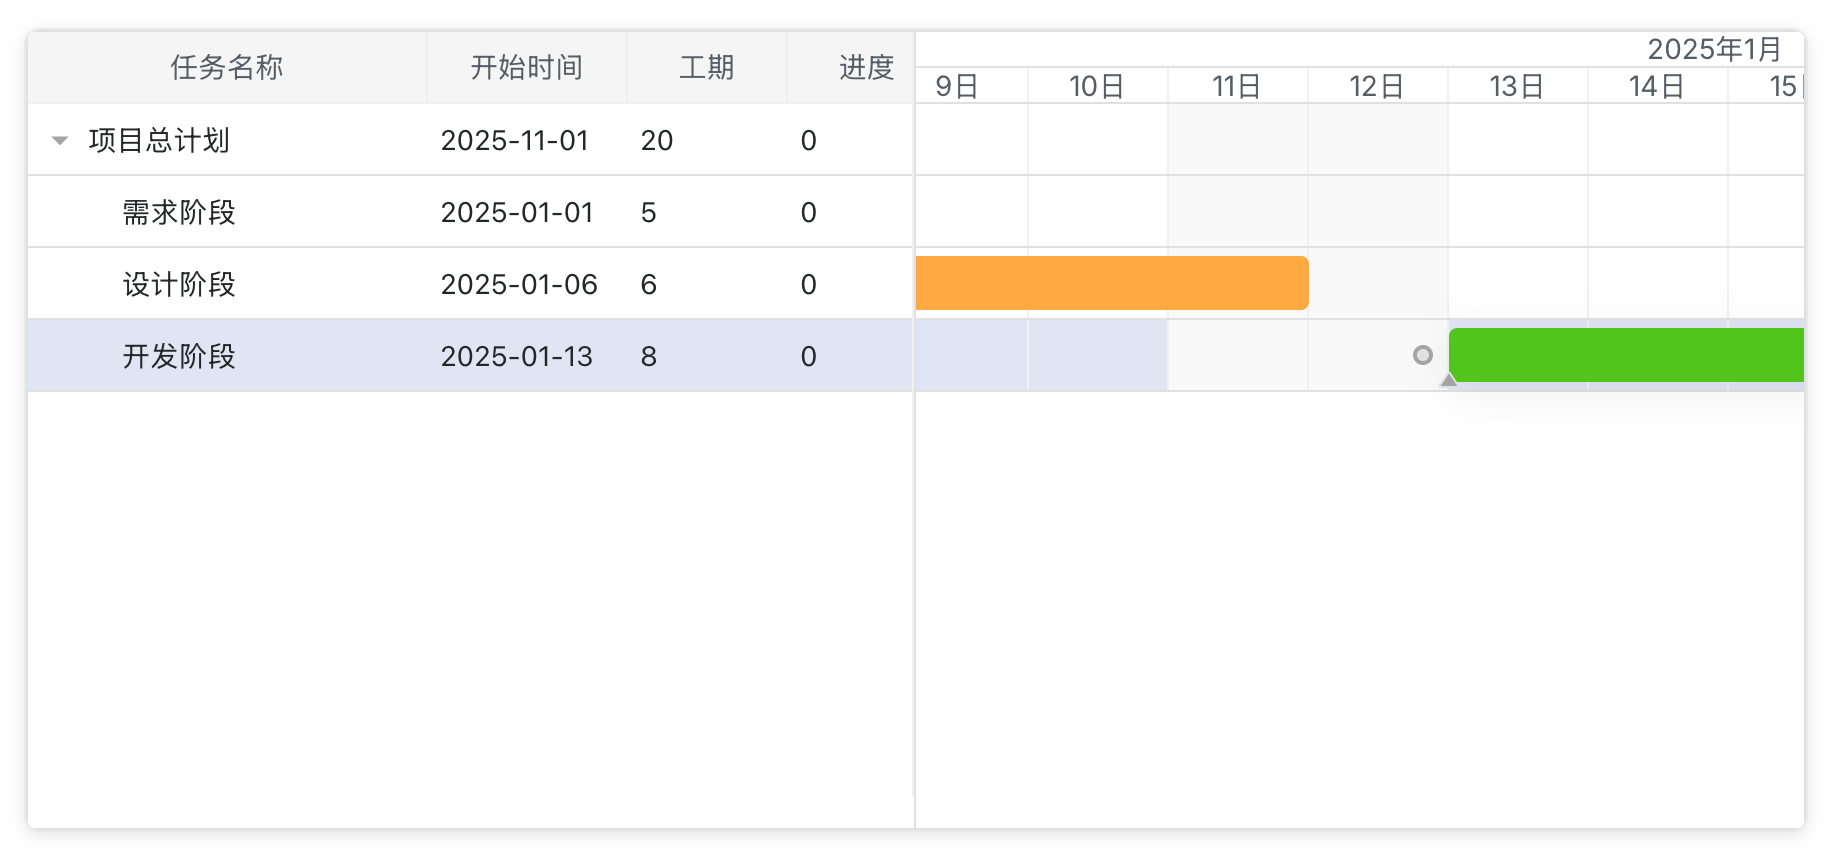
// 修改数据
// 1.通过status属性设置不同颜色样式
// 2.移除progress属性以隐藏百分比显示
const data = {
data: [
{ id: 1, text: "项目总计划", status: '未派发', start_date: "2025-11-01", duration: 20 },
{ id: 2, text: "需求阶段", status: '已派发', start_date: "2025-01-01", duration: 5, parent: 1 },
{ id: 3, text: "设计阶段", status: '未派发', start_date: "2025-01-06", duration: 6, parent: 1 },
{ id: 4, text: "开发阶段", status: '已派发', start_date: "2025-01-13", duration: 8, parent: 1 }
],
};结语
目前已经基本实现了预期效果。由于篇幅限制,复选框功能将在下次更新时介绍。如果不需要复选功能,希望本文内容可以帮到哪怕一位开发者。复选框的实现涉及dhtmlx-gantt与React的集成,主要包括事件处理和状态管理两部分内容,下一篇见!