前言
运动数据统计分析是帮助用户了解自身运动表现的重要功能。通过对历史数据的汇总、趋势分析和对比,用户可以清晰地看到自己的进步和需要改进的地方。本文将详细介绍如何在Flutter与OpenHarmony平台上实现运动数据统计分析组件,包括数据聚合、趋势计算、周期对比等功能模块的完整实现方案。
Flutter统计数据模型
dart
class WorkoutStatistics {
  final StatisticsPeriod period;
  final DateTime startDate;
  final DateTime endDate;
  final int totalWorkouts;
  final Duration totalDuration;
  final double totalDistance;
  final double totalCalories;
  final double avgHeartRate;
  final double avgPace;

  WorkoutStatistics({
    required this.period,
    required this.startDate,
    required this.endDate,
    required this.totalWorkouts,
    required this.totalDuration,
    required this.totalDistance,
    required this.totalCalories,
    required this.avgHeartRate,
    required this.avgPace,
  });

  double get avgDistancePerWorkout => totalWorkouts > 0 ? totalDistance / totalWorkouts : 0;
  Duration get avgDurationPerWorkout => totalWorkouts > 0
      ? Duration(seconds: totalDuration.inSeconds ~/ totalWorkouts)
      : Duration.zero;
}

enum StatisticsPeriod { day, week, month, year, custom }

class TrendData {
  final List<TrendPoint> points;
  final double changePercent;
  final TrendDirection direction;

  TrendData({required this.points, required this.changePercent, required this.direction});
}

class TrendPoint {
  final DateTime date;
  final double value;

  TrendPoint({required this.date, required this.value});
}

enum TrendDirection { up, down, stable }
统计数据模型定义了汇总数据和趋势的结构。WorkoutStatistics包含指定周期内的运动次数、总时长、总距离、总消耗和平均值。计算属性avgDistancePerWorkout和avgDurationPerWorkout提供每次运动的平均数据。TrendData记录趋势点列表、变化百分比和方向,用于展示数据走势。StatisticsPeriod支持日、周、月、年和自定义周期。
OpenHarmony数据聚合服务
typescript
import relationalStore from '@ohos.data.relationalStore';

class StatisticsAggregator {
  private rdbStore: relationalStore.RdbStore | null = null;

  async aggregateByPeriod(period: string, startDate: number, endDate: number): Promise<object> {
    if (!this.rdbStore) return this.getEmptyStats();

    let predicates = new relationalStore.RdbPredicates('workouts');
    predicates.between('timestamp', startDate, endDate);

    let resultSet = await this.rdbStore.query(predicates, [
      'COUNT(*) as count',
      'SUM(duration) as totalDuration',
      'SUM(distance) as totalDistance',
      'SUM(calories) as totalCalories',
      'AVG(avgHeartRate) as avgHeartRate',
    ]);

    let stats = this.getEmptyStats();
    if (resultSet.goToFirstRow()) {
      stats = {
        period: period,
        startDate: startDate,
        endDate: endDate,
        totalWorkouts: resultSet.getLong(resultSet.getColumnIndex('count')),
        totalDuration: resultSet.getLong(resultSet.getColumnIndex('totalDuration')),
        totalDistance: resultSet.getDouble(resultSet.getColumnIndex('totalDistance')),
        totalCalories: resultSet.getDouble(resultSet.getColumnIndex('totalCalories')),
        avgHeartRate: resultSet.getDouble(resultSet.getColumnIndex('avgHeartRate')),
      };
    }
    resultSet.close();

    return stats;
  }

  private getEmptyStats(): object {
    return {
      totalWorkouts: 0,
      totalDuration: 0,
      totalDistance: 0,
      totalCalories: 0,
      avgHeartRate: 0,
    };
  }
}
数据聚合服务从数据库查询并汇总运动数据。使用RdbPredicates的between方法筛选指定时间范围的记录,通过SQL聚合函数COUNT、SUM、AVG计算统计值。查询结果包含运动次数、总时长、总距离、总消耗和平均心率。这种数据库级别的聚合比在应用层遍历计算效率更高。
Flutter周期选择器组件
dart
class PeriodSelector extends StatelessWidget {
  final StatisticsPeriod selectedPeriod;
  final Function(StatisticsPeriod) onPeriodChanged;

  const PeriodSelector({
    Key? key,
    required this.selectedPeriod,
    required this.onPeriodChanged,
  }) : super(key: key);

  @override
  Widget build(BuildContext context) {
    return Container(
      padding: EdgeInsets.symmetric(vertical: 8),
      child: Row(
        mainAxisAlignment: MainAxisAlignment.spaceEvenly,
        children: StatisticsPeriod.values
            .where((p) => p != StatisticsPeriod.custom)
            .map((period) => _buildPeriodButton(period))
            .toList(),
      ),
    );
  }

  Widget _buildPeriodButton(StatisticsPeriod period) {
    bool isSelected = period == selectedPeriod;
    return GestureDetector(
      onTap: () => onPeriodChanged(period),
      child: Container(
        padding: EdgeInsets.symmetric(horizontal: 16, vertical: 8),
        decoration: BoxDecoration(
          color: isSelected ? Colors.blue : Colors.transparent,
          borderRadius: BorderRadius.circular(20),
          border: Border.all(color: isSelected ? Colors.blue : Colors.grey.shade300),
        ),
        child: Text(
          _getPeriodLabel(period),
          style: TextStyle(
            color: isSelected ? Colors.white : Colors.grey.shade600,
            fontWeight: isSelected ? FontWeight.bold : FontWeight.normal,
          ),
        ),
      ),
    );
  }

  String _getPeriodLabel(StatisticsPeriod period) {
    switch (period) {
      case StatisticsPeriod.day: return '日';
      case StatisticsPeriod.week: return '周';
      case StatisticsPeriod.month: return '月';
      case StatisticsPeriod.year: return '年';
      case StatisticsPeriod.custom: return '自定义';
    }
  }
}
周期选择器让用户切换统计时间范围。四个按钮分别代表日、周、月、年视图,选中状态使用蓝色填充背景。点击按钮触发onPeriodChanged回调,父组件根据新周期重新加载数据。这种分段控件设计简洁直观,用户可以快速切换不同时间维度查看数据。
OpenHarmony趋势计算服务
typescript
class TrendCalculator {
  calculateTrend(data: Array<object>, valueKey: string): object {
    if (data.length < 2) {
      return { points: data, changePercent: 0, direction: 'stable' };
    }

    let points = data.map(item => ({
      date: item['date'],
      value: item[valueKey] || 0,
    }));

    // 计算变化百分比
    let firstHalf = points.slice(0, Math.floor(points.length / 2));
    let secondHalf = points.slice(Math.floor(points.length / 2));

    let firstAvg = this.calculateAverage(firstHalf);
    let secondAvg = this.calculateAverage(secondHalf);

    let changePercent = firstAvg > 0 ? ((secondAvg - firstAvg) / firstAvg) * 100 : 0;

    let direction: string;
    if (changePercent > 5) direction = 'up';
    else if (changePercent < -5) direction = 'down';
    else direction = 'stable';

    return {
      points: points,
      changePercent: Math.round(changePercent * 10) / 10,
      direction: direction,
    };
  }

  private calculateAverage(points: Array<object>): number {
    if (points.length === 0) return 0;
    let sum = points.reduce((acc, p) => acc + (p['value'] as number), 0);
    return sum / points.length;
  }

  calculateMovingAverage(data: Array<object>, valueKey: string, window: number): Array<object> {
    let result: Array<object> = [];

    for (let i = 0; i < data.length; i++) {
      let start = Math.max(0, i - window + 1);
      let windowData = data.slice(start, i + 1);
      let avg = this.calculateAverage(windowData.map(d => ({ value: d[valueKey] })));

      result.push({
        date: data[i]['date'],
        value: avg,
        originalValue: data[i][valueKey],
      });
    }

    return result;
  }
}
趋势计算服务分析数据变化方向和幅度。calculateTrend方法将数据分为前后两半,比较平均值计算变化百分比。变化超过5%判定为上升或下降,否则为稳定。calculateMovingAverage计算移动平均,平滑数据波动便于观察长期趋势。这些计算帮助用户理解自己的运动表现是在进步还是退步。
Flutter统计卡片组件
dart
class StatisticsCard extends StatelessWidget {
  final String title;
  final String value;
  final String unit;
  final IconData icon;
  final TrendDirection? trend;
  final double? changePercent;

  const StatisticsCard({
    Key? key,
    required this.title,
    required this.value,
    required this.unit,
    required this.icon,
    this.trend,
    this.changePercent,
  }) : super(key: key);

  @override
  Widget build(BuildContext context) {
    return Card(
      elevation: 2,
      child: Padding(
        padding: EdgeInsets.all(16),
        child: Column(
          crossAxisAlignment: CrossAxisAlignment.start,
          children: [
            Row(
              children: [
                Icon(icon, size: 20, color: Colors.blue),
                SizedBox(width: 8),
                Text(title, style: TextStyle(color: Colors.grey.shade600, fontSize: 14)),
              ],
            ),
            SizedBox(height: 12),
            Row(
              crossAxisAlignment: CrossAxisAlignment.end,
              children: [
                Text(value, style: TextStyle(fontSize: 28, fontWeight: FontWeight.bold)),
                SizedBox(width: 4),
                Padding(
                  padding: EdgeInsets.only(bottom: 4),
                  child: Text(unit, style: TextStyle(color: Colors.grey, fontSize: 14)),
                ),
              ],
            ),
            if (trend != null && changePercent != null) ...[
              SizedBox(height: 8),
              _buildTrendIndicator(),
            ],
          ],
        ),
      ),
    );
  }

  Widget _buildTrendIndicator() {
    Color color;
    IconData trendIcon;

    switch (trend!) {
      case TrendDirection.up:
        color = Colors.green;
        trendIcon = Icons.trending_up;
        break;
      case TrendDirection.down:
        color = Colors.red;
        trendIcon = Icons.trending_down;
        break;
      case TrendDirection.stable:
        color = Colors.grey;
        trendIcon = Icons.trending_flat;
        break;
    }

    return Row(
      children: [
        Icon(trendIcon, size: 16, color: color),
        SizedBox(width: 4),
        Text(
          '${changePercent! >= 0 ? '+' : ''}${changePercent!.toStringAsFixed(1)}%',
          style: TextStyle(color: color, fontSize: 12),
        ),
      ],
    );
  }
}
统计卡片组件展示单项统计数据。顶部显示图标和标题,中间是大字号的数值和单位,底部可选显示趋势指示器。趋势使用颜色和箭头图标区分:绿色向上表示增长,红色向下表示下降,灰色水平表示稳定。这种卡片设计信息层次清晰,用户可以快速获取关键数据。
OpenHarmony周期对比服务
typescript
class PeriodComparisonService {
  async comparePeriods(
    aggregator: object,
    currentStart: number,
    currentEnd: number,
    previousStart: number,
    previousEnd: number
  ): Promise<object> {
    let current = await aggregator['aggregateByPeriod']('current', currentStart, currentEnd);
    let previous = await aggregator['aggregateByPeriod']('previous', previousStart, previousEnd);

    return {
      current: current,
      previous: previous,
      comparison: {
        workoutsChange: this.calculateChange(previous['totalWorkouts'], current['totalWorkouts']),
        distanceChange: this.calculateChange(previous['totalDistance'], current['totalDistance']),
        durationChange: this.calculateChange(previous['totalDuration'], current['totalDuration']),
        caloriesChange: this.calculateChange(previous['totalCalories'], current['totalCalories']),
      },
    };
  }

  private calculateChange(previous: number, current: number): object {
    if (previous === 0) {
      return { percent: current > 0 ? 100 : 0, direction: current > 0 ? 'up' : 'stable' };
    }

    let percent = ((current - previous) / previous) * 100;
    let direction: string;

    if (percent > 5) direction = 'up';
    else if (percent < -5) direction = 'down';
    else direction = 'stable';

    return {
      percent: Math.round(percent * 10) / 10,
      direction: direction,
      difference: current - previous,
    };
  }

  getPreviousPeriodRange(period: string, currentStart: number, currentEnd: number): object {
    let duration = currentEnd - currentStart;
    return {
      start: currentStart - duration,
      end: currentEnd - duration,
    };
  }
}
周期对比服务比较当前周期与上一周期的数据。comparePeriods方法分别查询两个周期的统计数据,然后计算各项指标的变化。calculateChange计算变化百分比和方向,同时返回绝对差值。getPreviousPeriodRange根据当前周期自动计算上一周期的时间范围。这种对比帮助用户了解自己的运动量是增加还是减少。
Flutter统计概览页面
dart
class StatisticsOverviewPage extends StatefulWidget {
@override
State<StatisticsOverviewPage> createState() => _StatisticsOverviewPageState();
}
class _StatisticsOverviewPageState extends State<StatisticsOverviewPage> {
StatisticsPeriod _selectedPeriod = StatisticsPeriod.week;
WorkoutStatistics? _statistics;
Map<String, TrendData>? _trends;
bool _isLoading = true;
@override
void initState() {
super.initState();
_loadStatistics();
}
Future<void> _loadStatistics() async {
setState(() => _isLoading = true);
// 加载统计数据
setState(() => _isLoading = false);
}
@override
Widget build(BuildContext context) {
return Scaffold(
appBar: AppBar(title: Text('运动统计')),
body: Column(
children: [
PeriodSelector(
selectedPeriod: _selectedPeriod,
onPeriodChanged: (period) {
setState(() => _selectedPeriod = period);
_loadStatistics();
},
),
Expanded(
child: _isLoading
? Center(child: CircularProgressIndicator())
: _buildStatisticsContent(),
),
],
),
);
}
Widget _buildStatisticsContent() {
if (_statistics == null) {
return Center(child: Text('暂无数据'));
}
return SingleChildScrollView(
padding: EdgeInsets.all(16),
child: Column(
children: [
Row(
children: [
Expanded(child: StatisticsCard(
title: '运动次数',
value: '${_statistics!.totalWorkouts}',
unit: '次',
icon: Icons.fitness_center,
trend: _trends?['workouts']?.direction,
changePercent: _trends?['workouts']?.changePercent,
)),
SizedBox(width: 12),
Expanded(child: StatisticsCard(
title: '总距离',
value: (_statistics!.totalDistance / 1000).toStringAsFixed(1),
unit: '公里',
icon: Icons.straighten,
trend: _trends?['distance']?.direction,
changePercent: _trends?['distance']?.changePercent,
)),
],
),
SizedBox(height: 12),
Row(
children: [
Expanded(child: StatisticsCard(
title: '总时长',
value: '${_statistics!.totalDuration.inHours}',
unit: '小时',
icon: Icons.timer,
)),
SizedBox(width: 12),
Expanded(child: StatisticsCard(
title: '消耗热量',
value: '${_statistics!.totalCalories.toInt()}',
unit: '千卡',
icon: Icons.local_fire_department,
)),
],
),
],
),
);
}
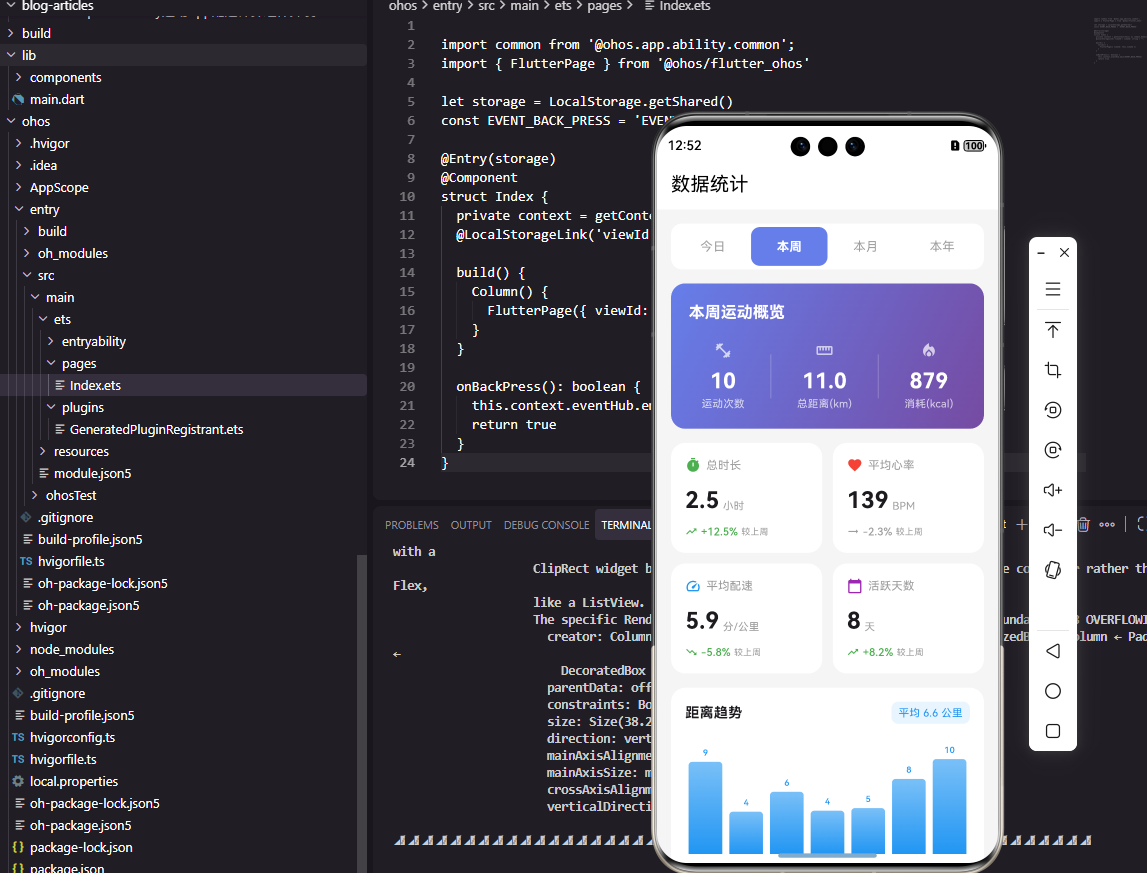
}统计概览页面整合所有统计组件。顶部是周期选择器,下方是统计卡片网格。使用两列布局展示运动次数、总距离、总时长和消耗热量四个核心指标。切换周期时显示加载指示器,数据加载完成后更新界面。这种布局让用户一目了然地看到关键统计数据。
OpenHarmony数据导出格式化
typescript
class StatisticsExporter {
  formatForExport(statistics: object, period: string): object {
    let startDate = new Date(statistics['startDate']);
    let endDate = new Date(statistics['endDate']);

    return {
      reportTitle: `运动统计报告 - ${this.getPeriodLabel(period)}`,
      dateRange: `${this.formatDate(startDate)} 至 ${this.formatDate(endDate)}`,
      summary: {
        totalWorkouts: `${statistics['totalWorkouts']} 次`,
        totalDistance: `${(statistics['totalDistance'] / 1000).toFixed(2)} 公里`,
        totalDuration: this.formatDuration(statistics['totalDuration']),
        totalCalories: `${Math.round(statistics['totalCalories'])} 千卡`,
        avgHeartRate: `${Math.round(statistics['avgHeartRate'])} BPM`,
      },
      averages: {
        avgDistancePerWorkout: `${(statistics['totalDistance'] / statistics['totalWorkouts'] / 1000).toFixed(2)} 公里/次`,
        avgDurationPerWorkout: this.formatDuration(statistics['totalDuration'] / statistics['totalWorkouts']),
        avgCaloriesPerWorkout: `${Math.round(statistics['totalCalories'] / statistics['totalWorkouts'])} 千卡/次`,
      },
      generatedAt: new Date().toISOString(),
    };
  }

  private getPeriodLabel(period: string): string {
    let labels = { day: '今日', week: '本周', month: '本月', year: '本年' };
    return labels[period] || period;
  }

  private formatDate(date: Date): string {
    return `${date.getFullYear()}年${date.getMonth() + 1}月${date.getDate()}日`;
  }

  private formatDuration(seconds: number): string {
    let hours = Math.floor(seconds / 3600);
    let minutes = Math.floor((seconds % 3600) / 60);
    return `${hours}小时${minutes}分钟`;
  }
}
统计导出服务将数据格式化为可读的报告格式。formatForExport方法生成包含标题、日期范围、汇总数据和平均值的结构化对象。数值转换为带单位的字符串,时长格式化为小时分钟形式。这种格式化数据可以直接用于生成PDF报告或分享到社交平台。
Flutter趋势图表组件
dart
class TrendChartWidget extends StatelessWidget {
  final TrendData trendData;
  final String title;
  final Color color;

  const TrendChartWidget({
    Key? key,
    required this.trendData,
    required this.title,
    this.color = Colors.blue,
  }) : super(key: key);

  @override
  Widget build(BuildContext context) {
    return Card(
      child: Padding(
        padding: EdgeInsets.all(16),
        child: Column(
          crossAxisAlignment: CrossAxisAlignment.start,
          children: [
            Row(
              mainAxisAlignment: MainAxisAlignment.spaceBetween,
              children: [
                Text(title, style: TextStyle(fontSize: 16, fontWeight: FontWeight.w500)),
                _buildChangeIndicator(),
              ],
            ),
            SizedBox(height: 16),
            SizedBox(
              height: 150,
              child: CustomPaint(
                size: Size.infinite,
                painter: TrendChartPainter(
                  points: trendData.points,
                  color: color,
                ),
              ),
            ),
          ],
        ),
      ),
    );
  }

  Widget _buildChangeIndicator() {
    Color indicatorColor = trendData.direction == TrendDirection.up
        ? Colors.green
        : trendData.direction == TrendDirection.down
            ? Colors.red
            : Colors.grey;

    return Container(
      padding: EdgeInsets.symmetric(horizontal: 8, vertical: 4),
      decoration: BoxDecoration(
        color: indicatorColor.withOpacity(0.1),
        borderRadius: BorderRadius.circular(12),
      ),
      child: Text(
        '${trendData.changePercent >= 0 ? '+' : ''}${trendData.changePercent}%',
        style: TextStyle(color: indicatorColor, fontWeight: FontWeight.bold),
      ),
    );
  }
}

class TrendChartPainter extends CustomPainter {
  final List<TrendPoint> points;
  final Color color;

  TrendChartPainter({required this.points, required this.color});

  @override
  void paint(Canvas canvas, Size size) {
    if (points.isEmpty) return;

    double maxValue = points.map((p) => p.value).reduce((a, b) => a > b ? a : b);
    double minValue = points.map((p) => p.value).reduce((a, b) => a < b ? a : b);
    double range = maxValue - minValue;
    if (range == 0) range = 1;

    Path path = Path();
    for (int i = 0; i < points.length; i++) {
      double x = i * size.width / (points.length - 1);
      double y = size.height - ((points[i].value - minValue) / range * size.height);

      if (i == 0) {
        path.moveTo(x, y);
      } else {
        path.lineTo(x, y);
      }
    }

    Paint linePaint = Paint()
      ..color = color
      ..strokeWidth = 2
      ..style = PaintingStyle.stroke;

    canvas.drawPath(path, linePaint);
  }

  @override
  bool shouldRepaint(covariant CustomPainter oldDelegate) => true;
}
趋势图表组件可视化展示数据变化趋势。顶部显示标题和变化百分比标签,下方是折线图。TrendChartPainter使用CustomPaint绘制折线,自动计算数值范围进行归一化。颜色可自定义,变化指示器根据趋势方向显示不同颜色。这种图表直观展示数据走势,帮助用户发现运动规律。
总结
本文全面介绍了Flutter与OpenHarmony平台上运动数据统计分析组件的实现方案。从数据聚合到趋势计算,从周期对比到图表展示,涵盖了统计分析功能的各个方面。通过这些统计工具,用户可以深入了解自己的运动表现,发现进步和不足,从而更科学地规划运动计划。
欢迎加入开源鸿蒙跨平台社区:https://openharmonycrossplatform.csdn.net