注:本文为 "Linux 内核调优" 相关合辑。
英文引文,机翻未校。
中文引文,略作重排。
如有内容异常,请看原文。
Linux Kernel Optimization
Linux 内核优化
Last Updated : 23 Jul, 2025
The Linux kernel is a part of the Linux operating system. It acts like a bridge between the software (applications) and the hardware (CPU, memory, storage). When you run a program, the Linux kernel decides how much CPU power it gets, how it accesses files, and how it communicates with other devices like keyboards and networks. It controls everything happening in the background to ensure the system runs smoothly.
Linux 内核是 Linux 操作系统的组成部分,充当软件(应用程序)与硬件(CPU、内存、存储设备)之间的桥梁。运行程序时,Linux 内核会分配其占用的 CPU 算力、制定其文件访问方式、协调其与键盘、网络等外设的通信过程。内核掌控着系统后台的所有操作,保障系统的平稳运行。
However, not all Linux systems are the same. A powerful server, an embedded system in a router, and a personal laptop all have different needs. This is where Linux kernel optimization comes in. Kernel optimization is the process of tweaking settings, removing unnecessary features, and improving performance to make the system faster, more stable, and more efficient.
但并非所有 Linux 系统的需求都完全相同,高性能服务器、路由器中的嵌入式系统、个人笔记本电脑的运行需求存在显著差异,Linux 内核优化的价值也正体现在此。内核优化是通过调整配置、移除无用功能、优化运行表现,让系统更快速、更稳定、更高效的过程。
This can involve adjusting memory management, scheduling tasks better, or even recompiling the kernel with only the required components.
该过程可包含调整内存管理策略、优化任务调度机制,甚至仅保留必要组件重新编译内核等操作。
Understanding the Linux Kernel Architecture
理解 Linux 内核架构
Before optimizing, it's crucial to understand how the Linux kernel functions:
开展优化操作前,理解 Linux 内核的工作机制至关重要:
-
Process Scheduler : They manage the CPU allocation task.
进程调度器:负责 CPU 算力的分配调度。 -
Memory Management : In memory management RAM allocation and swap space handles.
内存管理模块:负责随机存取存储器(RAM)的分配与交换空间的管理。 -
File System Management : They control the file access, storage, and I/O operations.
文件系统管理模块:管控文件的访问、存储过程,以及各类输入/输出(I/O)操作。 -
Networking Stack : In the network stack TCP/IP, UDP, and network device drivers are managed.
网络协议栈:管理传输控制协议/网际协议(TCP/IP)、用户数据报协议(UDP),以及各类网络设备驱动程序。 -
Device Drivers : They communicate between hardware and software.
设备驱动模块:实现硬件与软件之间的通信交互。 -
Security Modules : Implements SELinux, AppArmor, and other security features.
安全模块:实现安全增强型 Linux(SELinux)、应用程序装甲(AppArmor)等安全功能。
Command to check the Linux Kernel version:
查看 Linux 内核版本的命令:
uname -rChoosing the Right Linux Kernel Version
选择合适的 Linux 内核版本
Selecting the right kernel version is crucial for system performance, stability, and security because the Linux kernel is an integral part of the operating system. There are different kernel types for different purposes such as for servers, gaming, real-time use, and even for embedded systems.
Linux 内核作为操作系统的组成部分,选择合适的内核版本对系统的运行表现、稳定性和安全性至关重要。针对服务器、游戏、实时运算、嵌入式系统等不同使用场景,存在对应的内核版本类型。
Types of Linux Kernels
Linux 内核的类型
-
Stable Kernel (LTS -- Long-Term Support) -- These are the most suitable for Servers, enterprises, and production systems as they receive security updates and enjoy long term stability.
稳定版内核(LTS------长期支持版):适用于服务器、企业级系统和生产环境,该版本会持续接收安全更新,具备长期的稳定性。 -
Mainline Kernel -- This comes with the latest optimizations, hardware support, and improvements but may not be stable enough for production environments.
主线版内核:集成了最新的优化方案、硬件支持和功能改进,但稳定性未必能满足生产环境的要求。 -
Real-Time Kernel (PREEMPT_RT) -- This kernel type is best suited for low latency applications involving gaming, stock trading, and audio processing where speed is critical.
实时版内核(PREEMPT_RT------抢占式实时内核):适配对延迟要求低的应用场景,如游戏、股票交易、音频处理等对运行速度有严苛要求的场景。 -
Distribution-Specific Kernels -- These specialize in tasks that include, but are not limited to, gaming, audio processing, stock trading, and other tasks requiring low latency, making them extremely efficient.
发行版专属内核:针对特定任务做了专属优化,包括但不限于游戏、音频处理、股票交易等低延迟需求场景,运行效率表现优异。
If you want to check for existing versions of the kernel, use this command:
若需查看系统中已安装的内核版本,可使用以下命令:
Checking Available Kernel Versions: To check available Linux kernel versions for installation:
查看可安装的内核版本:查询系统中可安装的 Linux 内核版本:
bash
apt-cache search linux-imageTo install a newer Linux kernel (Example for Ubuntu/Debian): Upgrading can easily be achieved through this command.
安装新版 Linux 内核(适用于 Ubuntu/Debian 系统):通过以下命令可快速完成内核升级:
bash
sudo apt install linux-image-<version>How to Optimize Linux Kernel Performance
Linux 内核性能优化的方法
Linux kernel optimization is essential for improving system speed, responsiveness, and efficiency. Here is how you can adjust the Kernel:
Linux 内核优化是提升系统运行速度、响应能力和资源利用率的关键,以下为具体的内核调整方法:
1. Adjusting Kernel Scheduler
1. 调整内核调度器
The Completely Fair Scheduler (CFS) is the default scheduler, but BFQ (Budget Fair Queueing) and Deadline Scheduler are better for specific workloads.
完全公平调度器(CFS)是 Linux 系统的默认调度器,而预算公平队列调度器(BFQ)和截止时间调度器在特定工作负载下的表现更优。
Change CPU scheduler to performance mode use the below command:
通过以下命令将 CPU 调度器切换至性能模式:
bash
echo performance | sudo tee /sys/devices/system/cpu/cpu*/cpufreq/scaling_governor
Change CPU scheduler to performance mode
将 CPU 调度器切换至性能模式
2. Reducing Kernel Bloat (Disable Unused Modules)
2. 精简内核冗余(禁用未使用的内核模块)
Disabling unnecessary kernel modules can reduce memory usage and improve boot speed.
禁用无用的内核模块,可减少内存占用,提升系统启动速度。
List all loaded kernel modules:
列出所有已加载的内核模块:
bash
lsmod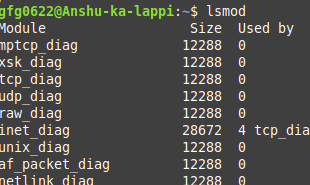
All loaded kernel modules
所有已加载的内核模块
To remove unused modules:
卸载未使用的内核模块:
bash
sudo modprobe -r <module_name>Blacklisting unwanted modules : Edit /etc/modprobe.d/blacklist.conf and add
将无用模块加入黑名单 :编辑配置文件 /etc/modprobe.d/blacklist.conf,并添加以下内容:
bash
blacklist <module_name>3. Optimizing the I/O Scheduler
3. 优化 I/O 调度器
Selecting the right I/O scheduler can improve the disk performance, especially on SSDs.
选择合适的 I/O 调度器能提升磁盘运行性能,在固态硬盘(SSD)上的优化效果尤为明显。
Check current I/O scheduler:
查看当前使用的 I/O 调度器:
bash
cat /sys/block/sda/queue/schedulerSet the best scheduler for SSDs:
为固态硬盘配置最优的 I/O 调度器:
bash
echo "none" | sudo tee /sys/block/sda/queue/scheduler4. Tweaking Network Performance
4. 优化网络性能
Modifying network buffer sizes and enabling TCP Fast Open can speed up connections and reduce latency.
调整网络缓冲区大小、开启 TCP 快速打开功能,能提升连接建立速度,降低网络延迟。
Increase network buffers :
增大网络缓冲区:
bash
sudo sysctl -w net.core.rmem_max=16777216
sudo sysctl -w net.core.wmem_max=16777216
Modifies a kernel parameter related to network receive buffer sizes
修改与网络接收缓冲区相关的内核参数
Enable TCP Fast Open:
开启 TCP 快速打开功能:
bash
sudo sysctl -w net.ipv4.tcp_fastopen=3Apply changes permanently: Edit /etc/sysctl.conf
让配置修改永久生效 :编辑配置文件 /etc/sysctl.conf,添加以下内容:
bash
net.ipv4.tcp_fastopen = 3
sudo sysctl -p
Compiling a Custom Linux Kernel for Maximum Performance
编译自定义 Linux 内核以实现性能最大化
Linux Kernel Optimization can be achieved by compiling a custom kernel tailored for your system. This allows fine-tuning of CPU scheduling, disabling unnecessary features, and optimizing performance for specific workloads such as gaming, real-time processing, or high-performance computing.
为系统编译定制化的内核,是实现 Linux 内核深度优化的方式。通过该方式可精细调整 CPU 调度策略、禁用无用功能,并针对游戏、实时处理、高性能计算等特定工作负载做专属的性能优化。
1. Install Required Packages
1. 安装必要的软件包
Before compiling a custom Linux kernel, install the necessary dependencies, these packages provide tools like compiler, linker, and menu configuration utilities.
编译自定义 Linux 内核前,需先安装相关依赖包,这些包包含编译器、链接器、菜单配置工具等编译所需的工具。
bash
sudo apt install build-essential libncurses-dev bc flex bison libssl-dev2. Download Kernel Source Code
2. 下载内核源码
Fetch the latest stable kernel version directly from kernel.org:
从 kernel.org 官网直接获取最新的稳定版内核源码:
bash
wget https://cdn.kernel.org/pub/linux/kernel/v6.x/linux-6.1.tar.xz
tar -xvf linux-6.1.tar.xz
cd linux-6.1
3. Configure the Kernel
3. 配置内核参数
Customize the kernel for your hardware and workload:
根据自身的硬件配置和业务负载定制内核参数:
bash
make menuconfig-
They enable the only required drivers
仅启用硬件所需的驱动程序
-
Disable all unnecessary debugging options
禁用所有无用的调试选项
-
They also optimize the CPU architecture settings
针对所用的 CPU 架构做专属优化配置
4. Compile and Install the Kernel
4. 编译并安装内核
Use multiple CPU cores to speed up compilation. Compiling a lightweight kernel minimizes latency, improves system efficiency, and enhances real-time processing capabilities.
利用多个 CPU 核心并行编译以提升编译速度。编译生成的轻量级内核能最大限度降低延迟、提升系统效率,增强实时处理能力。
bash
make -j$(nproc)
sudo make modules_install
sudo make install
5. Update Bootloader and Reboot
5. 更新启动引导程序并重启系统
After installation, update GRUB (bootloader) and reboot:
内核安装完成后,更新 GRUB 启动引导程序并重启系统:
bash
sudo update-grub
sudo reboot
Monitoring and Maintaining Kernel Performance
内核性能的监控与维护
Linux Kernel Optimization isn't just about tweaking settings---it requires continuous monitoring to ensure performance improvements are effective. Regular system analysis helps detect bottlenecks, manage resources efficiently, and fine-tune kernel parameters for maximum speed and stability.
Linux 内核优化并非仅通过一次配置调整即可完成,还需要持续的性能监控,以确保优化操作达到预期效果。通过定期对系统做性能分析,能及时发现性能瓶颈、高效管理系统资源,并进一步微调内核参数,实现系统速度与稳定性的最大化。
1. Check CPU usage:
1. 查看 CPU 使用率
Monitor real-time CPU performance to identify system load and kernel scheduler efficiency. It helps detect high CPU usage processes and optimizes CPU scheduling policies.
实时监控 CPU 运行性能,可掌握系统负载情况和内核调度器的工作效率,助力定位高 CPU 占用的进程,进而优化 CPU 调度策略。
bash
top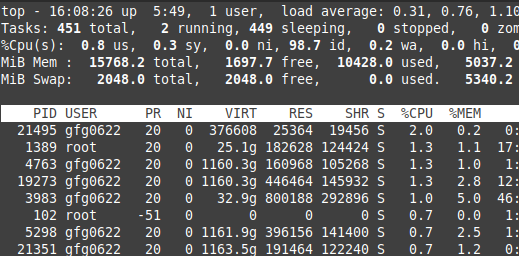
Top command
top 命令运行界面
2. Analyze kernel logs
2. 分析内核日志
Review kernel logs to identify errors, warnings, or bottlenecks affecting system performance. It is useful for debugging kernel modules, boot issues, and memory allocation problems.
查看内核日志,可定位影响系统性能的错误、警告信息及性能瓶颈,对调试内核模块、排查系统启动问题和内存分配故障具有重要作用。
bash
journalctl -k3. Test disk performance
3. 测试磁盘性能
Evaluate I/O speed to determine if disk optimizations and I/O scheduler tweaks are effective. It also measures the disk read/write speed.
测试磁盘的 I/O 速度,可验证磁盘优化和 I/O 调度器调整的效果,同时能精准测量磁盘的读写速度。
bash
sudo hdparm -Tt /dev/sda4. Check network performance
4. 测试网络性能
Optimize TCP/IP stack and kernel networking parameters by testing network speed. It also measures latency, bandwidth, and packet loss.
通过网络速度测试,可进一步优化 TCP/IP 协议栈和内核网络参数,同时能测量网络的延迟、带宽和丢包率。
bash
iperf -c <server_ip>Why Linux Kernel Optimization is required?
为何需要进行 Linux 内核优化?
-
Enhanced System Performance -- Decreased CPU overhead, Improvised Scheduling.
提升系统运行表现:降低 CPU 开销,优化任务调度机制。 -
Faster Boot Times -- Eliminating unnecessary kernel modules.
加快系统启动速度:移除无用的内核模块。 -
Reduced Latency -- Perfect for real-time applications such as gaming, VoIP, and stock trading.
降低系统延迟:适配游戏、网络电话(VoIP)、股票交易等实时应用场景。
-
Better Resource Allocation -- CPU, RAM, and storage usage are optimized.
优化资源分配:提升 CPU、内存、存储设备的资源利用率。 -
Improved Security -- Attackers can be defended against when the kernel is hardened.
增强系统安全性:通过内核加固,抵御外部攻击者的恶意攻击。 -
Lower Power Consumption -- A must-have for servers, embedded devices, and laptops.
降低功耗:是服务器、嵌入式设备、笔记本电脑的刚需优化方向。
Conclusion
总结
Linux Kernel Optimization is essential for achieving maximum system performance, faster boot times, low latency, and improved resource management. Whether you're optimizing for servers, gaming, real-time applications, or embedded devices, fine-tuning the Linux kernel parameters, I/O schedulers, CPU scheduling, and networking stack can dramatically enhance system efficiency.
Linux 内核优化是实现系统性能最大化、启动速度提升、延迟降低和资源管理优化的关键。无论针对服务器、游戏、实时应用还是嵌入式设备做优化,微调 Linux 内核参数、I/O 调度器、CPU 调度策略和网络协议栈,都能大幅提升系统的运行效率。
By selecting the right Linux kernel version, configuring system settings, and even compiling a custom Linux kernel, users can achieve greater stability, security, and performance.
通过选择合适的 Linux 内核版本、调整系统配置,甚至编译自定义的 Linux 内核,使用者能够让系统获得更优的稳定性、安全性和运行表现。
Tune Up: Optimizing Linux Performance
性能调优:优化 Linux 性能
Published on September 30, 2025
By Marcin Gastol
Microsoft MVP
In the modern landscape of IT environments, Linux is the cornerstone of enterprise infrastructure. Whether it is hosting critical cloud applications, driving big data analysis, or managing network-intensive workloads, Linux serves as the platform of choice due to its flexibility, performance, and open source nature. However, the out-of-the-box configuration of Linux, particularly at the kernel level, might not be optimized for high-performance requirements. To fully exploit Linux's capabilities, system administrators must delve into kernel tuning -- the process of adjusting key kernel parameters to align with specific performance goals. This article describes some of the tools and techniques the experts use to achieve better performance for their Linux systems.
在现代信息技术环境中,Linux 是企业基础设施的基石。无论是部署云应用、驱动大数据分析,还是管理网络密集型工作负载,Linux 凭借其灵活性、运行表现与开源特性,成为首选平台。但 Linux 的默认配置,尤其是内核层面的配置,未必能适配高性能需求。要充分发挥 Linux 的能力,系统管理员必须深入研究内核调优------即调整内核参数以匹配特定性能目标的过程。本文将介绍业内专家为提升 Linux 系统运行表现所使用的部分工具与方法。
Key Takeaways
要点总结
-
Performance profiling tools (
perf,ftrace,bpftrace) provide comprehensive system analysis capabilities, from high-level CPU metrics to deep kernel function tracing and custom memory allocation monitoring
性能分析工具 (perf、ftrace、bpftrace)可提供全面的系统分析能力,覆盖从高层级 CPU 指标分析到深层级内核函数追踪、自定义内存分配监控的全维度场景 -
TCP/IP optimization through kernel parameter tuning (
tcp_max_syn_backlog,tcp_rmem,tcp_wmem) significantly improves network performance for high-concurrency and high-bandwidth applications
TCP/IP 协议优化 通过内核参数调优(tcp_max_syn_backlog、tcp_rmem、tcp_wmem),能显著提升高并发、高带宽应用的网络运行表现 -
Advanced congestion control algorithms like BBR reduce network latency by controlling congestion windows based on bandwidth and RTT rather than packet loss
高级拥塞控制算法如 BBR,通过基于带宽和往返时延而非丢包率控制拥塞窗口,降低网络延迟 -
NUMA-aware tuning optimizes performance in multi-socket systems by aligning network interfaces, memory, and CPU cores to minimize cross-node access delays
支持NUMA架构的调优通过将网络接口、内存与 CPU 核心做亲和性匹配,减少跨节点访问延迟,实现多插槽系统的性能优化 -
Memory management optimization through tools like valgrind and bpftrace helps identify memory leaks, fragmentation, and inefficient allocation patterns
内存管理优化借助valgrind、bpftrace等工具,可定位内存泄漏、内存碎片与低效的内存分配模式 -
I/O performance tuning using iostat and scheduler optimization prevents disk bottlenecks and improves overall system responsiveness
I/O 性能调优 通过iostat工具与调度器优化,能规避磁盘瓶颈,提升系统整体响应速度 -
Kernel parameter persistence through
/etc/sysctl.confensures performance optimizations survive system reboots and maintain consistent performance
内核参数持久化 通过/etc/sysctl.conf配置文件实现,确保性能优化配置在系统重启后依然生效,维持运行表现的一致性
Profile and Benchmarking
性能分析与基准测试
In a world where Linux servers power everything from cloud environments to critical production systems, understanding how to fine-tune performance is essential. Whether you're managing high-throughput web servers, data-heavy applications, or low-latency systems, knowing how to profile, benchmark, and interpret performance data is a crucial skill. Understanding the intricacies of Linux kernel performance requires precise and advanced tools. In this case, I'll focus on three essential utilities: perf, ftrace, and bpftrace. Each tool serves a specific purpose and will help capture key data, from high-level performance metrics to deep kernel tracing.
如今 Linux 服务器支撑着从云环境到生产系统的各类业务,掌握性能精调的方法至关重要。无论是管理高吞吐的 Web 服务器、数据密集型应用,还是低延迟系统,掌握性能分析、基准测试与运行数据解读的方法都是一项必备技能。要理解 Linux 内核性能的复杂细节,需要借助精准且专业的工具。本文将重点介绍三款工具:perf、ftrace 与 bpftrace。每款工具都有其专属用途,可助力采集各类关键数据,从高层级的性能指标到深层级的内核追踪数据均能覆盖。
Profiling CPU, Memory, and I/O
CPU、内存与I/O 性能分析
perf is the Swiss Army knife of Linux performance tools. Designed for developers and sysadmins alike, perf provides detailed statistics for understanding CPU usage, memory allocation, I/O, and much more. By tapping into kernel counters, perf reveals which parts of your system are under the most strain.
perf 是 Linux 性能工具中的多功能工具,适用于开发人员与系统管理员,可提供用于分析 CPU 使用率、内存分配、I/O 操作等场景的详细统计数据。通过调用内核计数器,perf 能定位系统中负载最高的模块。
I'll start with an example. Suppose you're noticing system slowdowns and suspect a CPU bottleneck. The following command will allow you to quickly capture and analyze CPU data:
举一个简单的例子,若你发现系统运行变慢,且怀疑存在CPU 瓶颈,可通过以下命令快速采集并分析 CPU 相关数据:
bash
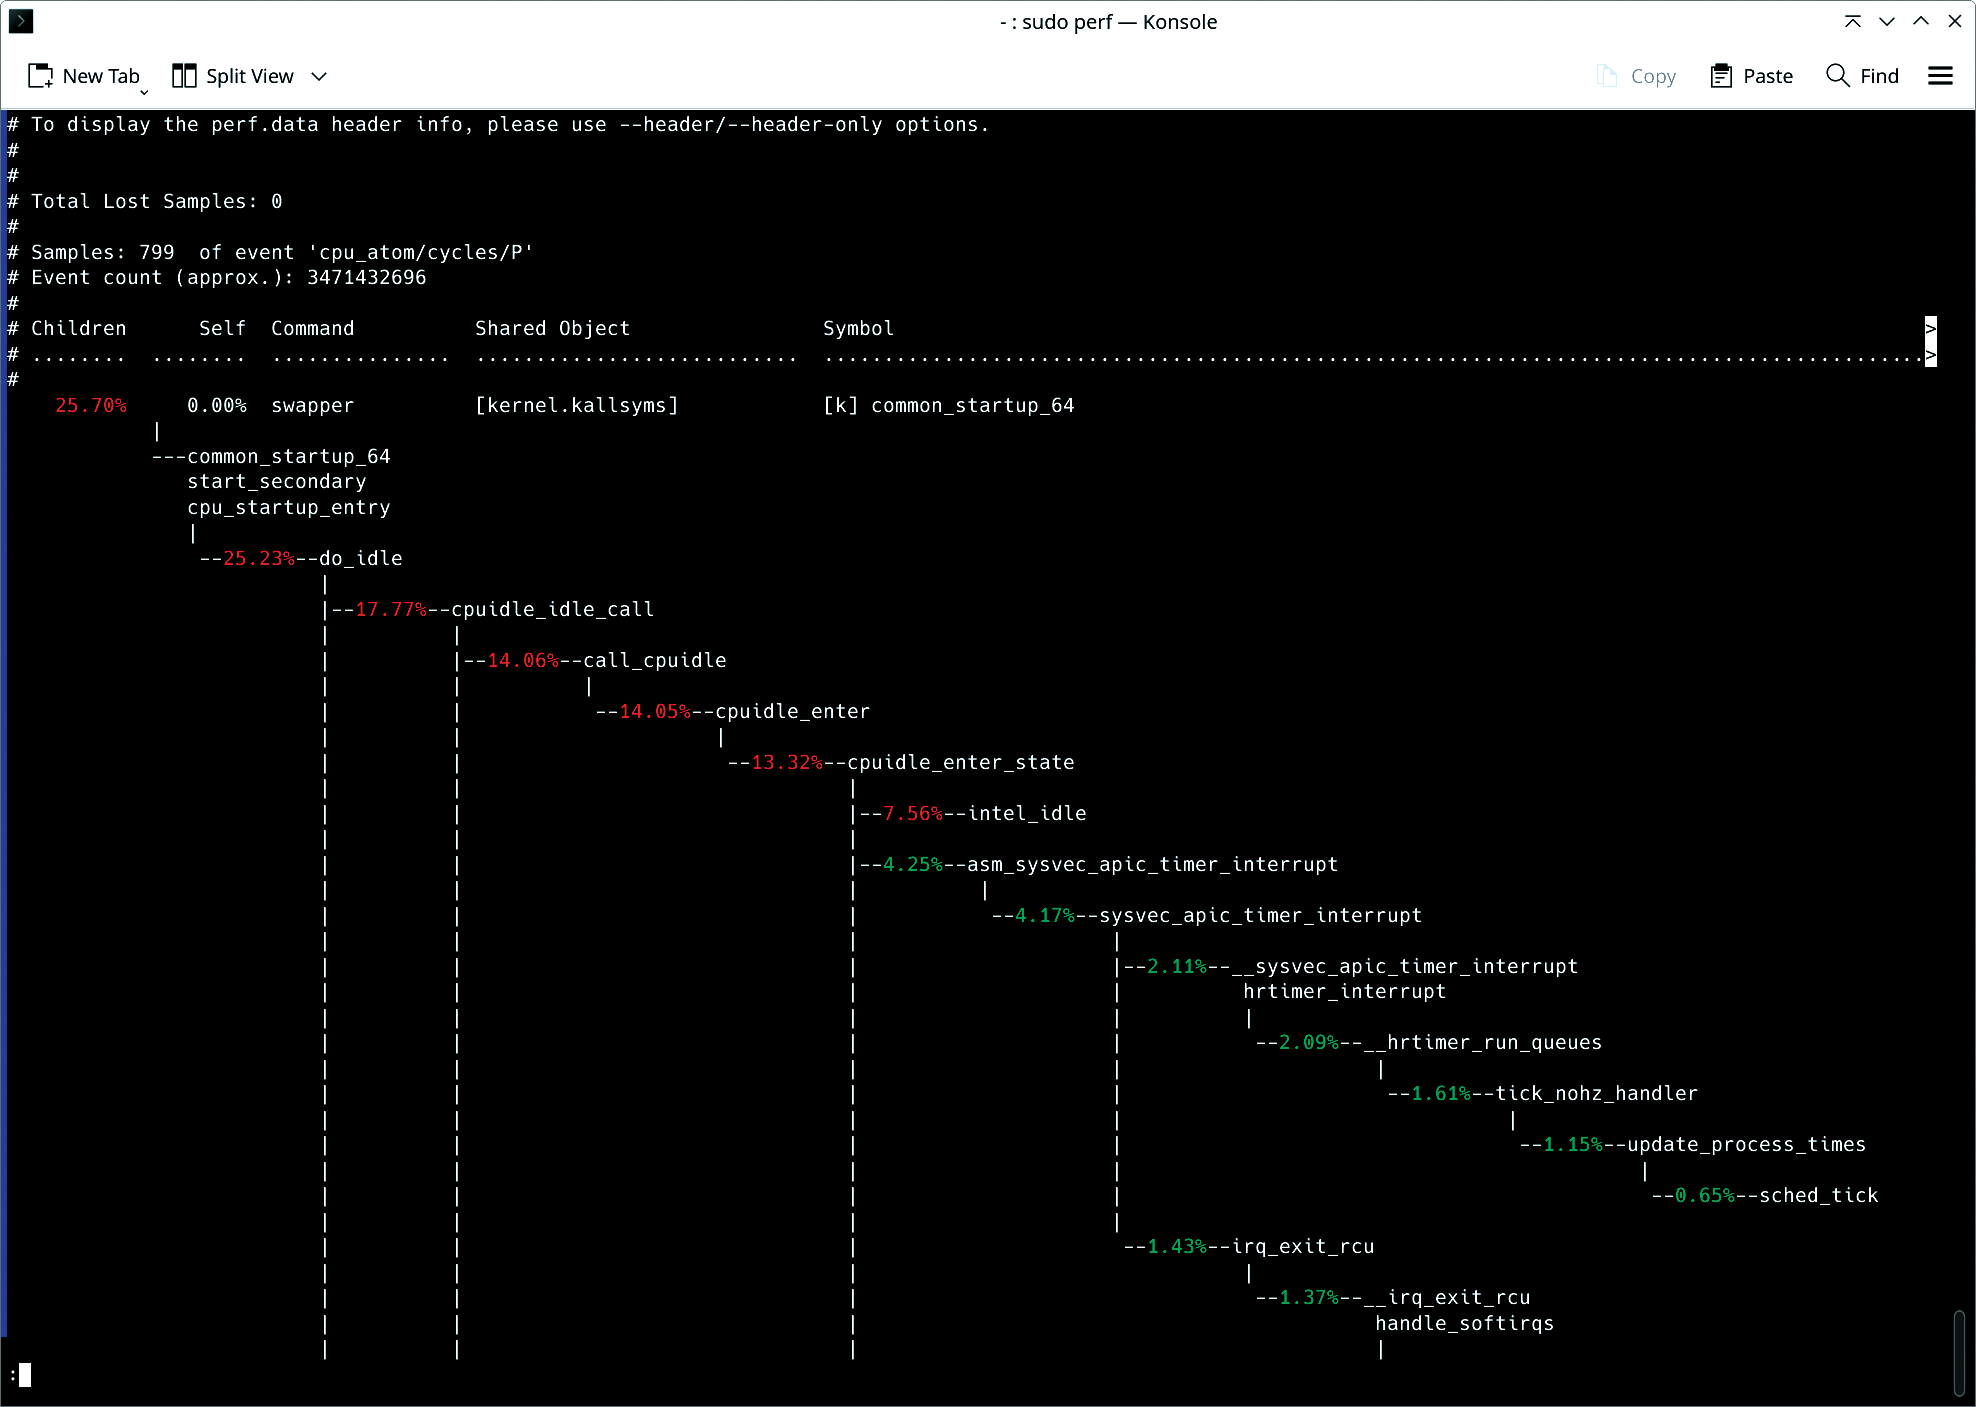
sudo perf record -F 99 -a --call-graph dwarf sleep 30This command tells perf to sample the system at a frequency of 99 Hz (-F 99), profiling all CPUs (-a) for 30 seconds. The --call-graph dwarf flag enables capturing function call traces, helping you identify the hottest paths in the application's execution.
该命令让 perf 以 99 赫兹的频率对系统进行采样(-F 99),对所有 CPU 开展 30 秒的性能分析(-a)。--call-graph dwarf 参数可开启函数调用追踪功能,助力定位应用执行过程中的热点路径。
Once the data is recorded, you can analyze it with:
数据采集完成后,可通过以下命令进行分析:
bash
sudo perf report --stdioThe report gives a visual of where CPU cycles are spent. For advanced users, the flamegraph-style call graph will expose deep insights into function-level execution, showing exactly where time is spent in code. This is especially useful for identifying functions that are unnecessarily consuming CPU cycles, enabling developers to optimize hot paths and reduce system load.
生成的报告将直观展示 CPU 时钟周期的消耗分布。对于专业使用者而言,火焰图样式的调用图能深入解析函数级的执行过程,精准定位代码中的耗时环节。这一功能在定位无意义消耗 CPU 时钟周期的函数时尤为实用,可帮助开发人员优化热点路径,降低系统负载。
As an additional example, suppose you're managing a high-traffic web application and suspect that some of your services are not handling CPU resources efficiently. Using perf, you can profile the system to capture key metrics such as instruction counts, cache misses, and branch mispredictions:
再举一个例子,若你管理着一个高流量的 Web 应用,且怀疑部分服务对 CPU 资源的利用效率低下,可通过 perf 对系统做性能分析,采集指令数、缓存未命中次数、分支预测失败次数等指标:
bash
sudo perf stat -e cycles,instructions,cache-misses,branches,branch-misses ./web_serviceThis command profiles the web_service executable, capturing low-level CPU events such as:
该命令会对 web_service 可执行文件做性能分析,采集以下底层 CPU 事件数据:
cycles: total number of CPU cycles spent
cycles:消耗的 CPU 时钟周期总数instructions: total instructions executed
instructions:执行的指令总数cache-misses: number of cache misses during execution
cache-misses:执行过程中的缓存未命中次数
The ratio of cycles to instructions can indicate whether your application is CPU-bound (high cycles per instruction) or suffers from inefficiencies like cache misses. This information is especially important in cloud environments, where maximizing resource efficiency translates directly to cost savings.
时钟周期与指令数的比值,可判断应用是否受 CPU 资源限制(每指令时钟周期数偏高),或是否存在缓存未命中这类低效问题。该信息在云环境中尤为重要,资源利用率的最大化可直接转化为成本的节约。
If perf reveals high instruction counts and significant cache misses, you might need to optimize your application's code paths. Reducing the number of instructions executed per cycle can significantly reduce CPU load, especially in CPU-bound workloads such as data-processing pipelines.
若 perf 分析结果显示指令数偏高且缓存未命中情况严重,你需要对应用的代码路径进行优化。减少每个时钟周期内执行的指令数,能显著降低 CPU 负载,在数据处理流水线这类受 CPU 资源限制的工作负载中,效果尤为明显。
Kernel Function Tracing for Low-Level Analysis
基于内核函数追踪的底层分析
Although perf excels at providing a high-level overview, sometimes you need to dive deeper into kernel functions. ftrace gives you this low-level control, allowing you to trace and measure the execution of specific kernel functions.
perf 虽擅长提供高层级的性能概览,但在部分场景下,需要对内核函数进行更深入的探究。ftrace 可实现这类底层控制,支持对特定内核函数的执行过程进行追踪与耗时统计。
Suppose you're troubleshooting an application that's experiencing high latency during disk writes. By tracing the kernel's sys_enter_write function, you can observe exactly when the write system call occurs, how long it takes, and whether any unexpected delays are occurring:
若你正在排查一个磁盘写入延迟过高的应用,可通过追踪内核的 sys_enter_write 函数,精准观察写系统调用的触发时间、执行耗时,以及是否出现非预期的延迟:
bash
echo function > /sys/kernel/debug/tracing/current_trace
echo sys_enter_write > /sys/kernel/debug/tracing/set_ftrace_filter
cat /sys/kernel/debug/tracing/trace_pipe
This setup instructs ftrace to trace the sys_enter_write function, which handles write operations at the kernel level. By examining the output in trace_pipe, you can watch each call in real time. This approach provides critical insights into potential disk I/O delays, such as high disk latency or contention issues.
该配置将让 ftrace 追踪负责内核层写操作处理的 sys_enter_write 函数。通过查看 trace_pipe 中的输出内容,可实时监控该函数的每一次调用。这一方法能深入解析磁盘 I/O 延迟的潜在成因,如磁盘本身延迟过高、资源竞争等问题。
Combining ftrace with user-space applications allows for a full-stack performance analysis, bridging the gap between application behavior and kernel performance.
将 ftrace 与用户空间应用结合使用,可实现全栈性能分析,打通应用行为与内核运行表现之间的分析壁垒。
Programmable Tracing for Custom Metrics
基于可编程追踪的自定义指标采集
When default tools aren't enough, bpftrace shines. Built on the Berkeley Packet Filter (BPF) framework, bptrace enables customizable, programmable tracing scenarios. If you're looking to go beyond the limitations of perf or ftrace, bpftrace offers powerful ways to trace kernel and user-space programs in real time.
当默认工具无法满足需求时,bpftrace 便能发挥其优势。该工具基于伯克利包过滤(BPF)框架开发,支持自定义的可编程追踪场景。若你希望突破 perf 与 ftrace 的功能限制,bpftrace 可提供强大的实时追踪能力,覆盖内核与用户空间程序。
In my case, I need to trace all memory allocations across the system, especially in a cloud environment with dynamic workloads. With bpftrace, I can create custom scripts that track every kmalloc (kernel memory allocation) event.
在实际场景中,若需要追踪系统中所有的内存分配操作,尤其是在工作负载动态变化的云环境中,可通过 bpftrace 编写自定义脚本,对每一次内核内存分配(kmalloc)事件进行追踪。
bash
sudo bpftrace -e 'tracepoint:kmem:kmalloc { printf("Allocated %d bytes\n", args->bytes_alloc); }'This command uses a tracepoint to track every kernel memory allocation (kmalloc), printing out the number of bytes allocated each time. This helps diagnose memory management issues, such as memory leaks or fragmentation problems in high-performance systems. It is especially useful when working with systems that deal with unpredictable memory usage, like database servers or cloud-hosted applications. You can further customize bpftrace scripts to capture only allocations over a certain size or to combine multiple tracepoints into a single performance report. This flexibility provides unparalleled visibility into your system's memory management, enabling highly targeted optimizations.
该命令通过追踪点监控每一次内核内存分配(kmalloc)操作,并打印每次分配的字节数。这一功能可助力诊断高性能系统中的内存管理问题,如内存泄漏、内存碎片等。在数据库服务器、云托管应用这类内存使用模式不可预测的系统中,该工具的实用性尤为突出。你还可对 bpftrace 脚本做进一步定制,例如仅采集指定大小以上的内存分配事件,或整合多个追踪点的数据生成单一性能报告。这种灵活性能让你对系统的内存管理状态实现全方位的监控,从而开展针对性极强的优化操作。
Memory Profiling
内存性能分析
Memory profiling helps you track how an application allocates and manages memory. This information is crucial in environments where memory is limited. If your system runs into ``Out of Memory'' (OOM) errors, identifying and fixing memory leaks or inefficient usage becomes a top priority. You can profile a memory-intensive application with massif, which is part of the valgrind suite:
内存性能分析可助力追踪应用的内存分配与管理方式,该信息在内存资源受限的环境中至关重要。若系统出现内存不足(OOM)错误,定位并修复内存泄漏、低效的内存使用问题将成为首要工作。可通过 valgrind 工具集下的 massif 组件,对内存密集型应用开展性能分析:
bash
valgrind --tool=massif --time-unit=B ./memory_hungry_appmassif tracks memory allocation over time. By setting the time unit to bytes (--time-unit=B), you get precise measurements for how much memory is allocated and when peaks occur.
massif 可追踪内存分配的时间变化过程,将时间单位设置为字节(--time-unit=B)后,能精准统计内存分配的总量与峰值出现的时间。
To visualize the results use:
可通过以下命令可视化分析结果:
bash
ms_print massif.out.<pid>This output reveals which functions are allocating the most memory, allowing you to optimize or rework memory-heavy code sections. In cloud environments, this kind of analysis is essential to prevent applications from over-consuming memory, which can lead to crashes or degraded performance under heavy load.
该命令的输出结果将展示内存分配量最大的函数,助力你对内存消耗较高的代码段进行优化或重构。在云环境中,这类分析是防止应用过度消耗内存的关键,内存过度消耗可能导致应用在高负载下崩溃或运行表现下降。
Excessive memory allocation, frequent paging, or out-of-memory (OOM) errors can often be traced back to inefficient memory management. By using tools such as bpftrace and valgrind, you can track down the exact points where memory issues occur. Once the problems are identified, optimizations might include increasing physical memory, adjusting vm.swappiness (to reduce swapping), or optimizing application memory allocation patterns.
内存分配过量、页面置换频繁、内存不足(OOM)错误等问题,其根源往往是低效的内存管理。借助 bpftrace、valgrind 等工具,可精准定位内存问题的发生节点。问题定位后,可采取的优化措施包括增加物理内存、调整 vm.swappiness 参数(减少页面置换)、优化应用的内存分配模式等。
I/O Profiling
I/O 性能分析
Disk and network I/O often become the bottleneck in high-performance systems. Understanding how I/O requests are processed, whether they originate from the disk or network interfaces, is key to improving performance in data-driven workloads.
磁盘与网络 I/O 往往会成为高性能系统的性能瓶颈。了解 I/O 请求的处理过程,无论其来自磁盘还是网络接口,都是提升数据驱动型工作负载运行表现的关键。
Consider a scenario where database queries are performing more slowly than expected. Using iostat, you can determine whether the bottleneck is disk I/O related:
假设数据库查询的执行速度低于预期,可通过 iostat 工具判断瓶颈是否与磁盘 I/O 相关:
bash
iostat -dx 5This command provides detailed disk I/O statistics, updating every five seconds (Figure 2). Key metrics include:
该命令将提供详细的磁盘 I/O 统计数据,每 5 秒更新一次(图 2)。核心指标包括:
await-- the average time (in milliseconds) that I/O requests spend in the queue
await ------ I/O 请求在队列中的平均等待时间(单位:毫秒)svctm-- the average service time for I/O requests
svctm ------ I/O 请求的平均服务时间
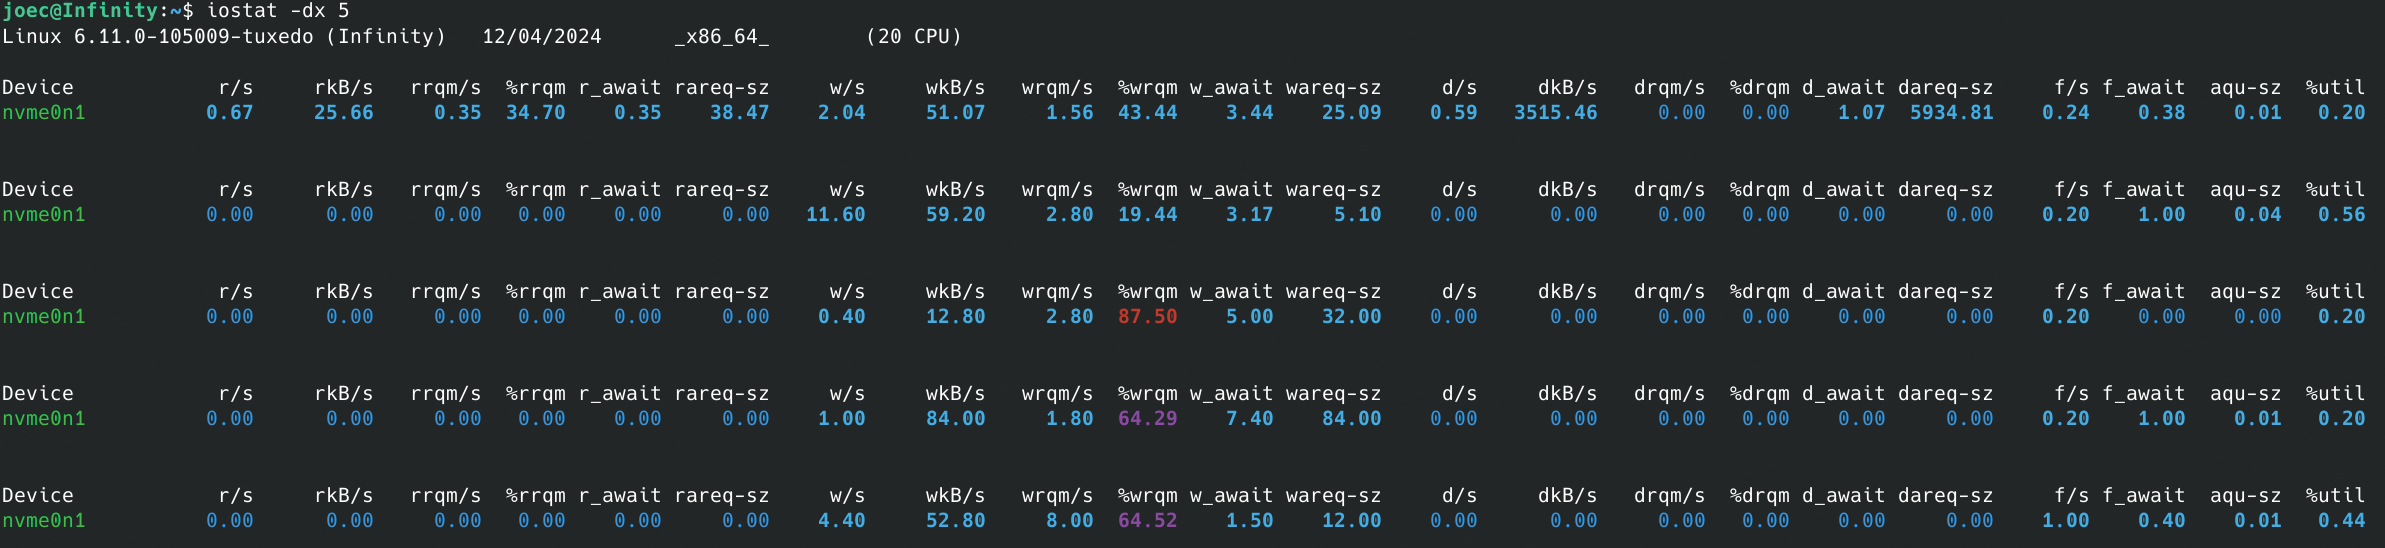
If await is significantly higher than svctm, it indicates that your disks are being overwhelmed with requests, leading to high latency. Based on this diagnosis, you could take several actions, such as tuning your I/O scheduler, switching to faster storage (e.g., SSDs), or increasing disk bandwidth in a cloud environment.
若 await 数值显著高于 svctm,说明磁盘的请求处理能力已达到上限,进而导致高延迟。基于这一诊断结果,可采取多种优化措施,如调优I/O 调度器、更换为更快的存储设备(如固态硬盘),或在云环境中提升磁盘带宽。
High disk or network latency can cripple high-performance systems. If disk I/O becomes a bottleneck, switching to a faster I/O scheduler (such as noop or deadline) or using direct I/O can yield substantial improvements. For network-bound workloads, increasing the TCP window size (tcp_rmem and tcp_wmem) and tuning kernel parameters for low-latency connections can enhance throughput.
磁盘或网络延迟过高会严重影响高性能系统的运行。若磁盘 I/O 成为性能瓶颈,切换为更高效的 I/O 调度器(如 noop、deadline)或使用直接 I/O 技术,能带来显著的性能提升。对于受网络资源限制的工作负载,增大 TCP 窗口大小(调整 tcp_rmem 与 tcp_wmem 参数)、调优低延迟连接相关的内核参数,可提升数据吞吐量。
Networking Stack Optimization
网络协议栈优化
The performance of Linux systems is heavily dependent on the efficiency of the networking stack, particularly in environments where applications require high throughput, low latency, or both. Whether you're managing a web server handling thousands of concurrent connections or a data center with high-bandwidth applications, optimizing the Linux kernel's networking parameters is crucial. I will take a look at how to tune essential TCP/IP parameters for maximum performance, reduce latency, and configure systems for high-bandwidth, NUMA-aware environments.
Linux 系统的运行表现与网络协议栈的效率高度相关,尤其是在应用对高吞吐、低延迟有单一或双重需求的环境中。无论是管理承载数千并发连接的 Web 服务器,还是运行高带宽应用的数据中心,调优Linux 内核的网络参数都是一项关键工作。本文将介绍如何调优TCP/IP 参数以实现性能最大化、降低延迟,以及如何为高带宽、支持NUMA架构的环境配置系统。
Linux TCP/IP stack performance depends on several key parameters that control how the kernel handles connections, buffers, and socket behavior. Properly tuning these parameters can significantly enhance throughput and reduce latency, especially in high-demand environments such as cloud infrastructures or high-concurrency web applications.
Linux 系统的 TCP/IP 协议栈性能,由多个控制内核连接处理、缓冲区管理、套接字行为的参数决定。对这些参数进行合理调优,能显著提升吞吐量、降低延迟,在云基础设施、高并发 Web 应用这类高需求环境中,效果尤为明显。
One critical parameter for web servers or services that handle numerous concurrent connections is tcp_max_syn_backlog. This setting controls the maximum number of pending TCP connection requests (SYN packets) that can be queued before the system starts dropping packets. As you can imagine, this setting is especially important for servers under heavy load, such as high-traffic websites or API gateways. You can increase the maximum SYN backlog with tcp_max_syn_backlog. The following command allows the system to manage a higher volume of pending TCP connections, which is crucial for handling high traffic without dropping connections:
对于承载大量并发连接的 Web 服务器或服务而言,tcp_max_syn_backlog 是一项关键参数。该参数用于控制系统开始丢弃数据包前,可排队的待处理 TCP 连接请求(SYN 包)的最大数量。可想而知,该参数在高负载服务器(如高流量网站、API 网关)中尤为重要。可通过调优 tcp_max_syn_backlog 参数增大 SYN 队列的最大长度,以下命令能让系统处理更多的待处理 TCP 连接,是高流量场景下避免连接丢弃的关键:
bash
sudo sysctl -w net.ipv4.tcp_max_syn_backlog=4096The default value for tcp_max_syn_backlog might be too low (often around 128 or 256) for high-concurrency servers. Increasing this value to 4096 (or higher, depending on the load) allows your server to handle more incoming SYN packets before dropping connections, improving the system's ability to manage bursts of connection requests.
对于高并发服务器而言,tcp_max_syn_backlog 的默认值(通常为 128 或 256)可能偏低。将该值提升至 4096(或根据负载进一步调高),能让服务器在丢弃连接前处理更多的入站 SYN 包,提升系统应对连接请求突发的能力。
You can persist this configuration by adding it to /etc/sysctl.conf:
可将该配置添加至 /etc/sysctl.conf 文件,实现参数的持久化:
bash
echo "net.ipv4.tcp_max_syn_backlog=4096" | sudo tee -a /etc/sysctl.conf
sudo sysctl -p
Adjusting tcp_rmem and tcp_wmem
调整 tcp_rmem 与 tcp_wmem 参数
Linux uses dynamic memory buffers for sending and receiving data over TCP connections. The tcp_rmem and tcp_wmem parameters control the minimum, default, and maximum buffer sizes for receiving and transmitting data. In environments where network latency or bandwidth varies, tuning these buffers can prevent performance bottlenecks caused by inefficient buffer management:
Linux 系统通过动态内存缓冲区处理 TCP 连接的数据收发操作,tcp_rmem 与 tcp_wmem 参数分别控制数据接收和发送缓冲区的最小、默认与最大尺寸。在网络延迟或带宽波动的环境中,调优这两个缓冲区参数,能避免因缓冲区管理低效引发的性能瓶颈:
bash
sudo sysctl -w net.ipv4.tcp_rmem="4096 87380 6291456"This command sets the buffer sizes for receiving and sending data, accommodating high-volume data transfers effectively. In this example:
该命令用于设置数据接收与发送的缓冲区大小,能高效适配大流量的数据传输场景。本示例中的参数含义为:
-
The first number (4096) sets the minimum buffer size.
第一个数值(4096)为缓冲区最小尺寸
-
The second (87380 for tcp_rmem and 65536 for tcp_wmem) is the default size.
第二个数值(tcp_rmem 为 87380,tcp_wmem 为 65536)为缓冲区默认尺寸
-
The third (6291456) sets the maximum size.
第三个数值(6291456)为缓冲区最大尺寸
For high-bandwidth environments, increasing the maximum buffer sizes allows TCP to utilize more memory for efficient data transfer, especially for large file transfers or streaming workloads. Setting an appropriate default size ensures that smaller, less bandwidth-intensive connections are not wastefully allocated large buffers, preserving system memory for critical connections.
在高带宽环境中,增大缓冲区的最大尺寸,能让 TCP 协议占用更多内存以实现高效的数据传输,在大文件传输、流处理这类工作负载中效果尤为突出。设置合理的默认尺寸,能避免为流量较小、对带宽要求较低的连接分配过大的缓冲区造成资源浪费,从而为核心连接预留系统内存。
You can persist these changes by updating /etc/sysctl.conf:
可通过更新 /etc/sysctl.conf 文件实现该配置的持久化:
bash
echo "net.ipv4.tcp_rmem =   4096 87380 6291456" | sudo tee -a /etc/sysctl.conf
echo "net.ipv4.tcp_wmem =   4096 65536 6291456" | sudo tee -a /etc/sysctl.conf
sudo sysctl -p
These adjustments ensure that the kernel allocates sufficient buffer space for high-throughput applications, preventing bottlenecks caused by buffer exhaustion.
这类调整能确保内核为高吞吐应用分配充足的缓冲区空间,避免因缓冲区耗尽引发的性能瓶颈。
Tuning Kernel Parameters for Reducing Latency
调优内核参数以降低延迟
In latency-sensitive applications such as financial trading platforms, real-time video streaming, or multiplayer gaming, reducing network latency is critical. By tuning kernel parameters related to congestion control and buffer management, you can minimize delays and achieve lower round-trip times (RTT).
在金融交易平台、实时视频流、多人游戏这类对延迟敏感的应用中,降低网络延迟是核心需求。通过调优与拥塞控制、缓冲区管理相关的内核参数,能最大限度减少延迟,实现更低的往返时延(RTT)。
TCP congestion control algorithms play a key role in managing packet loss and adjusting the transmission rate to avoid overwhelming network paths. The default algorithm on most Linux systems is cubic, which is optimized for high-bandwidth scenarios but might not always be the best choice for latency-sensitive applications.
TCP 拥塞控制算法在丢包管理、传输速率调整中发挥核心作用,可避免网络链路因负载过高而拥塞。大多数 Linux 系统的默认拥塞控制算法为 cubic,该算法针对高带宽场景做了优化,但并非在所有对延迟敏感的应用中都是最优选择。
BBR (Bottleneck Bandwidth and Round-trip propagation time) is a modern congestion control algorithm designed to minimize network latency by controlling the congestion window size based on estimated bottleneck bandwidth and RTT, rather than packet loss:
BBR(瓶颈带宽与往返传播时间)是一款现代拥塞控制算法,其设计逻辑为基于预估的瓶颈带宽和往返时延而非丢包率控制拥塞窗口大小,以此实现网络延迟的最小化:
bash
sudo sysctl -w net.ipv4.tcp_congestion_control=bbrThis command sets the TCP congestion control parameter to bbr, which helps in enhancing network throughput and reducing latency by adjusting the congestion control method. Verify which congestion control algorithm is currently in use with
该命令将 TCP 拥塞控制算法设置为 BBR,通过调整拥塞控制方式,助力提升网络吞吐量、降低延迟。可通过以下命令验证当前使用的拥塞控制算法:
bash
sysctl net.ipv4.tcp_congestion_controlFor users managing latency-sensitive workloads, switching to BBR or Reno can yield substantial latency reductions by ensuring more consistent throughput with fewer retransmissions. Persist the setting by adding the following line to /etc/sysctl.conf:
对于管理延迟敏感型工作负载的使用者而言,切换至 BBR 或 Reno 算法,能通过减少重传次数、实现更稳定的吞吐量,大幅降低延迟。可在 /etc/sysctl.conf 文件中添加以下配置行,实现该设置的持久化:
bash
echo "net.ipv4.tcp_congestion_control=bbr" | sudo tee -a /etc/sysctl.conf
sudo sysctl -p
This command ensures the setting remains active after a reboot, supporting improved connection handling under load by appending the configuration and reloading with sysctl -p. In practice, this change can reduce latency in environments with fluctuating network conditions, such as mobile networks or geographically distributed systems.
该命令通过追加配置并执行 sysctl -p 重新加载,确保设置在系统重启后依然生效,提升系统在负载下的连接处理能力。在实际应用中,该调整能降低网络条件波动环境(如移动网络、跨地域分布式系统)中的延迟。
Tuning Buffer Management to Reduce Jitter
调优缓冲区管理以降低抖动
Buffer management is another aspect of reducing network latency. Large buffers can introduce latency variability (also known as jitter), which is detrimental to real-time applications. Linux provides parameters to limit buffer sizes and reduce the impact of excessive buffering, commonly known as bufferbloat. You can configure the maximum receive buffer memory for the network core using rmem_max:
缓冲区管理是降低网络延迟的另一重要维度。过大的缓冲区会引入延迟波动(也称为抖动),这对实时应用的运行极为不利。Linux 系统提供了用于限制缓冲区大小、降低过度缓冲(通常称为缓冲区膨胀)影响的参数,可通过 rmem_max 参数配置网络的最大接收缓冲区内存:
bash
sudo sysctl -w net.core.rmem_max=262144This command sets a larger buffer size for incoming data, allowing the system to handle higher throughput effectively. By capping the maximum buffer size, you can prevent over-buffering, which reduces jitter and helps stabilize network latency. Additionally, adjusting the receive and send buffer settings for individual connections ensures that TCP doesn't introduce unnecessary delays in packet transmission.
该命令为入站数据设置更大的缓冲区尺寸,让系统能高效处理更高的吞吐量。通过限制缓冲区的最大尺寸,可避免过度缓冲问题,进而降低抖动、稳定网络延迟。此外,调整单个连接的收发缓冲区设置,能确保 TCP 协议不会在数据包传输过程中引入非必要的延迟。
These adjustments, while seemingly minor, can dramatically improve performance in environments where predictability and consistency are more important than raw bandwidth. For example, multiplayer gaming servers and real-time financial applications rely on minimal jitter to maintain a smooth and predictable user experience.
这类调整看似细微,但在稳定性和可预测性比原始带宽更重要的环境中,能带来显著的性能提升。例如,多人游戏服务器、实时金融应用均依赖极低的抖动,以保障流畅、可预测的用户体验。
NUMA-Aware Network Tuning
支持NUMA架构的网络调优
In high-performance computing (HPC) and data centers, Non-Uniform Memory Access (NUMA) systems introduce complexities in optimizing network performance. NUMA systems distribute memory access across multiple nodes, and networking performance can suffer when memory and network interface cards (NICs) are misaligned between NUMA nodes. Optimizing NUMA awareness in network configurations is crucial for maintaining high throughput and low latency in these environments.
在高性能计算(HPC)和数据中心环境中,非统一内存访问(NUMA)系统为网络性能优化带来了复杂性。NUMA 系统将内存访问分布在多个节点上,当内存与网络接口卡(NIC)在 NUMA 节点间的亲和性不匹配时,网络性能会受到影响。在这类环境中,对网络配置做 NUMA 架构适配优化,是维持高吞吐、低延迟的关键。
In a NUMA system, ensuring that NICs are assigned to the correct CPU cores is essential for reducing cross-node memory access delays. You can achieve this by binding NIC interrupts and network processing to CPUs that are local to the NIC's NUMA node, minimizing the overhead of accessing memory across NUMA boundaries:
在 NUMA 系统中,将网络接口卡分配至对应的 CPU 核心,是减少跨节点内存访问延迟的核心操作。可通过将网络接口卡的中断与网络处理任务绑定至该网卡所属 NUMA 节点的本地 CPU,降低跨 NUMA 边界的内存访问开销:
bash
sudo echo 1 > /proc/irq/<IRQ_NUMBER>/smp_affinityHere, <IRQ_NUMBER> corresponds to the IRQ number of the NIC. Setting the affinity to 1 ensures that the interrupt is handled by the first CPU on the NIC's NUMA node. For high-throughput networking, you might spread interrupts across multiple CPUs on the same NUMA node to parallelize packet processing.
其中,<IRQ_NUMBER> 为网络接口卡对应的中断号。将亲和性设置为 1,可确保中断由该网卡所属 NUMA 节点的第一个 CPU 处理。对于高吞吐网络场景,可将中断分散至同一 NUMA 节点的多个 CPU,实现数据包处理的并行化。
To automate this process across system reboots, consider using the irqbalance service, which dynamically assigns interrupt handling across CPUs based on load. However, for latency-sensitive environments, manual tuning often yields better results.
若希望该配置在系统重启后自动生效,可使用 irqbalance 服务,该服务会根据负载情况在多个 CPU 间动态分配中断处理任务。但在对延迟敏感的环境中,手动调优往往能带来更优的效果。
Receive Side Scaling (RSS) allows for the parallel processing of network traffic across multiple CPUs, distributing the load more evenly. In NUMA systems, ensuring that RSS is NUMA-aware can help further optimize performance:
接收端扩展(RSS)技术支持在多个 CPU 间并行处理网络流量,实现负载的更均衡分配。在 NUMA 系统中,让 RSS 适配 NUMA 架构,能进一步实现性能优化:
bash
ethtool -L eth0 combined 8This command instructs the system to use 8 RX/TX queues on the network interface eth0, allowing traffic to be distributed across eight cores. By ensuring these cores are located on the same NUMA node as the NIC, you can minimize memory access latency and maximize network throughput.
该命令让系统在 eth0 网络接口上启用 8 个收/发队列,使流量能分散至 8 个 CPU 核心处理。确保这些核心与网络接口卡位于同一 NUMA 节点,能最大限度降低内存访问延迟,提升网络吞吐量。
Frequently Asked Questions
常见问题
1. What are the best tools for Linux performance profiling and monitoring?
1. 用于 Linux 性能分析与监控的优质工具有哪些?
The most effective Linux performance tools include:
效果较好的 Linux 性能工具包括:
-
perf : Comprehensive CPU, memory, and I/O profiling with call graph analysis
perf:具备调用图分析能力,可对 CPU、内存、I/O 进行全面的性能分析 -
ftrace : Low-level kernel function tracing for debugging system calls and kernel operations
ftrace:可追踪底层内核函数,用于调试系统调用与内核操作 -
bpftrace : Programmable tracing for custom metrics and real-time system analysis
bpftrace:支持可编程追踪,可采集自定义指标并做系统实时分析 -
iostat : Disk I/O performance monitoring and bottleneck identification
iostat:监控磁盘 I/O 性能并定位性能瓶颈 -
valgrind/massif : Memory profiling and leak detection for applications
valgrind/massif:对应用做内存性能分析并检测内存泄漏 -
htop/top : Real-time system resource monitoring
htop/top:实时监控系统资源使用情况 -
vmstat : Virtual memory and system activity statistics
vmstat:统计虚拟内存与系统活动相关数据
2. How do I optimize Linux TCP performance for high-throughput applications?
2. 如何为高吞吐应用优化 Linux 的 TCP 性能?
Optimize TCP performance by tuning these key parameters. Remember to apply these changes with sudo sysctl -w <parameter>=<value> and make them permanent by adding the lines to /etc/sysctl.conf, then running sudo sysctl -p or use the following commands.
可通过调优以下参数实现 TCP 性能优化。请使用 sudo sysctl -w <parameter>=<value> 使配置生效,并将配置行添加至 /etc/sysctl.conf 文件,再执行 sudo sysctl -p 实现持久化,也可直接使用以下命令。
-
tcp_max_syn_backlog: Increase this value to4096or higher to handle more incoming connection requests simultaneously, preventing dropped connections under heavy load.
tcp_max_syn_backlog:将该值提升至4096或更高,可同时处理更多入站连接请求,避免高负载下的连接丢弃。bashecho "net.ipv4.tcp_max_syn_backlog=4096" | sudo tee -a /etc/sysctl.conf sudo sysctl -p -
tcp_rmem/tcp_wmem: Set buffer sizes for receiving (rmem) and sending (wmem) data. The format ismin default max. For example,"4096 87380 6291456"allows for efficient data transfer, especially over high-bandwidth, high-latency links.
tcp_rmem/tcp_wmem:设置数据接收(rmem)与发送(wmem)的缓冲区大小,格式为最小值 默认值 最大值。例如配置为"4096 87380 6291456"可实现高效的数据传输,在高带宽、高延迟的网络链路中效果尤为明显。bashsudo sysctl -w net.ipv4.tcp_rmem="4096 87380 6291456" sudo sysctl -w net.ipv4.tcp_wmem="4096 87380 6291456" -
tcp_congestion_control: Switch to an algorithm like BBR (Bottleneck Bandwidth and RTT) for better latency and throughput, especially in environments with packet loss or varying network conditions.
tcp_congestion_control:切换至 BBR(瓶颈带宽与往返时延)这类算法,可提升延迟与吞吐量表现,在存在丢包或网络条件波动的环境中效果显著。bashecho "net.ipv4.tcp_congestion_control=bbr" | sudo tee -a /etc/sysctl.conf sudo sysctl -p -
net.core.rmem_max: Increase the maximum size of the receive buffer for all network sockets. This is crucial for high-bandwidth scenarios to prevent data loss and improve throughput.
net.core.rmem_max:增大所有网络套接字的最大接收缓冲区尺寸,这在高带宽场景中是防止数据丢失、提升吞吐量的关键。bashecho "net.core.rmem_max=6291456" | sudo tee -a /etc/sysctl.conf sudo sysctl -p -
tcp_window_scaling: Ensure this is enabled (1) to allow TCP to use larger window sizes, which is essential for maximizing throughput over high-latency or high-bandwidth connections.
tcp_window_scaling:确保该参数开启(设置为1),让 TCP 协议可使用更大的窗口尺寸,这是在高延迟或高带宽连接中实现吞吐量最大化的关键。bashsudo sysctl -w net.ipv4.tcp_window_scaling=1 echo "net.ipv4.tcp_window_scaling=1" | sudo tee -a /etc/sysctl.conf sudo sysctl -p
Apply changes with sysctl -w and persist in /etc/sysctl.conf.
使用sysctl -w使配置即时生效,并将配置写入/etc/sysctl.conf实现持久化。
3. What is NUMA tuning and why is it important for performance?
3. 什么是 NUMA 调优?其对性能提升的重要性体现在哪里?
NUMA (Non-Uniform Memory Access) tuning optimizes memory access in multi-socket systems by:
NUMA(非统一内存访问)调优通过以下方式优化多插槽系统的内存访问效率:
-
Binding processes to specific NUMA nodes to minimize cross-node memory access
将进程绑定至特定 NUMA 节点,减少跨节点内存访问 -
Aligning network interfaces with local CPU cores using IRQ affinity
通过 IRQ 亲和性将网络接口与本地 CPU 核心匹配 -
Configuring Receive Side Scaling (RSS) to distribute network processing across local cores
配置接收端扩展(RSS),将网络处理任务分散至本地核心 -
Using numactl to control memory allocation policies
使用 numactl 工具,控制内存分配策略
NUMA tuning is crucial for high-performance computing, databases, and latency-sensitive applications where memory access patterns significantly impact performance.
在高性能计算、数据库以及对延迟敏感的应用中,内存访问模式对性能影响显著,因此 NUMA 调优在这类场景中至关重要。
4. How can I identify and fix memory performance issues in Linux?
4. 如何在 Linux 系统中定位并解决内存性能问题?
Use these approaches to diagnose and resolve memory problems:
可通过以下方法诊断并解决内存问题:
-
Monitor with valgrind/massif : Track memory allocation patterns and identify leaks
使用 valgrind/massif 监控:追踪内存分配模式并定位内存泄漏 -
Use bpftrace: Trace kernel memory allocations in real-time
使用 bpftrace:实时追踪内核内存分配操作
-
Check /proc/meminfo : Monitor memory usage, swap, and fragmentation
查看 /proc/meminfo:监控内存使用、页面置换与内存碎片情况 -
Adjust vm.swappiness : Reduce swapping (set to 1-10) for better performance
调整 vm.swappiness:将其设置为 1-10 以减少页面置换,提升性能 -
Enable Transparent Huge Pages (THP) : Improve memory allocation efficiency
开启透明大页(THP):提升内存分配效率 -
Monitor OOM killer logs : Identify processes consuming excessive memory
监控 OOM killer 日志:定位过度消耗内存的进程
5. What kernel parameters should I tune for low-latency applications?
5. 为对延迟敏感的应用调优,需重点配置哪些内核参数?
For latency-sensitive applications, focus on these parameters:
针对对延迟敏感的应用,可重点调优以下参数:
-
tcp_congestion_control=bbr : Better latency than default cubic algorithm
tcp_congestion_control=bbr:相比默认的 cubic 算法,能实现更优的延迟表现 -
net.core.rmem_max : Limit buffer sizes to reduce jitter
net.core.rmem_max:限制缓冲区尺寸,降低延迟抖动 -
kernel.sched_rt_runtime_us : Adjust real-time scheduling
kernel.sched_rt_runtime_us:调整实时调度相关配置 -
kernel.timer_migration : Disable for consistent timer behavior
kernel.timer_migration:关闭该参数,保证定时器行为的一致性 -
irqbalance : Disable and manually set IRQ affinity
irqbalance:关闭该服务并手动设置 IRQ 亲和性 -
CPU frequency scaling : Set to performance mode
CPU 频率缩放:设置为性能模式 -
Transparent Huge Pages : May need disabling for consistent latency
透明大页:为保证延迟的一致性,可能需要关闭该功能
Conclusion
总结
Optimizing the Linux networking stack is essential for achieving high performance in demanding environments such as high-concurrency servers, low-latency applications, and high-bandwidth data centers. This article covered some important optimization techniques, including tuning TCP/IP parameters such as tcp_max_syn_backlog for handling large volumes of connections and adjusting tcp_rmem and tcp_wmem for efficient buffer management. I also explored advanced congestion control algorithms such as BBR for reducing latency and how proper buffer management prevents jitter. In NUMA-aware systems, aligning NICs to the correct CPU cores and leveraging Receive Side Scaling optimizes network throughput.
在高并发服务器、低延迟应用、高带宽数据中心这类高要求环境中,优化 Linux 网络协议栈是实现高性能的关键。本文介绍了多项重要的优化方法,包括调优 tcp_max_syn_backlog 等 TCP/IP 参数以处理大规模连接、调整 tcp_rmem 与 tcp_wmem 实现高效的缓冲区管理;同时探讨了 BBR 这类高级拥塞控制算法的低延迟优化效果,以及合理的缓冲区管理对抑制抖动的作用;在支持 NUMA 架构的系统中,将网络接口卡与对应 CPU 核心匹配并利用接收端扩展技术,可实现网络吞吐量的优化。
Beyond networking are numerous other techniques for optimizing Linux performance, such as CPU scheduling optimization, memory management tuning, interrupt handling, and affinity tuning, all of which target specific system bottlenecks. These strategies, when applied correctly, help ensure that Linux environments perform optimally and scale to meet demanding workloads.
除网络层面外,Linux 性能优化还有诸多其他方法,如 CPU 调度优化、内存管理调优、中断处理优化、亲和性调优等,这些方法均针对系统的特定性能瓶颈。合理应用这些策略,能确保 Linux 环境实现最优运行表现,并具备应对高要求工作负载的扩展能力。
Linux 内核性能优化实践指南
探究 Linux 内核调优方法,提升系统性能、稳定性与运行效率。
Linux 内核作为操作系统的功能载体,其运行性能直接影响整个系统的表现。通过规范化的调优操作,可显著提升应用程序的响应速度、数据处理能力与系统的整体稳定性。本指南将全面阐述 Linux 内核优化的实施策略与实操方法,助力使用者根据实际业务需求搭建高性能的 Linux 运行环境。
优化的三大实施维度
- 精细化参数调整 :通过
sysctl工具与/proc文件系统动态调整内核参数,以此适配不同业务负载,实现对 CPU 调度、内存管理、网络协议栈与文件系统行为的调优。 - 定制化内核编译:针对特定硬件配置与应用场景编译内核,移除无用功能模块,启用针对性的性能优化项,可最大限度提升系统运行效率,降低系统资源占用。
- 持续性监控与验证:各类优化操作的落地均需配套的监控与基准测试手段,借助专业工具跟踪系统性能指标,可实现对优化效果的验证与潜在性能瓶颈的挖掘。
理解 Linux 内核:优化的实施基础
Linux 内核是操作系统的功能单元,负责管理系统的硬件资源(如 CPU、内存、磁盘 I/O)与软件资源(如进程调度、网络通信),并为应用程序提供与硬件交互的标准化接口。理解内核的基础工作原理,例如其模块化设计(支持通过加载或卸载模块实现功能扩展),是开展有效优化操作的前提。不同版本的内核会包含差异化的功能特性、性能优化项与硬件支持能力。
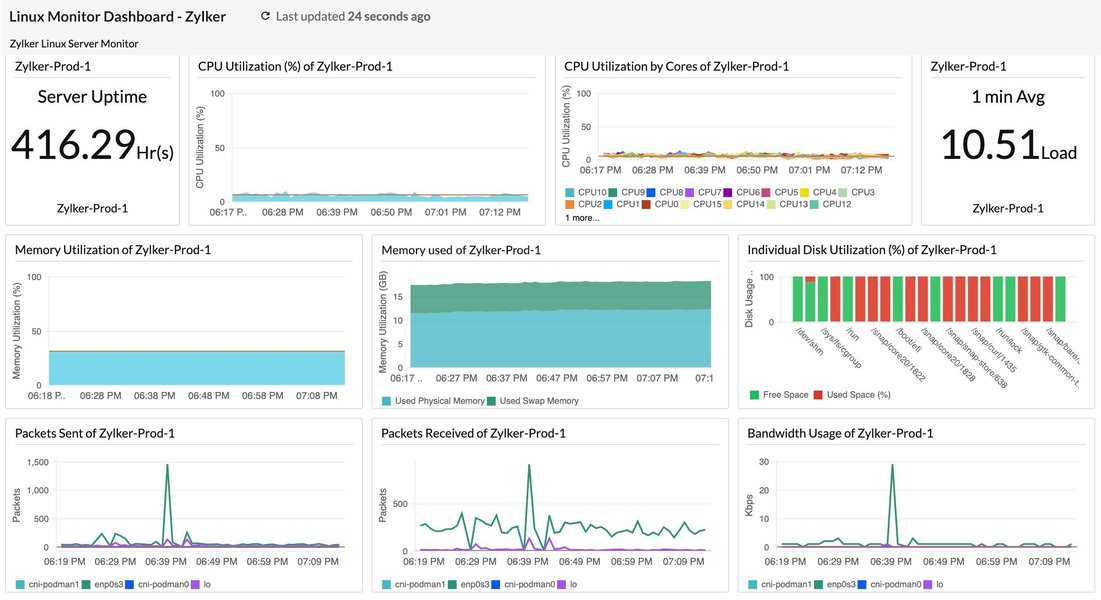
典型的 Linux 系统监控仪表盘,可展示系统关键性能指标。
适配性选择内核版本
内核版本的合理选择对系统性能、稳定性与安全性具有重要影响,不同的应用场景需匹配差异化的内核类型:
- 长期支持版 (LTS - Long-Term Support) 内核:专为服务器、企业级部署与生产环境设计,提供长期的安全更新与高等级的运行稳定性,是追求系统可靠性场景的优选方案。
- 主线版 (Mainline) 内核:包含最新的功能特性、硬件支持能力与性能优化项,运行稳定性相较于 LTS 版本存在差异,适用于尝试新技术特性或需要适配特定新硬件的应用场景。
- 实时版 (Real-time) 内核:针对低延迟、确定性响应的应用场景做专项优化,例如工业控制系统、金融交易平台、高质量多媒体处理场景,通常通过为标准内核应用 PREEMPT_RT 补丁集实现。
可通过以下命令检查当前运行的 Linux 内核版本:
bash
uname -r根据实际业务需求(如服务器稳定性、桌面端最新功能、嵌入式设备实时性)选择适配的内核分支与版本,是开展内核优化的首要步骤。
内核参数调优:动态提升系统运行效能
内核参数调整是 Linux 性能优化中应用最广泛、效果最显著的方法之一。通过 sysctl 工具或直接修改 /proc 文件系统中的配置文件,可动态修改内核的运行时行为,且多数参数的调整无需重新编译内核或重启系统。
基于 sysctl 与 /proc 的动态参数调整
sysctl 命令用于在系统运行时读取与修改内核参数,此类参数通常存放于 /proc/sys/ 目录下。例如,临时修改某一内核参数的命令如下:
bash
sysctl -w vm.swappiness=10若需使参数修改永久生效,需将参数配置写入 /etc/sysctl.conf 文件或 /etc/sysctl.d/ 目录下的自定义配置文件,随后执行 sysctl -p 或 sysctl --system 命令加载新配置。
CPU 调度优化
CPU 调度器负责决策进程的运行时机与绑定的 CPU 运算核,调整调度器相关参数可提升 CPU 运行效率与应用程序的响应性。
kernel.sched_min_granularity_ns:任务被抢占前的最小运行时长,较低的数值可提升交互式应用的响应速度,但会增加系统上下文切换的开销。kernel.sched_wakeup_granularity_ns:任务被唤醒后,抢占当前运行任务的等待时长。
内存管理优化
高效的内存管理是保障系统性能的重要前提,不合理的内存配置可能导致系统出现频繁的内存交换(swapping)或内存不足的情况。
vm.swappiness:控制内核将内存页换出至交换空间的倾向程度,取值范围为 0 至 100。较低的数值(如 10)会使内核更倾向于将数据保留在物理内存中,适用于内存资源充足的系统或对延迟敏感的应用场景,该参数的默认值通常为 60。vm.dirty_ratio:当脏页(已修改但未写入磁盘的内存页)占总可用内存的百分比达到该阈值时,系统将强制进程同步写入脏页至磁盘。vm.dirty_background_ratio:当脏页占总可用内存的百分比达到该阈值时,内核的后台刷新进程(如 pdflush、kworker)将启动异步写盘操作。vm.vfs_cache_pressure:控制内核回收目录与 inode 对象缓存内存的倾向程度,默认值为 100,提高该数值会使内核更积极地回收 inode 与 dentry 缓存。
网络协议栈优化
针对网络密集型应用,尤其是高并发服务器场景,TCP/IP 协议栈参数的优化至关重要。
net.core.somaxconn:定义 TCP 监听队列的最大长度,对于高并发 Web 服务器,建议提高该参数值(如从默认的 128 调整至 1024 及以上,甚至 65535)。net.ipv4.tcp_max_syn_backlog:定义处于 SYN_RECV 状态的 TCP 连接最大数量,提高该数值有助于应对 SYN 洪水攻击与高连接建立速率的场景。net.ipv4.tcp_tw_reuse:设置为 1 时,允许将 TIME-WAIT 状态的套接字重新用于新的 TCP 连接,可缓解高连接率的短连接场景下的端口耗尽问题。net.ipv4.tcp_fin_timeout:定义套接字在 FIN-WAIT-2 状态下的保持时长,降低该数值可加快系统资源的释放。net.core.netdev_max_backlog:当网络接口接收数据包的速度高于内核处理速度时,允许排队的数据包最大数量。net.ipv4.tcp_rmem与net.ipv4.tcp_wmem:分别设置 TCP 接收缓冲区与发送缓冲区的最小值、默认值与最大值,调整此类参数可优化网络吞吐量。
文件系统参数优化
文件系统相关参数的调整可实现磁盘 I/O 性能的优化。
- 挂载选项
noatime:挂载文件系统时启用该选项,可禁止系统更新文件的访问时间戳,减少无意义的磁盘写操作,适用于读取密集型的业务负载,可通过修改/etc/fstab文件配置该挂载选项。 fs.file-max:定义系统级别的最大可打开文件句柄数量,对于需要同时处理大量文件的服务器(如 Web 服务器、数据库服务器),需适当提高该参数值。
常用内核参数调优汇总表
下表汇总了常见的内核调优参数、参数描述与建议取值/范围,此类参数通常通过 sysctl 工具调整,需注意的是,参数的最优取值取决于系统的硬件配置与实际业务负载。
| 参数 (Parameter) | 描述 (Description) | 常见建议值/范围 (Common Recommended Value/Range) |
|---|---|---|
vm.swappiness |
控制系统使用交换空间的倾向程度,数值越低,越倾向于使用物理内存 | 0-10 (适用于内存充足的服务器) |
vm.dirty_ratio |
系统脏数据占总可用内存的百分比达到该值时,触发同步写盘操作 | 10-20% |
vm.dirty_background_ratio |
系统脏数据占总可用内存的百分比达到该值时,后台进程启动异步写盘操作 | 5-10% |
net.core.somaxconn |
TCP 监听队列的最大长度,适用于高并发服务器场景 | 1024 - 65535 |
net.ipv4.tcp_max_syn_backlog |
SYN 队列的最大长度,可缓解 SYN 洪水攻击 | 2048 - 8192 或更高 |
net.ipv4.tcp_tw_reuse |
允许重用 TIME_WAIT 状态的套接字 | 1 (启用) |
net.ipv4.ip_local_port_range |
定义本地 TCP/UDP 协议可使用的端口范围 | 例如 "1024 65535" |
kernel.sched_min_granularity_ns |
CPU 调度器中任务的最小运行时间片(单位:纳秒) | 根据负载调整 (例如 10000000) |
kernel.sched_wakeup_granularity_ns |
CPU 调度器中唤醒抢占的粒度(单位:纳秒) | 根据负载调整 (例如 15000000) |
net.core.netdev_max_backlog |
网络设备接收数据包的排队最大长度 | 1000 - 30000 |
fs.file-max |
系统级别的最大可打开文件句柄数量 | 例如 2097152 (根据实际需求调整) |
fs.inotify.max_user_watches |
单个用户可创建的 inotify watch 最大数量 | 例如 524288 (适用于 IDE 或文件监控工具) |
重要提示:修改任何内核参数前,需充分理解参数的含义与潜在影响;建议先在测试环境中进行参数调整,采用渐进式的调整方式,同时持续监控系统性能变化。
定制化内核编译:深度性能优化方法
针对对性能有极致要求或存在特定硬件适配需求的高级使用者,从源代码编译内核可实现高度的定制化,精准控制内核包含的功能、驱动程序与优化选项。
定制化内核编译的优势
- 移除无用功能与驱动程序:发行版默认内核为保障兼容性,会包含大量的驱动与功能模块,移除系统无实际需求的模块,可减小内核体积、降低内存占用、缩短系统启动时间,同时提升系统运行效率与安全性(减少攻击面)。
- 针对处理器的专项优化:内核编译配置支持选择特定的 CPU 系列与型号,可启用针对该硬件架构的精细化优化,例如特定指令集的支持。
- 启用实验性或场景化功能:部分高级功能、最新硬件驱动或特定内核补丁未包含在标准发行版内核中,可通过定制化编译实现此类功能的启用。
- 精细化调整内核配置选项 :通过
make menuconfig等工具可访问数千个内核配置选项,实现对内核各子系统的细致化调整。
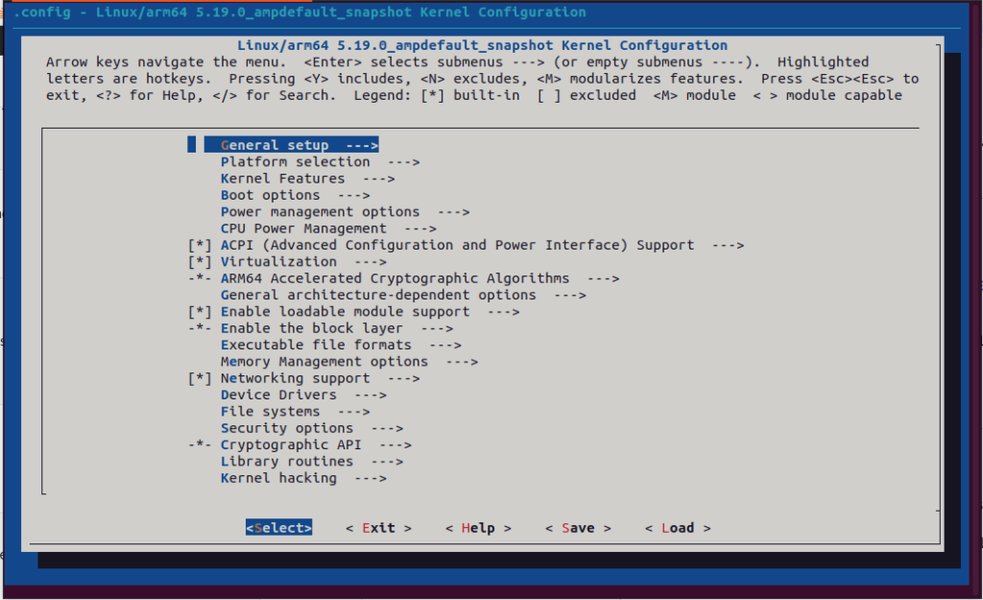
通过 make menuconfig 工具配置 Linux 内核选项的界面示例。
定制化内核编译步骤概览
定制化内核编译的常规执行步骤如下:
-
安装必备的构建工具 :包括编译器(如 GCC)、make、ncurses-devel(为
menuconfig提供支持)等,工具包的名称因 Linux 发行版而异(如build-essential、kernel-devel)。 -
获取内核源代码 :
可从内核官方网站 kernel.org 下载,或使用发行版提供的源码包,示例命令如下:
bash# 克隆稳定版内核源码 git clone https://git.kernel.org/pub/scm/linux/kernel/git/stable/linux.git -
配置内核选项 :
此为定制化编译的步骤,可基于当前系统的内核配置文件(通常位于
/boot/config-$(uname -r))进行修改,随后通过以下任一命令打开配置界面:make menuconfig: 基于文本的菜单式配置界面。make nconfig: 功能与menuconfig一致,界面呈现形式存在差异。make xconfig: 基于 Qt 的图形化配置界面。make gconfig: 基于 GTK 的图形化配置界面。
该阶段可完成处理器类型选择、驱动程序启用/禁用、文件系统支持配置、网络协议开启/关闭、调试选项调整等操作。
-
编译内核:
bashmake -j$(nproc) # 调用所有可用的 CPU 运算核进行并行编译 -
安装内核模块:
bashsudo make modules_install -
安装内核:
bashsudo make install该步骤会将编译完成的内核映像 (
vmlinuz-*)、初始 RAM 盘 (initramfs-*) 与 System.map 文件复制至/boot目录,并更新引导加载程序(如 GRUB)的配置。 -
更新引导加载程序(按需操作) :部分系统在执行
make install后会自动更新引导加载程序,若未实现自动更新,需手动执行相关命令,例如 Debian/Ubuntu 系统执行sudo update-grub,Fedora/RHEL 系统执行sudo grub2-mkconfig -o /boot/grub2/grub.cfg。 -
重启系统:在引导界面选择新编译的内核完成系统启动。
注意:内核编译是一项复杂度较高、耗时较长的操作,错误的配置可能导致系统无法启动或运行不稳定;编译前务必备份系统重要数据,并充分理解所修改配置选项的含义与影响。
I/O 调度器优化
I/O 调度器负责决策块设备(如硬盘、SSD)上读写请求的执行顺序,适配的 I/O 调度器选择可显著提升磁盘性能,尤其在特定的业务负载场景下。
常见 I/O 调度器类型
- noop (No Operation):最简的 I/O 调度器,将所有 I/O 请求通过先进先出(FIFO)方式合并后直接传递至硬件,适用于无寻道开销的设备(如 SSD、NVMe)或底层已实现智能调度的场景(如虚拟化环境中的 hypervisor)。
- deadline:为每个 I/O 请求设置截止时间,尝试在截止时间前完成请求处理,优先处理读请求以降低读延迟,适用于数据库等对读延迟敏感的应用场景。
- cfq (Completely Fair Queuing):旧版本内核中的默认调度器,为每个进程维护独立的 I/O 队列,并尝试在各队列间公平分配 I/O 带宽,适用于桌面系统与混合业务负载,不适用于 SSD 设备。
- bfq (Budget Fair Queuing):基于 cfq 的改进版本,旨在为交互式应用提供更优的响应时间与更低的延迟,同时保障系统吞吐量,在新版本内核中常替代 cfq 成为默认调度器。
- kyber:新一代多队列调度器,专为现代高速存储设备(如 NVMe SSD)设计,设计目标为实现低延迟的 I/O 处理。
I/O 调度器的查看与修改
查看指定块设备的当前 I/O 调度器(以设备 sda 为例):
bash
cat /sys/block/sda/queue/scheduler命令输出会标注当前激活的调度器(用方括号括起)与系统支持的所有调度器,示例输出:[mq-deadline] kyber bfq none。
临时修改指定块设备的 I/O 调度器(以将 sda 的调度器改为 kyber 为例):
bash
echo kyber | sudo tee /sys/block/sda/queue/scheduler若需实现 I/O 调度器的永久修改,通常需通过 udev 规则或系统启动脚本配置。调度器的选择取决于存储设备类型与业务负载,对于 SSD 与 NVMe 设备,推荐使用 noop、mq-deadline 或 kyber,通过基准测试可确定适配性最优的调度器。
CPU 与中断处理优化
CPU 使用与中断处理的优化可提升系统响应速度与多核处理器的运行效率。
CPU 亲和性 (CPU Affinity)
CPU 亲和性支持将特定进程或线程绑定至一个或一组指定的 CPU 运算核运行,该配置可带来以下收益:
- 提升缓存命中率:进程持续在同一 CPU 运算核运行时,其数据更易保留在该运算核的缓存中,减少缓存未命中的情况与内存访问延迟。
- 降低任务迁移开销:避免进程在不同 CPU 运算核间的频繁迁移,减少系统上下文切换的成本。
- 实现关键任务隔离:将性能敏感型任务绑定至专用 CPU 运算核,避免非关键任务的资源抢占与干扰。
可通过 taskset 命令查看或设置进程的 CPU 亲和性,例如将进程 ID 为 <PID> 的进程绑定至 CPU 运算核 0 与 1:
bash
sudo taskset -pc 0,1 <PID>中断绑定 (IRQ Affinity)
中断请求(IRQ)是硬件设备(如网卡、磁盘控制器)向 CPU 发送的事件处理通知,默认情况下,中断可由系统中任意 CPU 运算核处理。通过 IRQ 亲和性配置,可将特定设备的中断处理绑定至指定的 CPU 运算核或运算核组,该操作的收益与 CPU 亲和性类似,尤其适用于高 I/O 负载的硬件设备(如高速网卡):
- 提升网络吞吐量与降低延迟:将网卡的中断处理绑定至指定 CPU 运算核,避免中断处理在多个运算核间切换,提升处理效率。
- 避免单运算核过载:将不同设备的中断分散至不同 CPU 运算核,防止单个运算核因处理大量中断成为系统性能瓶颈。
IRQ 亲和性通常通过修改 /proc/irq/<IRQ_NUMBER>/smp_affinity 或 /proc/irq/<IRQ_NUMBER>/smp_affinity_list 文件实现,例如:
-
将 IRQ 号为
<IRQ_NUM>的中断绑定至 CPU 运算核 2(对应掩码为4,即 2 2 2^2 22):bashecho 4 | sudo tee /proc/irq/<IRQ_NUM>/smp_affinity -
通过列表格式将 IRQ 号为
<IRQ_NUM>的中断绑定至 CPU 运算核 2 与 3:bashecho 2-3 | sudo tee /proc/irq/<IRQ_NUM>/smp_affinity_list
确定中断与硬件设备的对应关系、实现中断的最优分配,需要对系统硬件配置与业务负载有深入的理解。irqbalance 工具可实现中断在 CPU 运算核间的自动均衡分配,而手动调整在部分场景下可实现更优的性能表现。
Linux 内核优化关键领域雷达图
以下雷达图展示了 Linux 内核优化的多个关键领域,以及各领域对系统性能的潜在影响程度与实施的相对复杂度。评分基于通用场景的主观评估,具体结果会因系统硬件配置与业务负载存在差异。"影响力评分"越高,代表该领域对性能提升的潜在作用越大;"复杂度评分"越高,代表该领域的实施与配置难度越大。
从图中可看出,定制化编译内核对性能的潜在影响程度较高,但实施复杂度也相对较高;相比之下,参数调优与内存管理的性能影响程度同样较高,且实施难度相对较低。开展内核优化决策时,需综合权衡各领域的影响程度与实施复杂度。
Linux 内核优化整体概念图
下图通过思维导图的形式,概述了 Linux 内核优化的主要方向与相互关联的技术要点,可助力使用者从宏观层面理解内核优化的整体体系。
Linux 内核优化
(Linux Kernel Optimization)
内核版本选择
(Kernel Version Selection)
LTS (长期支持)
Mainline (主线)
Real-time (实时)
内核参数调优
(Parameter Tuning)
sysctl & /proc
CPU 调度
(kernel.sched_*)
内存管理
(vm.*)
vm.swappiness
vm.dirty_ratio
网络协议栈
(net.*)
net.core.somaxconn
net.ipv4.tcp_max_syn_backlog
文件系统
(fs.*, mount options)
noatime
定制内核编译
(Custom Kernel Compilation)
移除模块/驱动
处理器特定优化
make menuconfig
应用补丁
I/O 优化
(I/O Optimization)
I/O 调度器
(noop, deadline, cfq, bfq, kyber)
文件系统选择
(ext4, XFS, Btrfs)
挂载选项
CPU 与中断优化
(CPU & Interrupt Optimization)
CPU 亲和性 (taskset)
IRQ 绑定 (smp_affinity)
节能特性调整
监控与诊断
(Monitoring & Diagnosis)
性能工具
(top, htop, vmstat, iostat, perf, ftrace)
日志分析
(dmesg, journalctl)
基准测试
(sysbench, fio)
安全性与稳定性
(Security & Stability)
内核安全模块
(SELinux, AppArmor)
资源限制 (ulimit)
实践方法
(Best Practices)
备份配置
渐进调整
充分测试
此概念图清晰展示了从内核版本选择到参数精细化调整,再到高级定制编译与系统监控的完整优化流程与技术点。
- Tuning Linux for Performance - I Wanna Go Fast! - Anthony Nocentino - PSConfEU 2023 - YouTube
https://www.youtube.com/watch?v=RMtyLCQLHzE
视频:Tuning Linux for Performance - I Wanna Go Fast! - Anthony Nocentino (英文)。该视频探讨了 Linux 性能调优的多个方向,包括内核参数配置与性能工具的使用,为实际调优操作提供了参考依据。
观看此类专业分享内容,可助力使用者更深入理解性能调优的实际挑战与解决方案。视频内容通常会结合具体案例与工具演示,帮助使用者将理论知识落地至实际操作。
监控、诊断与实施规范
内核优化的有效落地,依赖于精细化的系统监控、精准的性能瓶颈诊断与标准化的实施规范。
性能监控与诊断工具
在开展任何优化操作的前后,均需通过性能监控工具识别系统性能瓶颈、评估优化实施效果,常用工具分为基础命令行工具与高级性能分析工具两类:
- 基础命令行工具 :
top/htop: 实时展示系统进程的资源占用情况(CPU、内存)。vmstat: 报告系统虚拟内存统计信息,包括进程状态、内存使用、页面交换、块 I/O、陷阱与 CPU 活动。iostat: 报告 CPU 统计信息与设备/分区的输入/输出统计信息。free: 展示系统物理内存与交换内存的可用、已用总量。sar (System Activity Reporter): 实现系统活动信息的收集、报告与保存,功能覆盖全面。dmesg: 展示内核环形缓冲区内容,助力硬件与驱动问题的诊断。journalctl: 实现 systemd 日志的查询与展示。
- 高级性能分析工具 :
perf: Linux 原生性能分析工具,支持 CPU 性能计数器、跟踪点、kprobes 与 uprobes 的分析。ftrace: 内核内置的跟踪框架,适用于内核函数调用、延迟等指标的分析。SystemTap: 基于脚本语言的动态监控工具,支持对运行中的 Linux 内核进行实时监测与跟踪。eBPF (extended Berkeley Packet Filter): 内核级技术,支持在内核空间安全执行自定义代码,适用于网络监控、系统跟踪、安全防护等场景,BCC 与 bpftrace 是基于 eBPF 的常用工具。
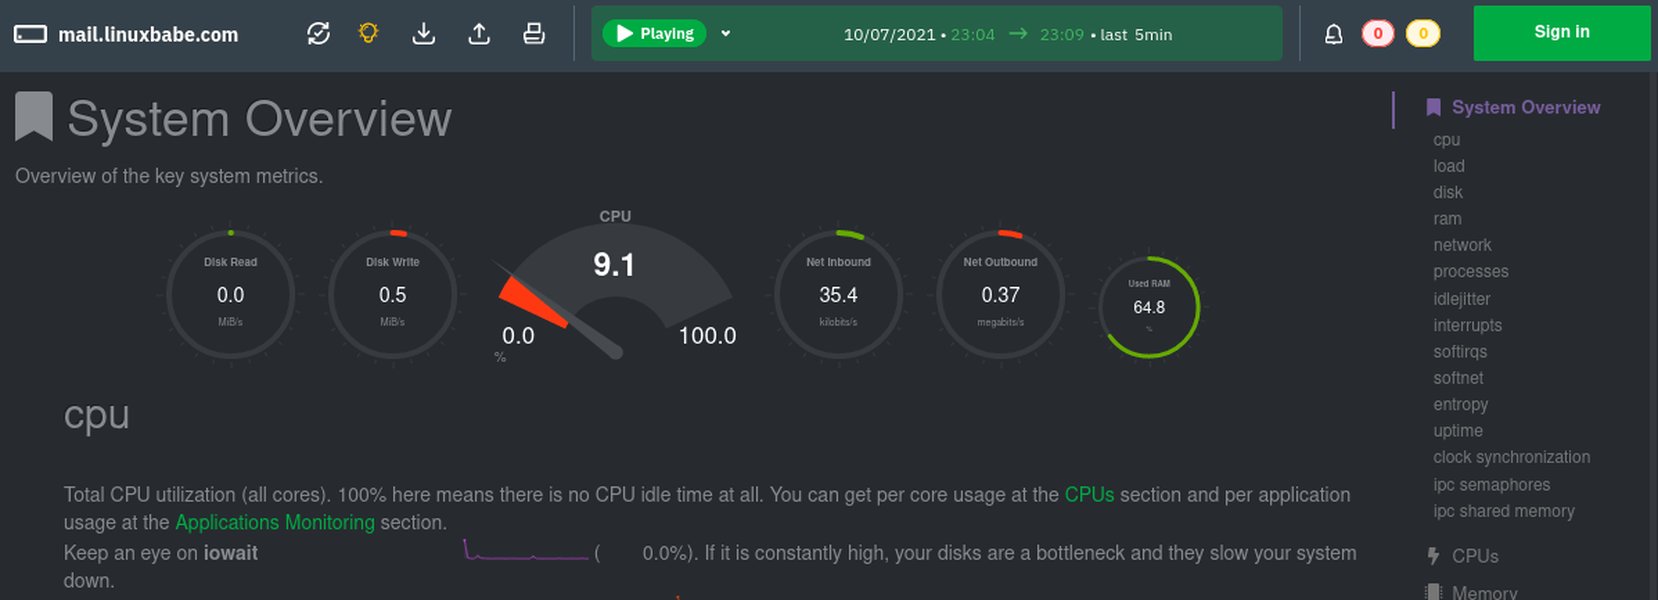
Netdata 等工具可提供直观的实时性能监控仪表盘。
内核优化实施规范
- 明确优化目标:开展优化操作前,需明确具体的优化目标(如降低系统延迟、提升网络吞吐量、减少资源消耗)。
- 分析业务负载:不同的应用场景与业务负载(CPU 密集型、I/O 密集型、网络密集型)需匹配差异化的优化策略,优化前需完成对业务负载的精准分析。
- 优先备份配置:对内核参数或系统配置进行重大修改前,务必备份系统配置与重要数据;尤其是编译新内核时,需确保旧内核仍可作为引导选项。
- 分步实施、渐进调整:单次仅修改一个或一组相关参数,便于判断参数修改对系统性能的实际影响,定位问题根源。
- 充分测试与验证:所有优化措施在生产环境部署前,需在测试环境中完成充分的测试与基准评估,测试环境需模拟生产环境的业务负载。
- 文档化所有更改:记录每一次配置修改的内容、修改原因与实际效果,为后续的故障排查与进一步优化提供依据。
- 保持系统更新:定期更新 Linux 发行版与内核版本,新版本通常包含性能改进与安全修复内容。
- 自动化配置管理:针对多服务器部署的环境,可使用 Ansible、Puppet、Chef 等配置管理工具,实现内核参数的统一部署与管理,保障配置的一致性。
- 参考官方文档与社区经验:Linux 内核与相关工具的官方文档是重要的参考资源,积极参与社区讨论,可学习行业内的实操经验。
via:
- Linux Kernel Optimization - GeeksforGeeks
https://www.geeksforgeeks.org/linux-unix/linux-kernel-optimization/ - Tune Up: Optimizing Linux Performance | DigitalOcean
https://www.digitalocean.com/community/tutorials/tuning-linux-performance-optimization - Ithy - 释放 Linux 潜能:终极内核优化指南
https://ithy.com/article/linux-kernel-optimization-guide-8biz9ekn