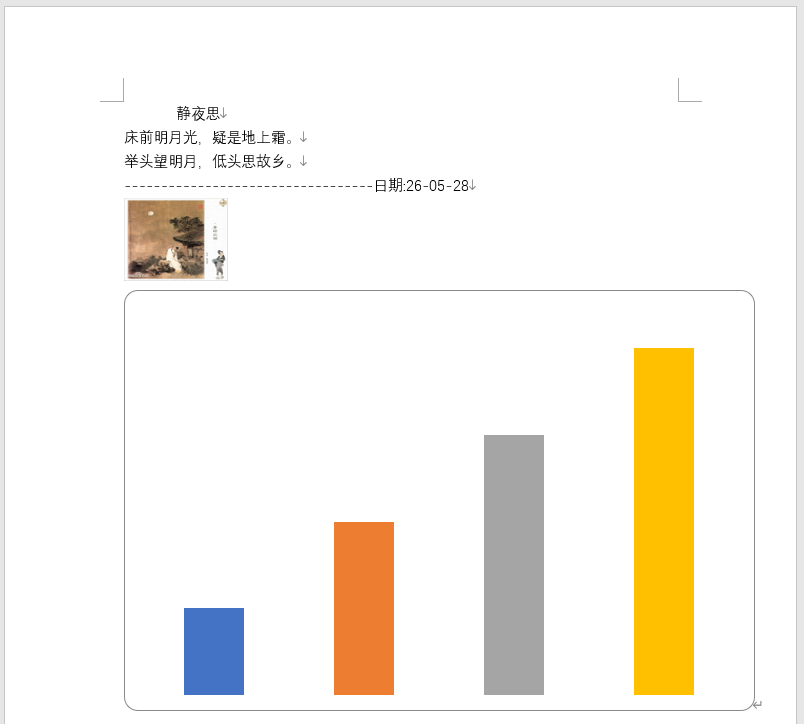
使用图形类Drawing不仅可以将图片保存到word文档,还能将图表、表格等数据保存到word文档,关键就在于其子类型GraphicData支持关联多种类型的图形数据,本文记录以嵌入式布局方式向word中插入图表的基本用法。
主要代码如下所示:
csharp
using A = DocumentFormat.OpenXml.Drawing;
using C=DocumentFormat.OpenXml.Drawing.Charts;
using DW = DocumentFormat.OpenXml.Drawing.Wordprocessing;

if(cbInsertChart.Checked)
{
    ChartPart chartPart = mainPart.AddNewPart<ChartPart>();
    string chartPartId = mainPart.GetIdOfPart(chartPart);

    Drawing drawing = CreateChartDrawing(chartPartId, chartPart);
    run.Append(drawing);
}

public Drawing CreateChartDrawing(string relationshipId, ChartPart chartPart)
{
    var chartSpace = new C.ChartSpace();
    chartSpace.AddNamespaceDeclaration("c", "http://schemas.openxmlformats.org/drawingml/2006/chart");
    chartSpace.AddNamespaceDeclaration("r", "http://schemas.openxmlformats.org/officeDocument/2006/relationships");
    chartSpace.AppendChild(new C.EditingLanguage { Val = "zh-CN" });

    var chart = new C.Chart();
    chart.AppendChild(new C.AutoTitleDeleted { Val = true });

    var plotArea = new C.PlotArea();

    var barChart = new C.BarChart(
        new C.BarDirection { Val = C.BarDirectionValues.Column },
        new C.BarGrouping { Val = C.BarGroupingValues.Clustered },
        new C.VaryColors { Val = true }
    );

    var series = new C.BarChartSeries(
        new C.Index { Val = 0 },
        new C.Order { Val = 0 },
        new C.SeriesText(new C.NumericValue("测试数据"))
    );

    series.AppendChild(new C.CategoryAxisData(
        new C.StringLiteral(
            new C.PointCount { Val = 4 },
            new C.StringPoint { Index = 0, NumericValue = new C.NumericValue("A") },
            new C.StringPoint { Index = 1, NumericValue = new C.NumericValue("B") },
            new C.StringPoint { Index = 2, NumericValue = new C.NumericValue("C") },
            new C.StringPoint { Index = 3, NumericValue = new C.NumericValue("D") }
        )
    ));

    series.AppendChild(new C.Values(
        new C.NumberLiteral(
            new C.PointCount { Val = 4 },
            new C.NumericPoint { Index = 0, NumericValue = new C.NumericValue("10") },
            new C.NumericPoint { Index = 1, NumericValue = new C.NumericValue("20") },
            new C.NumericPoint { Index = 2, NumericValue = new C.NumericValue("30") },
            new C.NumericPoint { Index = 3, NumericValue = new C.NumericValue("40") }
        )
    ));

    barChart.AppendChild(series);

    // 坐标轴
    var catAxis = new C.CategoryAxis(
        new C.AxisId { Val = 100 },
        new C.Scaling(new C.Orientation { Val = C.OrientationValues.MinMax }),
        new C.AxisPosition { Val = C.AxisPositionValues.Bottom },
        new C.CrossingAxis { Val = 200 },
        new C.Crosses { Val = C.CrossesValues.AutoZero },
        new C.TickLabelPosition { Val = C.TickLabelPositionValues.NextTo }
    );

    var valAxis = new C.ValueAxis(
        new C.AxisId { Val = 200 },
        new C.Scaling(new C.Orientation { Val = C.OrientationValues.MinMax }),
        new C.AxisPosition { Val = C.AxisPositionValues.Left },
        new C.CrossingAxis { Val = 100 },
        new C.Crosses { Val = C.CrossesValues.AutoZero },
        new C.TickLabelPosition { Val = C.TickLabelPositionValues.NextTo },
        new C.MajorTickMark { Val = C.TickMarkValues.None },
        new C.MinorTickMark { Val = C.TickMarkValues.None }
    );

    // 让BarChart引用坐标轴ID
    barChart.AppendChild(new C.AxisId { Val = 100 });
    barChart.AppendChild(new C.AxisId { Val = 200 });

    plotArea.Append(barChart, catAxis, valAxis);
    chart.Append(plotArea);

    chartSpace.AppendChild(chart);
    chartSpace.Save(chartPart);

    return new Drawing(
        new DW.Inline(
            new DW.Extent { Cx = 6000000, Cy = 4000000 },
            new DW.EffectExtent { LeftEdge = 0L, TopEdge = 0L, RightEdge = 0L, BottomEdge = 0L },
            new DW.DocProperties { Id = 1, Name = "Chart 1" },
            new DW.NonVisualGraphicFrameDrawingProperties(
                new A.GraphicFrameLocks { NoChangeAspect = true }
            ),
            new A.Graphic(
                new A.GraphicData(
                    new C.ChartReference { Id = relationshipId }
                )
                { Uri = "http://schemas.openxmlformats.org/drawingml/2006/chart" }
            )
        )
    );
}
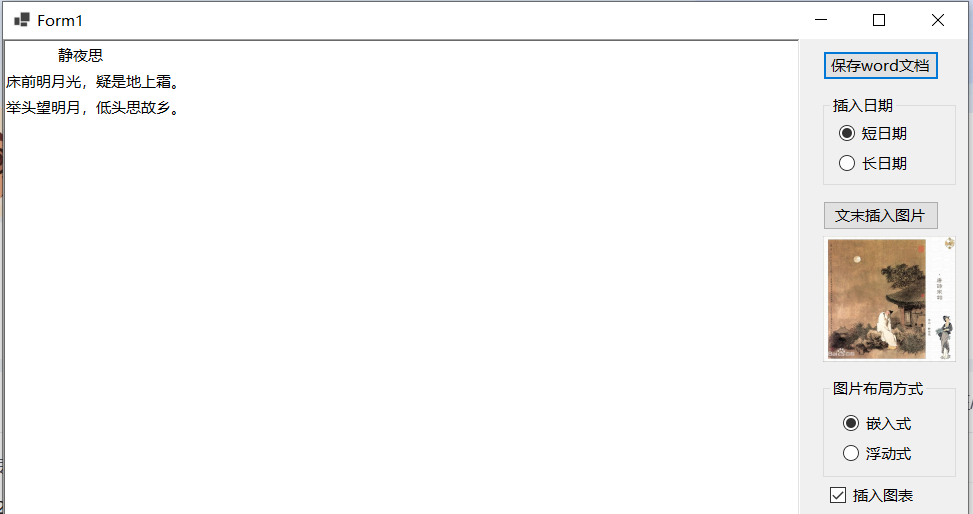
下面的截图是程序运行效果及word文档的内容截图。
参考文献
1https://github.com/dotnet/Open-XML-SDK
2https://learn.microsoft.com/zh-cn/office/open-xml/open-xml-sdk