前话:ai的发展已经让我这个前端程序媛,不再想深究技术了。这份工作结束后,就和前端及计算机行业say goodbye 了!
需求:
左侧是拓扑图上的一些内容,中间是拓扑图拖拽后展示编辑的画板canvas
效果图:
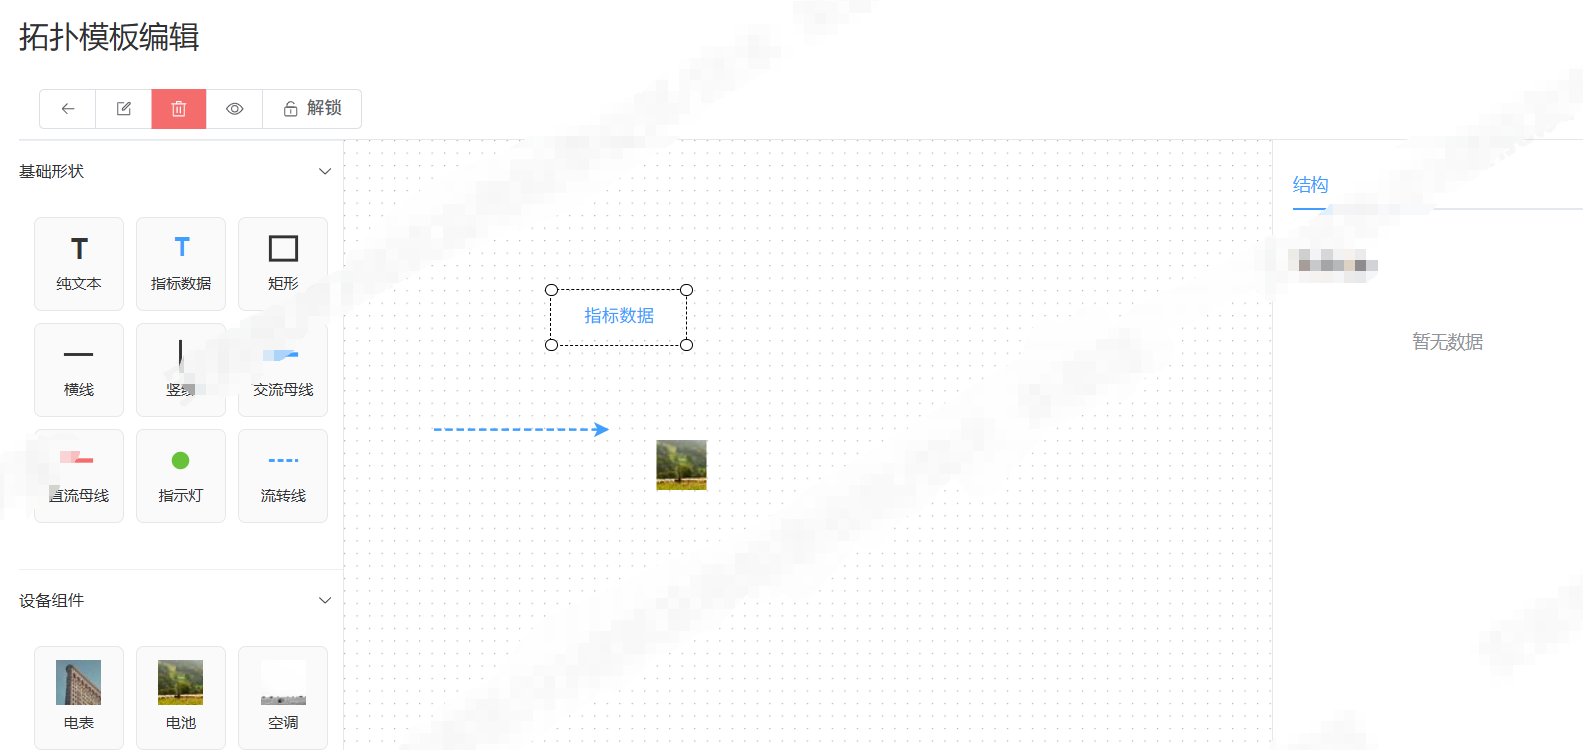
功能:
- 可拖拽
- 可调整线的长短方向
- 可保存JSON数据
- 可线对齐
- 代码如下:不完整,额外配置代码我贴在后面
javascript
<template>
  <div class="topo-editor">
    <div class="topo-toolbar">
      <el-button-group>
        <el-button icon="Back" @click="handleUndo" title="撤销"></el-button>
        <el-button icon="Edit" @click="handleRedo" title="重做"></el-button>
        <el-button icon="Delete" type="danger" @click="handleClear" title="清空"></el-button>
        <el-button icon="View" @click="handlePreview" title="预览"></el-button>
        <el-button :icon="graph?.value?.isSelectingEnabled() ? 'Lock' : 'Unlock'" @click="toggleLock">
          {{ graph?.value?.isSelectingEnabled() ? '锁定' : '解锁' }}
        </el-button>
      </el-button-group>
    </div>

    <div class="topo-body">
      <div class="topo-sidebar">
        <el-collapse v-model="activeCollapse">
          <el-collapse-item title="基础形状" name="basic">
            <div class="comp-grid">
              <div v-for="item in basicShapes" :key="item.type" class="comp-item" draggable="true"
                @dragstart="handleDragStart($event, item)">
                <svg viewBox="0 0 24 24" width="28" height="28">
                  <text v-if="item.type === 'text'" x="6" y="19" font-size="20" fill="#333" font-weight="bold">T</text>
                  <g v-else-if="item.type === 'indicator-data'">
                    <text x="7" y="17" font-size="18" fill="#409eff" font-weight="bold">T</text>
                  </g>
                  <rect v-else-if="item.type === 'rect'" x="3" y="4" width="18" height="16" stroke="#333"
                    stroke-width="2" fill="none" />
                  <line v-else-if="item.type === 'line-h'" x1="2" y1="12" x2="22" y2="12" stroke="#333"
                    stroke-width="2" />
                  <line v-else-if="item.type === 'line-v'" x1="12" y1="2" x2="12" y2="22" stroke="#333"
                    stroke-width="2" />
                  <line v-else-if="item.type === 'bus-ac'" x1="2" y1="12" x2="22" y2="12" stroke="#409eff"
                    stroke-width="3" />
                  <line v-else-if="item.type === 'bus-dc'" x1="2" y1="12" x2="22" y2="12" stroke="#f56c6c"
                    stroke-width="3" />
                  <circle v-else-if="item.type === 'indicator'" cx="12" cy="12" r="6" fill="#67c23a" />
                  <line v-else-if="item.type === 'flow-line'" x1="2" y1="12" x2="22" y2="12" stroke="#409eff"
                    stroke-width="2" stroke-dasharray="4,2" />
                </svg>
                <span class="comp-label">{{ item.label }}</span>
              </div>
            </div>
          </el-collapse-item>

          <el-collapse-item title="设备组件" name="device">
            <div class="comp-grid">
              <div v-for="item in deviceList" :key="item.type" class="comp-item" draggable="true"
                @dragstart="handleDragStart($event, item)">
                <img :src="item.icon" alt="" class="comp-img" />
                <span class="comp-label">{{ item.label }}</span>
              </div>
            </div>
          </el-collapse-item>
        </el-collapse>
      </div>

      <div class="topo-canvas" @drop="handleDrop" @dragover="handleDragOver">
        <div ref="graphContainer" class="graph-container"></div>
      </div>

      <div class="topo-right">
        <el-tabs v-model="activeTab">
          <el-tab-pane label="结构" name="structure">
            <div class="tree-panel">
              <h4>节点列表</h4>
              <el-tree :data="treeData" node-key="id" default-expand-all @node-click="handleTreeClick" />
            </div>
          </el-tab-pane>
        </el-tabs>
      </div>
    </div>

    <el-dialog v-model="previewVisible" title="拓扑预览" width="85%" top="5vh">
      <div ref="previewContainer" style="width:100%;height:600px;"></div>
    </el-dialog>
  </div>
</template>

<script setup>
import { ref, nextTick, onMounted, onUnmounted, computed } from 'vue'
import { Graph, Transform } from '@antv/x6'
import { ElMessage, ElMessageBox } from 'element-plus'
import { Back, Edit, Delete, View, Lock, Unlock } from '@element-plus/icons-vue'

const graphContainer = ref(null)
const previewContainer = ref(null)
const graph = ref(null)
const previewGraph = ref(null)
const previewVisible = ref(false)
const activeCollapse = ref(['basic'])
const activeTab = ref('structure')
const originLineStyleMap = new Map()
const transformOptions = ref({
  enabled: true,
  minWidth: 1,
  maxWidth: 200,
  minHeight: 1,
  maxHeight: 150,
  orthogonal: false,
  restrict: false,
  preserveAspectRatio: false,
})

const basicShapes = [
  { type: 'text', label: '纯文本' },
  { type: 'indicator-data', label: '指标数据' },
  { type: 'rect', label: '矩形' },
  { type: 'line-h', label: '横线' },
  { type: 'line-v', label: '竖线' },
  { type: 'bus-ac', label: '交流母线' },
  { type: 'bus-dc', label: '直流母线' },
  { type: 'indicator', label: '指示灯' },
  { type: 'flow-line', label: '流转线' },
]

const deviceList = ref([
  { type: 'meter', label: '电表', icon: 'https://picsum.photos/40/40?3' },
  { type: 'battery', label: '电池', icon: 'https://picsum.photos/40/40?4' },
  { type: 'ac', label: '空调', icon: 'https://picsum.photos/40/40?5' },
])

const treeData = computed(() => {
  if (!graph.value) return []
  return graph.value.getNodes().map(n => ({
    id: n.id,
    label: n.getData()?.label || n.id,
  }))
})

// 初始化画布
const initGraph = () => {
  if (graph.value) graph.value.dispose()

  graph.value = new Graph({
    container: graphContainer.value,
    width: graphContainer.value.offsetWidth,
    height: graphContainer.value.offsetHeight,
    grid: { visible: true, size: 10 },
    panning: true,
    mousewheel: { enabled: true, modifiers: ['ctrl'] },
    snapline: true,
    clipboard: true,
    history: true,
    selecting: {
      enabled: true,
      multiple: true,
      rubberband: true,
      showNodeSelectionBox: false,
      click: true,
    },
    resizing: { enabled: true },
    rotating: true,
  })

  graph.value.use(
    new Transform({
      resizing: transformOptions.value,
    })
  )

  // 线条选中高亮
  graph.value.on('edge:selected', ({ edge }) => {
    const line = edge.attr('line')
    if (line && !originLineStyleMap.has(edge.id)) {
      originLineStyleMap.set(edge.id, {
        stroke: line.stroke,
        strokeWidth: line.strokeWidth,
        strokeDasharray: line.strokeDasharray
      })
    }
    edge.attr('line', { stroke: '#ff7d00', strokeWidth: 3 })
    edge.addTools([{ name: 'vertices', args: { size: 8, fill: '#1677ff', stroke: '#fff' } }])
  })
  graph.value.on('edge:unselected', ({ edge }) => {
    const origin = originLineStyleMap.get(edge.id)
    if (origin) {
      edge.attr('line', origin)
      originLineStyleMap.delete(edge.id)
    }
    edge.removeTools()
  })

  // ==============================================
  // 双击:开启编辑 + 蓝色边框 + 可调整大小
  // ==============================================
  graph.value.on('node:dblclick', ({ node }) => {
  })

  // ==============================================
  // 退出编辑:恢复原样
  // ==============================================
  graph.value.on('node:editor:hide', ({ node }) => {

  })

  // mouse效果
  graph.value.on('node:mouseenter', ({ node }) => {
    console.log('node:mouseenter', node)
    // 开启缩放
    // node.addTools({ name: 'resize' })
    // 蓝色高亮边框
    node.attr('body/stroke', '#1677ff')
    node.attr('body/strokeWidth', 2)
    // node.setResizable(true)  //鼠标移入开启缩放
  })
  graph.value.on('node:mouseleave', ({ node }) => {
    console.log('node:mouseleave', node.getData())
    const nodeData = node.getData()
    // node.removeTools(['node-editor', 'resize'])
    // node.setResizable(false) //鼠标移出关闭缩放
    if (nodeData.type == 'rect') {
      node.attr('body/stroke', '#333')
    } else {
      node.attr('body/stroke', '#fff')
      node.attr('body/strokeWidth', 0)
    }
  })

  // 空白取消
  graph.value.on('blank:click', () => {
    graph.value.cleanSelection()
  })
}

// 拖拽
const handleDragStart = (e, item) => {
  e.dataTransfer.setData('type', item.type)
  e.dataTransfer.setData('label', item.label)
}
const handleDragOver = (e) => e.preventDefault()
const handleDrop = (e) => {
  e.preventDefault()
  const type = e.dataTransfer.getData('type')
  const label = e.dataTransfer.getData('label')
  const rect = graphContainer.value.getBoundingClientRect()
  const x = e.clientX - rect.left
  const y = e.clientY - rect.top
  addElement(type, label, x, y)
}

// 添加元素
const addElement = (type, label, x, y) => {
  const edgeTypes = ['line-h', 'line-v', 'bus-ac', 'bus-dc', 'flow-line']
  if (edgeTypes.includes(type)) {
    const len = 70
    let sx = x - len, sy = y, tx = x + len, ty = y
    let stroke = '#333', strokeWidth = 2, dash = null
    if (type === 'bus-ac') { stroke = '#409eff'; strokeWidth = 3 }
    if (type === 'bus-dc') { stroke = '#f56c6c'; strokeWidth = 3 }
    if (type === 'flow-line') { stroke = '#409eff'; strokeWidth = 2; dash = '6 3' }
    graph.value.addEdge({
      source: { x: sx, y: sy },
      target: { x: tx, y: ty },
      attrs: { line: { stroke, strokeWidth, strokeDasharray: dash } },
    })
  } else if (type === 'text') {
    graph.value.addNode({
      x, y, width: 100, height: 40, label: '点击编辑',
      attrs: { body: { stroke: '#8f8f8f', strokeWidth: 0, fill: '#fff', rx: 6, ry: 6 } },
      tools: ['node-editor'],
      data: {
        type: 'text',        // 你自定义的类型:ems/pcs/battery...
      }

    })
  } else if (type === 'indicator-data') {
    graph.value.addNode({
      x, y, width: 100, height: 36, label: '指标数据',
      attrs: {
        body: { stroke: '#409eff', strokeWidth: 0, fill: '#fff', rx: 6, ry: 6 },
        text: { fill: '#409eff' }
      },
      tools: ['node-editor'],
      data: {
        type: 'indicator-data',        // 你自定义的类型:ems/pcs/battery...
      }
    })
  } else if (type === 'rect') {
    graph.value.addNode({
      x, y, width: 100, height: 36,
      attrs: { body: { stroke: '#333', fill: '#fff', strokeWidth: 2 } },
      data: {
        type: 'rect',        // 你自定义的类型:ems/pcs/battery...
      }
    })
  } else if (type === 'indicator') {
    graph.value.addNode({
      x, y, width: 24, height: 24, shape: 'circle',
      attrs: { body: { fill: '#67c23a' } }
    })
  } else {
    const dev = deviceList.value.find(d => d.type === type)
    graph.value.addNode({
      shape: 'image', x, y, width: 40, height: 40,
      attrs: { image: { 'xlink:href': dev.icon } }
    })
  }
  ElMessage.success(`添加:${label}`)
}

// 工具栏
const handleUndo = () => graph.value.history.undo()
const handleRedo = () => graph.value.history.redo()
const handleClear = async () => {
  await ElMessageBox.confirm('确认清空全部画布内容?')
  graph.value.clearCells()
}
const toggleLock = () => {
  const locked = !graph.value.isSelectingEnabled()
  graph.value.setSelecting(!locked)
  graph.value.setPanning(!locked)
  ElMessage.success(locked ? '画布已锁定' : '画布已解锁')
}
const handleTreeClick = (treeNode) => graph.value.centerCell(treeNode.id)
const handlePreview = () => {
  previewVisible.value = true
  nextTick(() => {
    if (previewGraph.value) previewGraph.value.dispose()
    previewGraph.value = new Graph({
      container: previewContainer.value,
      width: previewContainer.value.offsetWidth,
      height: 580,
      panning: true, mousewheel: true
    })
    previewGraph.value.fromJSON(graph.value.toJSON())
  })
}

onMounted(initGraph)
onUnmounted(() => {
  graph.value?.dispose()
  previewGraph.value?.dispose()
})
</script>

<style scoped lang="scss">
.topo-editor {
  width: 100%;
  height: calc(100vh - 84px);
  display: flex;
  flex-direction: column;
  background: #f5f5f5;
}

.topo-toolbar {
  height: 50px;
  background: #fff;
  padding: 0 16px;
  border-bottom: 1px solid #e5e7eb;
  display: flex;
  align-items: center;
}

.topo-body {
  flex: 1;
  display: flex;
  overflow: hidden;
}

.topo-sidebar {
  width: 260px;
  background: #fff;
  border-right: 1px solid #e5e7eb;
}

.comp-grid {
  display: grid;
  grid-template-columns: repeat(3, 1fr);
  gap: 10px;
  padding: 12px;
}

.comp-item {
  display: flex;
  flex-direction: column;
  align-items: center;
  padding: 10px;
  border: 1px solid #e5e7eb;
  border-radius: 6px;
  cursor: grab;
  background: #fafafa;
}

.comp-item:hover {
  border-color: #409eff;
  background: #ecf5ff;
}

.comp-img {
  width: 36px;
  height: 36px;
  object-fit: contain;
}

.comp-label {
  font-size: 12px;
  margin-top: 4px;
}

.topo-canvas {
  flex: 1;
  background: #fff;
  position: relative;
}

.graph-container {
  width: 100%;
  height: 100%;
}

.topo-right {
  width: 280px;
  background: #fff;
  border-left: 1px solid #e5e7eb;
  padding: 16px;
}
</style>
hover高亮效果:
在createGraph代码中添加
javascript
  // 线条hover端点
  graph.value.on('edge:mouseenter', ({ edge }) => {
    edge.setTools([
      { name: 'source-arrowhead', args: { attrs: { fill: '#409eff', stroke: '#fff', r: 5 } } },
      { name: 'target-arrowhead', args: { attrs: { fill: '#409eff', stroke: '#fff', r: 5 } } },
    ])
  })
  graph.value.on('edge:mouseleave', ({ edge }) => edge.setTools([]))

  // 节点hover边框
  graph.value.on('node:mouseenter', ({ node }) => {
    node.attr('body/stroke', '#409eff')
    node.attr('body/strokeWidth', 1)
  })
  graph.value.on('node:mouseleave', ({ node }) => {
    const d = node.getData()
    node.attr('body/stroke', d?.type === 'rect' ? '#e5e7eb' : 'none')
  })
拖拽显示对齐线:
在createGraph方法中
javascript
import { Graph, Transform, Snapline } from '@antv/x6'
  graph.value.use(new Snapline({ enabled: true }))
完善功能版本:
右键可以显示菜单,可放大缩小选中内容,画布内容回显
javascript
<template>
  <div class="topo-editor">
    <TopoToolbar :locked="locked" @undo="handleUndo" @redo="handleRedo" @save="handleSave" @clear="handleClear"
      @preview="handlePreview" @lock="toggleLock" />
    <div class="topo-body">

      <TopoLeft style="height:50vh;overflow: auto;" :basic-shapes="basicShapes" :device-list="deviceList" />
      <div class="topo-canvas" @drop="handleDrop" @dragover="handleDragOver">
        <div ref="graphContainer" class="graph-container"></div>

        <div v-if="contextMenu.show" class="context-menu"
          :style="{ left: contextMenu.x + 'px', top: contextMenu.y + 'px' }">
          <div class="menu-item" @click="toTop">置顶</div>
          <div class="menu-item" @click="toBottom">置底</div>
          <div class="menu-item" @click="moveUp">上移一层</div>
          <div class="menu-item" @click="moveDown">下移一层</div>
          <div class="menu-item del" @click="delCell">删除</div>
        </div>
      </div>

      <!-- 右侧属性面板 -->
      <TopoRight ref="topoRightRef" :tree-data="treeData" :selected-cell="selectedCell" :data-field-list="dataFieldList"
        :template-form="templateForm" @toggle-visible="toggleCellVisible" @tree-hover="handleTreeHover"
        @tree-leave="handleTreeLeave" @save-device-point-id="handleSaveDevicePointId" />
    </div>

    <el-dialog v-model="previewVisible" title="拓扑预览" width="85%" top="5vh">
      <div ref="previewContainer" style="width:100%;height:600px;text-align: center;"></div>
    </el-dialog>
  </div>
</template>

<script setup>
import { ref, nextTick, onMounted, onUnmounted, computed, watch } from 'vue'
import { Graph, Transform, Snapline } from '@antv/x6'
import { ElMessage, ElMessageBox } from 'element-plus'
import { listComponent } from '@/api/template/index.js'
import { getDeviceTypeList } from '@/api/station/device.js'

import TopoToolbar from './TopoToolbar.vue'
import TopoLeft from './TopoLeft.vue'
import TopoRight from './TopoRight.vue'

const emit = defineEmits(['select-cell'])
// 接收父组件传递的模板表单数据
const props = defineProps({
  templateForm: {
    type: Object,
    default: () => ({
      templateName: '',
      remark: ''
    })
  }
})

const graphContainer = ref(null)
const previewContainer = ref(null)
const graph = ref(null)
const previewGraph = ref(null)
const previewVisible = ref(false)
const locked = ref(false)
const selectCell = ref(null)
const contextMenu = ref({ show: false, x: 0, y: 0 })
const isInitialized = ref(false)

// 右侧面板相关
const topoRightRef = ref(null)
const selectedCell = ref(null)
const treeData = ref([])
const dataFieldList = ref([])

// 使用 props 或本地状态
const templateForm = computed(() => {
  return props.templateForm || {
    templateName: '',
    remark: ''
  }
})

const transformOptions = ref({
  enabled: true,
  minWidth: 1, maxWidth: 200, minHeight: 1, maxHeight: 150,
})

const basicShapes = [
  { type: 'text', compLabel: '纯文本' },
  { type: 'indicator-data', compLabel: '数据采集器' },
  { type: 'rect', compLabel: '矩形框' },
  { type: 'line-h', compLabel: '普通横线' },
  { type: 'line-v', compLabel: '普通竖线' },
  { type: 'bus-ac', compLabel: '主母线(交流)' },
  { type: 'bus-dc', compLabel: '主母线(直流)' },
  { type: 'indicator', compLabel: '指示灯' },
  { type: 'flow-line', compLabel: '数据流连线' },
]

const deviceList = ref([])

/** 获取设备类型列表 */
const loadDataFields = async () => {
  try {
    const res = await getDeviceTypeList()
    dataFieldList.value = res.data || []
  } catch (error) {
    console.error('获取设备类型列表失败:', error)
  }
}

const refreshTree = () => {
  if (!graph.value) return
  console.log('treeData:', graph.value.getNodes())
  const nodes = graph.value.getNodes().map(n => ({
    id: n.id,
    label: n.getData().label + n.id.slice(4, 8),
    type: 'node',
    visible: n.isVisible()
  }))
  const edges = graph.value.getEdges().map(e => ({
    id: e.id,
    label: '连线-' + e.id.slice(4, 8),
    type: 'edge',
    visible: e.isVisible()
  }))
  treeData.value = [...nodes, ...edges]
}

const initGraph = () => {
  if (!graphContainer.value) {
    console.warn('Graph container not ready')
    return
  }

  const checkSize = () => {
    const width = graphContainer.value.offsetWidth
    const height = graphContainer.value.offsetHeight
    return !(width === 0 || height === 0)
  }

  if (!checkSize()) {
    setTimeout(() => {
      if (checkSize()) createGraph()
      else setTimeout(() => checkSize() && createGraph(), 200)
    }, 100)
    return
  }

  createGraph()
}

const createGraph = () => {
  if (graph.value) graph.value.dispose()
  graph.value = new Graph({
    container: graphContainer.value,
    width: graphContainer.value.offsetWidth,
    height: graphContainer.value.offsetHeight,
    grid: { visible: false },
    panning: false,
    mousewheel: { enabled: true, modifiers: ['ctrl'] },
    snapline: { enabled: true },
    clipboard: true,
    history: true,
    selecting: { enabled: true, multiple: true, rubberband: true },
    resizing: { enabled: true },
    rotating: true,
    interacting: { edgeMovable: true, vertexMovable: true },
  })

  graph.value.use(new Transform({ resizing: transformOptions.value }))
  graph.value.use(new Snapline({ enabled: true }))

  // 线条hover端点
  graph.value.on('edge:mouseenter', ({ edge }) => {
    edge.setTools([
      { name: 'source-arrowhead', args: { attrs: { fill: '#409eff', stroke: '#fff', r: 5 } } },
      { name: 'target-arrowhead', args: { attrs: { fill: '#409eff', stroke: '#fff', r: 5 } } },
    ])
  })
  graph.value.on('edge:mouseleave', ({ edge }) => edge.setTools([]))

  // 节点hover边框
  graph.value.on('node:mouseenter', ({ node }) => {
    node.attr('body/stroke', '#409eff')
    node.attr('body/strokeWidth', 1)
  })
  graph.value.on('node:mouseleave', ({ node }) => {
    const d = node.getData()
    node.attr('body/stroke', d?.type === 'rect' ? '#e5e7eb' : 'none')
  })

  // 增删刷新树
  graph.value.on('node:added', refreshTree)
  graph.value.on('node:removed', refreshTree)
  graph.value.on('edge:added', refreshTree)
  graph.value.on('edge:removed', refreshTree)

  // 空白点击清空选中
  graph.value.on('blank:click', () => {
    contextMenu.value.show = false
    selectedCell.value = null
    emit('select-cell', null)
  })

  // 节点选中
  graph.value.on('node:click', ({ node }) => {
    selectedCell.value = node
    emit('select-cell', node)
  })
  graph.value.on('edge:click', ({ edge }) => {
    selectedCell.value = edge
    emit('select-cell', edge)
  })

  // 右键菜单
  graph.value.on('cell:contextmenu', ({ cell, e }) => {
    e.preventDefault()
    selectCell.value = cell
    contextMenu.value = { show: true, x: e.clientX, y: e.clientY }
  })

  isInitialized.value = true
}

const handleDragOver = (e) => {
  e.preventDefault()
  e.dataTransfer.dropEffect = (isInitialized.value && graph.value) ? 'copy' : 'none'
}

const handleDrop = (e) => {
  e.preventDefault()
  if (!isInitialized.value || !graph.value) return

  try {
    const item = JSON.parse(e.dataTransfer.getData('text/plain'))
    const rect = graphContainer.value.getBoundingClientRect()
    const x = e.clientX - rect.left
    const y = e.clientY - rect.top
    const elementType = item.type || item.id
    const elementLabel = item.compLabel || item.label
    addElement(elementType, elementLabel, x, y)
  } catch (err) {
    console.error('拖拽失败', err)
  }
}

const addElement = (type, label, x, y) => {
  if (type === 'line-h' || type === 'bus-ac' || type === 'bus-dc') {
    const l = 160
    const stroke = type === 'bus-ac' ? '#1677ff' : type === 'bus-dc' ? '#f56c6c' : '#333'
    const sw = type.includes('bus') ? 5 : 2
    graph.value.addEdge({
      source: { x: x - l / 2, y },
      target: { x: x + l / 2, y },
      attrs: { line: { stroke, strokeWidth: sw, strokeLinecap: 'round', sourceMarker: null, targetMarker: null } },
      zIndex: 1,
    })
  } else if (type === 'line-v') {
    const l = 160
    graph.value.addEdge({
      source: { x, y: y - l / 2 },
      target: { x, y: y + l / 2 },
      attrs: { line: { stroke: '#333', strokeWidth: 2, strokeLinecap: 'round', sourceMarker: null, targetMarker: null } },
      zIndex: 1,
    })
  } else if (type === 'flow-line') {
    const l = 120
    graph.value.addEdge({
      source: { x: x - l / 2, y },
      target: { x: x + l / 2, y },
      attrs: { line: { stroke: '#409eff', strokeWidth: 2, strokeDasharray: '6 4', sourceMarker: null, targetMarker: null } },
      zIndex: 2,
    })
  } else if (type === 'text') {
    graph.value.addNode({
      x, y, width: 80, height: 30, label,
      attrs: { body: { fill: 'none' }, text: { fill: '#333' } },
      data: { type, label },
      tools: ['node-editor']
    })
  } else if (type === 'rect') {
    graph.value.addNode({
      x, y, width: 100, height: 60,
      attrs: { body: { stroke: '#e5e7eb', fill: '#f9fafb' } },
      data: { type, label },
    })
  } else if (type === 'indicator') {
    graph.value.addNode({
      x, y, width: 18, height: 18, shape: 'circle',
      attrs: { body: { fill: '#67c23a' } },
      data: { type, label },
    })
  } else if (type === 'indicator-data') {
    graph.value.addNode({
      x, y, width: 60, height: 40,
      label: label,
      attrs: { body: { stroke: '#e5e7eb', fill: '#fff', rx: 4 } },
      data: { type, label },
      tools: ['node-editor']
    })
  } else {
    console.log('添加元素:', type, label, deviceList.value)
    const dev = deviceList.value.find(d => d.id === type)
    const iconUrl = dev?.iconUrl
    graph.value.addNode({
      shape: 'image', x, y, width: 48, height: 48,
      attrs: { image: { 'xlink:href': iconUrl, width: 36, height: 36 } },
      data: {
        type,
        label: dev.compLabel,
        devicePointId: dev?.id || null,
        compGroup: '1'
      },
    })
  }
  ElMessage.success('已添加:' + label)
}

// 右键层级操作
const toTop = () => { graph.value.bringToFront(selectCell.value); contextMenu.value.show = false }
const toBottom = () => { graph.value.sendToBack(selectCell.value); contextMenu.value.show = false }
const moveUp = () => { graph.value.bringForward(selectCell.value); contextMenu.value.show = false }
const moveDown = () => { graph.value.sendBackward(selectCell.value); contextMenu.value.show = false }
const delCell = () => { graph.value.removeCell(selectCell.value); contextMenu.value.show = false }

const handleUndo = () => graph.value?.history.undo()
const handleRedo = () => graph.value?.history.redo()
const handleClear = async () => {
  await ElMessageBox.confirm('确定清空?')
  graph.value.clearCells()
}
const toggleLock = () => {
  locked.value = !locked.value
  graph.value.setSelecting(!locked.value)
  graph.value.setNodesDraggable(!locked.value)
  graph.value.setEdgesDraggable(!locked.value)
  ElMessage.success(locked.value ? '已锁定' : '已解锁')
}
const handlePreview = () => {
  previewVisible.value = true
  nextTick(() => {
    if (previewGraph.value) previewGraph.value.dispose()
    previewGraph.value = new Graph({
      container: previewContainer.value,
      width: previewContainer.value.offsetWidth,
      height: 580,
      interacting: { nodeMovable: false, edgeMovable: false },
    })
    previewGraph.value.fromJSON(graph.value.toJSON())
  })
}

// 显隐切换
const toggleCellVisible = (id) => {
  const cell = getCellById(id)
  if (cell) {
    cell.toggleVisible()
    refreshTree()
  }
}
const handleTreeHover = () => { }
const handleTreeLeave = (id) => {
  const cell = getCellById(id)
  if (!cell) return
  if (cell.isNode()) {
    const d = cell.getData()
    cell.attr('body/stroke', d?.type === 'rect' ? '#e5e7eb' : 'none')
    cell.attr('body/strokeWidth', 1)
  } else {
    cell.attr('line/strokeWidth', 2)
  }
}
const handleSaveDevicePointId = ({ cell, data }) => {
  if (!cell) return
  cell.setData(data)
}

// 下载JSON文件
const handleSave = () => {
  const data = graph.value.toJSON()
  const blob = new Blob([JSON.stringify(data, null, 2)], { type: 'application/json' })
  const url = URL.createObjectURL(blob)
  const a = document.createElement('a')
  a.href = url
  a.download = `拓扑图_${new Date().getTime()}.json`
  a.click()
  URL.revokeObjectURL(url)
  ElMessage.success('保存成功!')
}

// 加载设备组件列表
const getTopoImg = async () => {
  try {
    const res = await listComponent()
    const deviceData = res.data.filter(item => item.compGroup === '1')
    deviceList.value = deviceData
  } catch (error) {
    console.error('设备列表加载失败', error)
  }
}

onMounted(() => {
  initGraph()
  getTopoImg()
  loadDataFields()
})
onUnmounted(() => {
  graph.value?.dispose()
  previewGraph.value?.dispose()
})

/**
 * 核心:初始化canvasConfig画布配置
 * @param {Object|Array} data 完整canvasConfig对象 / 仅cells数组
 */
const loadData = (data) => {
  if (!graph.value || !data) return
  try {
    graph.value.clearCells()
    if (Array.isArray(data)) {
      // 只传节点数组
      graph.value.fromJSON({ cells: data })
    } else if (data.cells && typeof data === 'object') {
      // 完整canvasConfig,还原全部画布状态
      graph.value.fromJSON(data)
    }
    nextTick(() => {
      if (graph.value && graphContainer.value) {
        const w = graphContainer.value.offsetWidth
        const h = graphContainer.value.offsetHeight
        if (w > 0 && h > 0) graph.value.resize(w, h)
        refreshTree()
      }
    })
  } catch (err) {
    console.error('加载canvasConfig失败', err)
  }
}

// 获取画布完整数据(包含canvasConfig)
const getData = () => {
  const canvasConfig = graph.value?.toJSON() || { cells: [] }
  return { canvasConfig }
}

// 清空画布
const clearCanvas = () => graph.value?.clearCells()

const getCellById = (id) => graph.value?.getCellById(id) || null

defineExpose({
  getData,
  loadData,
  clearCanvas,
  getCellById,
  toggleCellVisible,
  handleTreeHover,
  handleTreeLeave,
  handleSaveDevicePointId
})
</script>

<style scoped lang="scss">
.topo-editor {
  display: flex;
  flex-direction: column;
  background: #fff;
}

.topo-body {
  display: flex;
  flex: 1;
  overflow: hidden;
}

.topo-canvas {
  flex: 1;
  background: #fff;
  position: relative;
}

.graph-container {
  width: 100%;
  height: 100% !important;
}

.context-menu {
  position: fixed;
  z-index: 9999;
  background: #fff;
  border: 1px solid #e5e7eb;
  border-radius: 4px;
  padding: 4px 0;
  box-shadow: 0 2px 10px rgba(0, 0, 0, 0.1);
}

.menu-item {
  padding: 6px 14px;
  font-size: 13px;
  cursor: pointer;
}

.menu-item:hover {
  background: #ecf5ff;
  color: #409eff;
}

.menu-item.del:hover {
  background: #fef0f0;
  color: #f56c6c;
}
</style>