日志告诉我们"发生了什么",监控告诉我们"现在怎么样"。Kubernetes 集群的监控是保障稳定性的基础。Prometheus 是云原生监控的事实标准,配合 Grafana 可视化展示和 Alertmanager 告警,可以构建完整的可观测性体系。本文介绍 Prometheus 的核心架构、Kubernetes 监控指标采集(Node Exporter、kube-state-metrics、cAdvisor),以及如何部署和配置告警规则。
一、Prometheus 核心架构
Prometheus 是一个开源的监控和告警系统,采用 Pull 模型(主动抓取指标),通过 HTTP 协议定期从目标(targets)拉取指标数据。
核心组件:
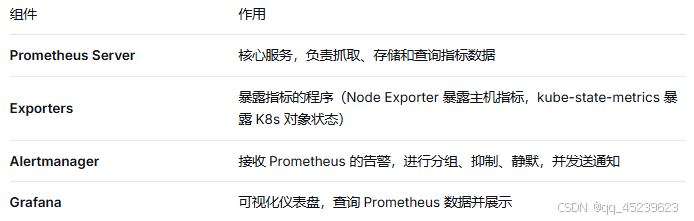
数据模型:Prometheus 存储的是时间序列数据(time series),由指标名称(metric name)和一组标签(labels)唯一标识。
二、Kubernetes 监控指标采集
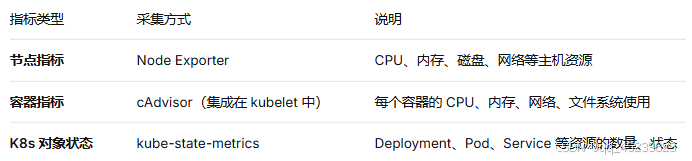
在 Kubernetes 中,需要采集三类指标:
2.1 Node Exporter(主机指标)
Node Exporter 以 DaemonSet 部署在每个节点,暴露节点指标。
yaml
apiVersion: apps/v1
kind: DaemonSet
metadata:
  name: node-exporter
  namespace: monitoring
spec:
  selector:
    matchLabels:
      app: node-exporter
  template:
    metadata:
      labels:
        app: node-exporter
    spec:
      hostNetwork: true
      hostPID: true
      containers:
      - name: node-exporter
        image: prom/node-exporter:latest
        args:
        - --path.procfs=/host/proc
        - --path.sysfs=/host/sys
        volumeMounts:
        - name: proc
          mountPath: /host/proc
          readOnly: true
        - name: sys
          mountPath: /host/sys
          readOnly: true
      volumes:
      - name: proc
        hostPath:
          path: /proc
      - name: sys
        hostPath:
          path: /sys
2.2 kube-state-metrics(K8s 对象状态)
kube-state-metrics 从 Kubernetes API Server 获取资源状态,生成关于 Deployment、Pod、Service、Node 等资源的指标。
bash
# 使用 Helm 部署
helm repo add prometheus-community https://prometheus-community.github.io/helm-charts
helm install kube-state-metrics prometheus-community/kube-state-metrics
2.3 cAdvisor(容器指标)
cAdvisor 已集成在 kubelet 中,默认在 https://:10250/metrics/cadvisor 暴露容器指标。Prometheus 可通过 ServiceMonitor 或静态配置抓取。
三、部署 Prometheus Operator
Prometheus Operator 是 Kubernetes 原生部署和管理 Prometheus 的标准方式,通过 CRD(Custom Resource Definition)定义监控目标。
3.1 安装 Prometheus Operator
bash
helm repo add prometheus-community https://prometheus-community.github.io/helm-charts
helm repo update

helm install prometheus prometheus-community/kube-prometheus-stack \
  --namespace monitoring \
  --create-namespace
kube-prometheus-stack 包含:
Prometheus Server
Alertmanager
Grafana
Node Exporter
kube-state-metrics
ServiceMonitors(自动发现监控目标)
3.2 访问 Grafana
bash
# 获取 Grafana 密码
kubectl get secret --namespace monitoring prometheus-grafana \
  -o jsonpath="{.data.admin-password}" | base64 --decode

# 端口转发
kubectl port-forward --namespace monitoring service/prometheus-grafana 3000:80
访问 http://localhost:3000,用户名 admin。
Grafana 中已预置多个 Kubernetes 监控仪表盘,可直接查看集群和 Pod 的资源使用情况。
四、配置 Prometheus 抓取目标
4.1 ServiceMonitor(推荐)
ServiceMonitor 是 Prometheus Operator 定义的 CRD,用于声明式配置抓取目标。
yaml
apiVersion: monitoring.coreos.com/v1
kind: ServiceMonitor
metadata:
  name: myapp-monitor
  namespace: default
spec:
  selector:
    matchLabels:
      app: myapp
  endpoints:
  - port: metrics
    path: /metrics
    interval: 15s
当 Service 带有 app: myapp 标签且暴露了名为 metrics 的端口时,Prometheus 会自动抓取。
4.2 静态配置(传统方式)
在 prometheus.yml 中直接配置 targets:
yaml
scrape_configs:
- job_name: 'kubernetes-nodes'
  static_configs:
  - targets: ['node1:9100', 'node2:9100']
生产环境推荐 ServiceMonitor,更灵活且与 Kubernetes 资源模型一致。
五、配置 Alertmanager 告警
5.1 告警规则示例
在 Prometheus 中定义告警规则,当条件满足时触发告警并发送给 Alertmanager。
alert-rules.yaml:
yaml
groups:
- name: kubernetes-alerts
  rules:
  - alert: PodCrashLooping
    expr: kube_pod_container_status_restarts_total > 5
    for: 5m
    labels:
      severity: warning
    annotations:
      summary: "Pod {{ $labels.pod }} is crash looping"
      description: "Pod {{ $labels.pod }} in namespace {{ $labels.namespace }} has restarted {{ $value }} times."

  - alert: NodeMemoryUsage
    expr: (1 - (node_memory_MemAvailable_bytes / node_memory_MemTotal_bytes)) * 100 > 90
    for: 5m
    labels:
      severity: critical
    annotations:
      summary: "Node {{ $labels.instance }} memory usage is high"
      description: "Memory usage is {{ $value }}%"
5.2 配置 Alertmanager 通知(以 Slack 为例)
yaml
apiVersion: v1
kind: Secret
metadata:
  name: alertmanager-slack
  namespace: monitoring
type: Opaque
stringData:
  slack-webhook: "https://hooks.slack.com/services/xxx/yyy/zzz"
---
apiVersion: monitoring.coreos.com/v1
kind: AlertmanagerConfig
metadata:
  name: slack-config
  namespace: monitoring
spec:
  route:
    group_by: ['alertname']
    group_wait: 10s
    group_interval: 10s
    repeat_interval: 1h
    receiver: 'slack'
  receivers:
  - name: 'slack'
    slackConfigs:
    - apiURL:
        key: slack-webhook
        name: alertmanager-slack
      channel: '#alerts'
      text: '{{ range .Alerts }}{{ .Annotations.summary }} - {{ .Annotations.description }}{{ end }}'
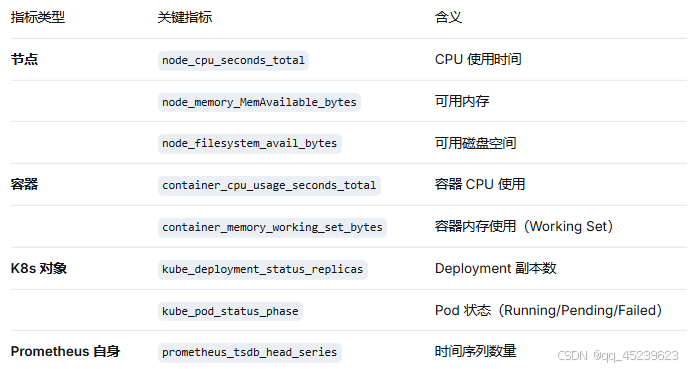
六、关键监控指标解读
七、生产环境最佳实践
指标保留时间:根据存储容量设置 --storage.tsdb.retention.time,一般 15-30 天。
持久化存储:为 Prometheus 配置 PVC,防止 Pod 重启丢失历史数据。
资源限制:为 Prometheus 设置 requests 和 limits,避免 OOM。
高可用:部署多副本 Prometheus(使用 Thanos 或 VictoriaMetrics 实现长期存储和全局查询)。
告警分级:区分 warning 和 critical,避免告警风暴。
监控监控本身:监控 Prometheus 自身的资源使用和抓取状态。
八、小结
Prometheus + Grafana + Alertmanager 是 Kubernetes 监控的标准组合。通过 Node Exporter、kube-state-metrics 和 cAdvisor 采集三类指标,配合 ServiceMonitor 动态发现监控目标,再通过 Alertmanager 实现告警通知,可以构建完整的可观测性体系。结合上一讲的日志收集,你已具备集群可观测性的两大核心能力。