文章目录
- 前言
- [一、Data Model Overview / 数据模型概述](#一、Data Model Overview / 数据模型概述)
-
- [(一)What is a Data Model? / 什么是数据模型?](#(一)What is a Data Model? / 什么是数据模型?)
-
- [1. Definition 定义](#1. Definition 定义)
- [2. Purpose 目的](#2. Purpose 目的)
- [(二)Why is Data Modeling Important? / 为什么数据建模很重要?](#(二)Why is Data Modeling Important? / 为什么数据建模很重要?)
- [(三)Key Components of a Data Model / 数据模型的关键组件](#(三)Key Components of a Data Model / 数据模型的关键组件)
- [二、Tables and Columns Properties / 表与列属性配置](#二、Tables and Columns Properties / 表与列属性配置)
-
- [(一)Table Properties / 表属性](#(一)Table Properties / 表属性)
-
- [1. Name 名称](#1. Name 名称)
- [2. Description 描述](#2. Description 描述)
- [3. Synonyms 同义词](#3. Synonyms 同义词)
- [4. Row Label 行标签](#4. Row Label 行标签)
- [5. Key Column 键列](#5. Key Column 键列)
- [6. Is Hidden 是否隐藏](#6. Is Hidden 是否隐藏)
- [7. Is Featured Table 是否为特色表](#7. Is Featured Table 是否为特色表)
- [8. Storage Mode 存储模式](#8. Storage Mode 存储模式)
- [(二)Column Properties / 列属性](#(二)Column Properties / 列属性)
-
- [1. Name 名称](#1. Name 名称)
- [2. Description 描述](#2. Description 描述)
- [3. Synonyms 同义词](#3. Synonyms 同义词)
- [4. Display Folder 显示文件夹](#4. Display Folder 显示文件夹)
- [5. Is Hidden 是否隐藏](#5. Is Hidden 是否隐藏)
- [6. Data Type 数据类型](#6. Data Type 数据类型)
- [7. Format 格式](#7. Format 格式)
- [8. Sort by Column 按列排序](#8. Sort by Column 按列排序)
- [9. Data Category 数据类别](#9. Data Category 数据类别)
- [10. Summarize by 汇总方式](#10. Summarize by 汇总方式)
- [11. Is Nullable 是否可为空](#11. Is Nullable 是否可为空)
- [三、Fact Tables vs. Dimension Tables / 事实表与维度表](#三、Fact Tables vs. Dimension Tables / 事实表与维度表)
-
- [(一)Fact Table / 事实表](#(一)Fact Table / 事实表)
-
- [1. Definition 定义](#1. Definition 定义)
- [2. Common Metrics 常见指标](#2. Common Metrics 常见指标)
- [3. Foreign Keys 外键](#3. Foreign Keys 外键)
- [4. Size 规模](#4. Size 规模)
- [(二)Dimension Table / 维度表](#(二)Dimension Table / 维度表)
-
- [1. Definition 定义](#1. Definition 定义)
- [2. Examples 示例](#2. Examples 示例)
- [3. Primary Key 主键](#3. Primary Key 主键)
- [4. Size 规模](#4. Size 规模)
- [四、Schema Types / 架构类型](#四、Schema Types / 架构类型)
-
- [(一)Flat Table Schema / 平面表架构](#(一)Flat Table Schema / 平面表架构)
- [(二)Star Schema / 星型架构](#(二)Star Schema / 星型架构)
- [(三)Snowflake Schema / 雪花架构](#(三)Snowflake Schema / 雪花架构)
- [五、Data Cardinality / 数据基数](#五、Data Cardinality / 数据基数)
-
- [(一)Definition 定义](#(一)Definition 定义)
- [(二)Types of Cardinality / 基数类型](#(二)Types of Cardinality / 基数类型)
-
- [1. Low Cardinality 低基数](#1. Low Cardinality 低基数)
- [2. Medium Cardinality 中等基数](#2. Medium Cardinality 中等基数)
- [3. High Cardinality 高基数](#3. High Cardinality 高基数)
- [(三)Relationship Cardinalities / 关系基数类型](#(三)Relationship Cardinalities / 关系基数类型)
- [六、Cross-Filter Direction / 交叉筛选方向](#六、Cross-Filter Direction / 交叉筛选方向)
-
- [(一)Definition 定义](#(一)Definition 定义)
- [(二)Types of Cross-Filter Directions / 交叉筛选方向类型](#(二)Types of Cross-Filter Directions / 交叉筛选方向类型)
-
- [1. Single (One-Way Filtering) / 单一方向(单向筛选)](#1. Single (One-Way Filtering) / 单一方向(单向筛选))
- [2. Both (Bi-Directional Filtering) / 双向(双向筛选)](#2. Both (Bi-Directional Filtering) / 双向(双向筛选))
- [(三)When to Use Which? / 何时使用哪种?](#(三)When to Use Which? / 何时使用哪种?)
- [(四)How to Set / 如何设置?](#(四)How to Set / 如何设置?)
- [七、Create Hierarchies / 创建层次结构](#七、Create Hierarchies / 创建层次结构)
-
- [(一)Definition 定义](#(一)Definition 定义)
- [(二)Purpose 目的](#(二)Purpose 目的)
- [(三)Common Types / 常见类型](#(三)Common Types / 常见类型)
- [(四)How to Create / 创建步骤](#(四)How to Create / 创建步骤)
- [八、Row-Level Security (RLS) / 行级安全性](#八、Row-Level Security (RLS) / 行级安全性)
-
- [(一)Definition 定义](#(一)Definition 定义)
- [(二)Important Notes 重要说明](#(二)Important Notes 重要说明)
- [(三)How to Define Roles in Power BI Desktop / 在Power BI Desktop中定义角色](#(三)How to Define Roles in Power BI Desktop / 在Power BI Desktop中定义角色)
- [(四)Assign Users in Power BI Service / 在Power BI Service中分配用户](#(四)Assign Users in Power BI Service / 在Power BI Service中分配用户)
- [(五)View As Roles (Test in Desktop) / 以角色身份查看(在Desktop中测试)](#(五)View As Roles (Test in Desktop) / 以角色身份查看(在Desktop中测试))
- [(六)Advantages of RLS / RLS的优点](#(六)Advantages of RLS / RLS的优点)
- [九、Q&A Feature / Q&A自然语言查询功能](#九、Q&A Feature / Q&A自然语言查询功能)
-
- [(一)Definition 定义](#(一)Definition 定义)
- [(二)Key Features / 关键特性](#(二)Key Features / 关键特性)
- [(三)How to Use / 使用方法](#(三)How to Use / 使用方法)
- [(四)Teach Q&A / 教授Q&A](#(四)Teach Q&A / 教授Q&A)
- [(五)Synonyms Setup / 同义词设置](#(五)Synonyms Setup / 同义词设置)
- [十、Performance Optimization / 性能优化](#十、Performance Optimization / 性能优化)
-
- [(一)Compression & Cardinality Reduction / 压缩与基数降低](#(一)Compression & Cardinality Reduction / 压缩与基数降低)
- [(二)Change Data Types / 更改数据类型](#(二)Change Data Types / 更改数据类型)
- [(三)Split Date/Time Columns / 拆分日期/时间列](#(三)Split Date/Time Columns / 拆分日期/时间列)
- [(四)Reduce Text Column Size / 减小文本列大小](#(四)Reduce Text Column Size / 减小文本列大小)
- [(五)Data Summarization / 数据汇总](#(五)Data Summarization / 数据汇总)
- 总结
前言
本文是Power BI Desktop第五章"数据建模"的期末复习笔记。内容涵盖:表与列属性配置、事实表与维度表、星型与雪花架构、基数与关系、交叉筛选方向、层次结构创建、行级安全(RLS)、Q&A自然语言查询及性能优化。
一、Data Model Overview / 数据模型概述
(一)What is a Data Model? / 什么是数据模型?
1. Definition 定义
- Data Model in Power BI is the structured framework that defines how tables, relationships, and calculations work together to create meaningful insights.
- 数据模型 是Power BI中定义表、关系与计算如何协同工作以生成有意义的洞察的结构化框架。
2. Purpose 目的
- Transforms raw data into an optimized format for analysis and reporting.
- 将原始数据转换为优化格式,用于分析与报表制作。
(二)Why is Data Modeling Important? / 为什么数据建模很重要?
- Better Performance -- Optimizes queries and reduces load times. / 更佳性能 ------ 优化查询并缩短加载时间。
- Accurate Insights -- Ensures correct relationships between tables. / 准确洞察 ------ 确保表间关系正确。
- Scalability -- Handles large datasets efficiently. / 可扩展性 ------ 高效处理大型数据集。
- Simplifies Analysis -- Enables complex calculations with ease. / 简化分析 ------ 轻松实现复杂计算。
(三)Key Components of a Data Model / 数据模型的关键组件
- Tables -- Organized datasets (e.g., Sales, Customers, Products). / 表 ------ 组织好的数据集。
- Relationships -- Links between tables. / 关系 ------ 表之间的链接。
- Columns & Measures -- Data fields, calculated values using DAX. / 列与度量值 ------ 数据字段,使用DAX计算的值。
- Hierarchies -- Logical groupings (e.g., Year → Quarter → Month). / 层次结构 ------ 逻辑分组。
- Aggregations -- Summarized data for better performance. / 聚合 ------ 汇总数据以提升性能。
二、Tables and Columns Properties / 表与列属性配置
Configure in Model view → Properties pane.
在"模型视图" → "属性"窗格中配置。
(一)Table Properties / 表属性
1. Name 名称
- Enter the table name. / 输入表名称。
2. Description 描述
- Add a description stored in metadata. Visible when hovering over the table in Fields pane. / 添加描述,存储在元数据中。在"字段"窗格中悬停时可见。
3. Synonyms 同义词
- Help Power BI Q&A feature understand different names for the table. / 帮助Power BI的Q&A功能识别表的不同叫法。
4. Row Label 行标签
- Select a column whose values serve as labels for each row. Useful for Q&A and featured tables. / 选择某列的值作为每行的标签。对Q&A和特色表有用。
- Example: If Product Name is the Row Label, Q&A will show sales by product name. / 示例:若将"产品名称"设为行标签,Q&A将按产品名称显示销售额。
5. Key Column 键列
- Set a column with unique values as the key column. / 将具有唯一值的列设为键列。
6. Is Hidden 是否隐藏
- Hide table from Fields pane. / 在"字段"窗格中隐藏该表。
7. Is Featured Table 是否为特色表
- Allow table to be used in Excel in certain scenarios. / 允许在特定场景下在Excel中使用该表。
8. Storage Mode 存储模式
- Import: Data fully loaded into Power BI. / 数据完全加载到Power BI中。
- DirectQuery : Data fetched directly from source on each refresh. / 每次刷新时直接从源获取数据。
- Dual: Mix of Import and DirectQuery. / 导入与DirectQuery的混合模式。
(二)Column Properties / 列属性
1. Name 名称
- Enter the column name. / 输入列名称。
2. Description 描述
- Add column description. / 添加列描述。
3. Synonyms 同义词
- Add alternative names for Q&A. Example: "Revenue" can have "Sales" as synonym. / 为Q&A添加替代名称。如"Revenue"可以有同义词"Sales"。
4. Display Folder 显示文件夹
- Group columns from the same table into folders for better organization. / 将同一表中的列分组到文件夹中,便于组织。
5. Is Hidden 是否隐藏
- Keep column in model but hide from Fields pane. / 保留在模型中,但在"字段"窗格中隐藏。
6. Data Type 数据类型
- Available types differ from Power Query (e.g., Percentage, Date/Time/Timezone, Duration are not available). / 可用类型与Power Query不同(如百分比、日期/时间/时区、持续时间不可用)。
7. Format 格式
- For numeric columns: Percentage format, Thousands separator, Decimal places. / 数值列可配置:百分比格式、千位分隔符、小数位数。
8. Sort by Column 按列排序
- Sort one column by another (e.g., sort month names by month numbers). / 按另一列排序(如按月编号排月份名称)。
9. Data Category 数据类别
- Useful for visuals. Default is Uncategorized. Options include: Address, City, Country, Latitude, Longitude, Web URL, Image URL, Barcode, etc. / 对某些视觉对象有用。默认为"未分类"。选项包括地址、城市、国家、纬度、经度、网址、图片URL、条形码等。
10. Summarize by 汇总方式
- Determines aggregation method: Don't Summarize, Count, Distinct Count, Sum, Average, Min, Max. / 决定聚合方式:不汇总、计数、非重复计数、求和、平均值、最小值、最大值。
- Power BI tries to auto-detect, but may be inaccurate. / Power BI会尝试自动检测,但可能不准确。
11. Is Nullable 是否可为空
- Disallow null values; if null appears during refresh, refresh will fail. / 禁止空值;若刷新时出现空值,刷新将失败。
三、Fact Tables vs. Dimension Tables / 事实表与维度表
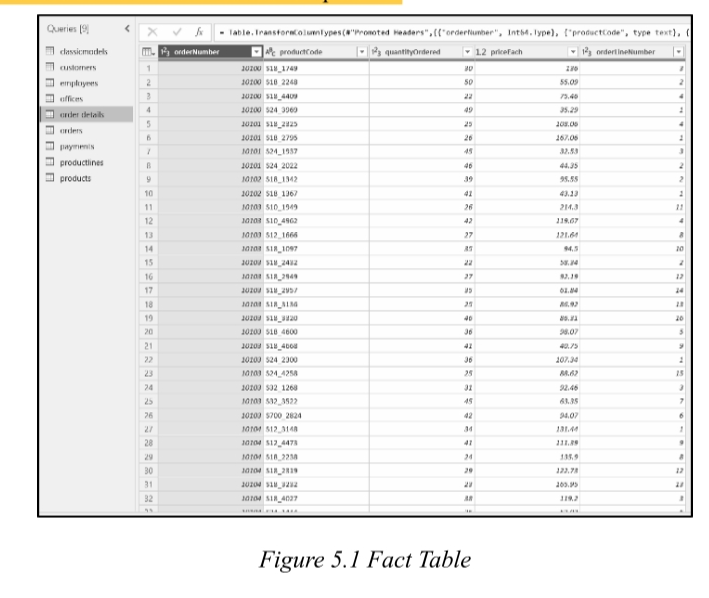
(一)Fact Table / 事实表
1. Definition 定义
- Central table in star/snowflake schema containing quantitative data -- numeric values or measurable facts (KPIs). / 星型/雪花架构中的核心表 ,包含定量数据------数值型或可衡量的业务事实(KPI)。
- Each row typically represents a single event , transaction , or measurable instance. / 每行通常表示一个事件 、交易或可衡量的实例。
2. Common Metrics 常见指标
- Sales Amount, Profit, Quantity Sold, Revenue, Cost, Discount. / 销售额、利润、销量、收入、成本、折扣。
3. Foreign Keys 外键
- Contain foreign keys pointing to dimension tables to enrich context. / 包含指向维度表的外键,以丰富上下文。
4. Size 规模
- Tend to be large because they record each instance of a business process. / 通常较大 ,因为记录了业务流程的每个实例。
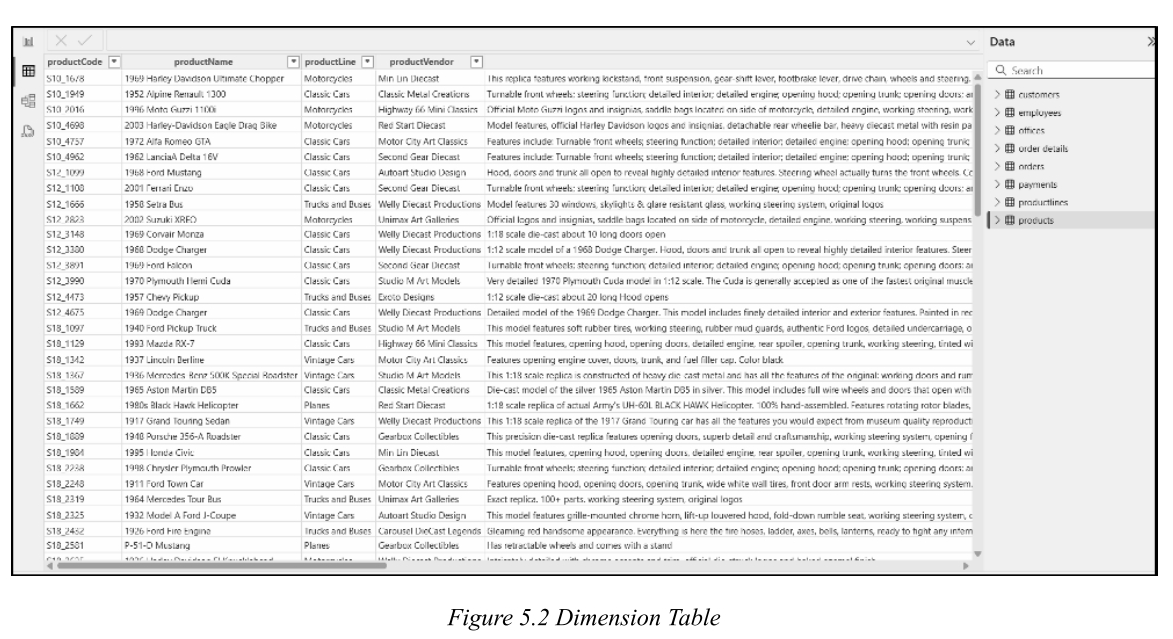
(二)Dimension Table / 维度表
1. Definition 定义
- Contains descriptive or categorical data -- details that describe the "who, what, where, when, and how" of a fact. / 包含描述性 或分类数据------描述事实的"谁、什么、哪里、何时、如何"的细节。
- Adds meaning to numbers in fact tables. / 为事实表中的数字增加含义。
2. Examples 示例
- Product Dimension: Product Name, Category, Brand, Manufacturer. / 产品维度:产品名称、类别、品牌、制造商。
- Customer Dimension: Customer Name, Region, Email, Age Group. / 客户维度:客户名称、区域、电子邮件、年龄组。
3. Primary Key 主键
- Usually has a primary key that uniquely identifies each record and links to foreign key in fact table. / 通常有主键,唯一标识每条记录,并链接到事实表的外键。
4. Size 规模
- Typically smaller and more stable than fact tables (do not grow as rapidly). / 通常比事实表更小 、更稳定 (增长不那么快)。
四、Schema Types / 架构类型
(一)Flat Table Schema / 平面表架构
- All data -- facts and descriptive attributes -- in a single table . No relationships. / 所有数据------事实和描述性属性------都在一个表中。无关系。
- Pros : Simple to use, ideal for prototypes or one-time reports. / 优点:使用简单,适合原型或一次性报表。
- Cons : Lacks scalability, modularity, and performance benefits. / 缺点:缺乏可扩展性、模块化和性能优势。
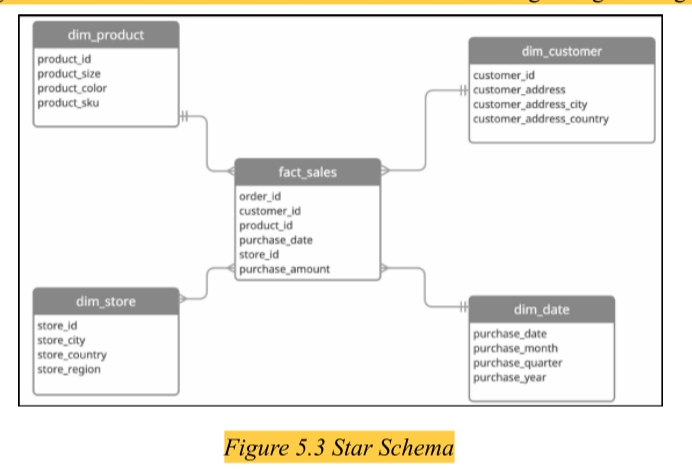
(二)Star Schema / 星型架构
- Most commonly used in Power BI. / Power BI中最常用。
- Central fact table surrounded by dimension tables (like a star). / 中央事实表 被维度表环绕(如星形)。
- Dimension tables are denormalized (wide, contain all attributes). / 维度表是非规范化的(宽表,包含所有属性)。
- Pros : Simple, fast, reduces joins, enhances performance. / 优点:简单、快速、减少联接、增强性能。
- Suitable for self-service BI. / 适合自助式BI。
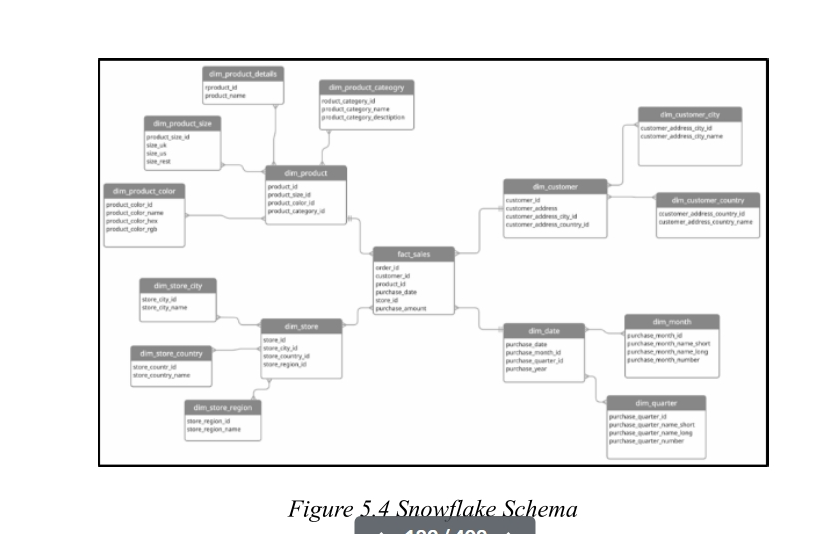
(三)Snowflake Schema / 雪花架构
- Dimension tables are normalized into multiple related sub-tables (e.g., Product → Category → Supplier). / 维度表被规范化为多个相关的子表(如产品→类别→供应商)。
- Pros : Data consistency, storage efficiency, reduces redundancy. / 优点:数据一致性、存储效率、减少冗余。
- Cons : More tables, more joins, slower performance. / 缺点:更多表、更多联接、性能较慢。
- Looks like a snowflake pattern when diagrammed. / 图表上看起来像雪花图案。
五、Data Cardinality / 数据基数
(一)Definition 定义
- Refers to the uniqueness of values in a column. / 指列中值的唯一性程度。
(二)Types of Cardinality / 基数类型
1. Low Cardinality 低基数
- Very few unique values compared to total rows. / 与总行数相比,唯一值很少。
- Example: "Gender" (Male/Female), "Country" with 5--10 values. / 示例:"性别"(男/女),只有5--10个值的"国家"。
2. Medium Cardinality 中等基数
- Moderate number of unique values. / 唯一值数量适中。
- Example: "Product Category" with 20--50 values. / 示例:有20--50个值的"产品类别"。
3. High Cardinality 高基数
- Almost every value is unique. / 几乎每个值都是唯一的。
- Example: Email addresses, Invoice Numbers, Transaction IDs, Timestamps, Customer IDs. / 示例:电子邮件地址、发票号、交易ID、时间戳、客户ID。
(三)Relationship Cardinalities / 关系基数类型
| Cardinality | Description | Example |
|---|---|---|
| One-to-One (1:1) | Each value in Table A matches one value in Table B. Rare in analytics. | EmployeeID ↔ EmployeeDetails |
| One-to-Many (1:M) | One record in Table A relates to multiple records in Table B. Most common & recommended. | Customer ↔ Orders |
| Many-to-One (M:1) | Reverse of One-to-Many. | Orders → Customer |
| Many-to-Many (M:M) | Both tables have duplicate values; needs a bridge table. | Students ↔ Courses |
⚠️ Caution : Ensure the "one" side contains only unique values to avoid errors.
⚠️ 注意:确保"一"方仅包含唯一值,以避免错误。
六、Cross-Filter Direction / 交叉筛选方向
(一)Definition 定义
- Determines how filters propagate between related tables. / 决定筛选器如何在相关表之间传播。
(二)Types of Cross-Filter Directions / 交叉筛选方向类型
1. Single (One-Way Filtering) / 单一方向(单向筛选)
- Filter flows in only one direction (from "one" to "many"). / 筛选器仅沿一个方向流动(从"一"到"多")。
- Used in One-to-Many (1:M) relationships. / 用于一对多(1:M) 关系。
- Best for performance -- reduces processing complexity. / 性能最佳------降低处理复杂度。
- Example: Filter Customers → affects Orders, but not vice versa. / 示例:筛选客户→影响订单,但反之不成立。
2. Both (Bi-Directional Filtering) / 双向(双向筛选)
- Filter flows in both directions . / 筛选器双向流动。
- Used in Many-to-Many (M:M) or complex models. / 用于多对多(M:M) 或复杂模型。
- Can increase performance load and lead to circular dependencies . / 可能增加性能负担 并导致循环依赖。
- Use with caution! / 谨慎使用!
(三)When to Use Which? / 何时使用哪种?
| Cross-Filter Direction | Best Use Case | Performance |
|---|---|---|
| Single (One-Way) | Simple, direct relationships (One-to-Many) | Fastest |
| Both (Bi-Directional) | Complex relationships (Many-to-Many) | Can slow performance |
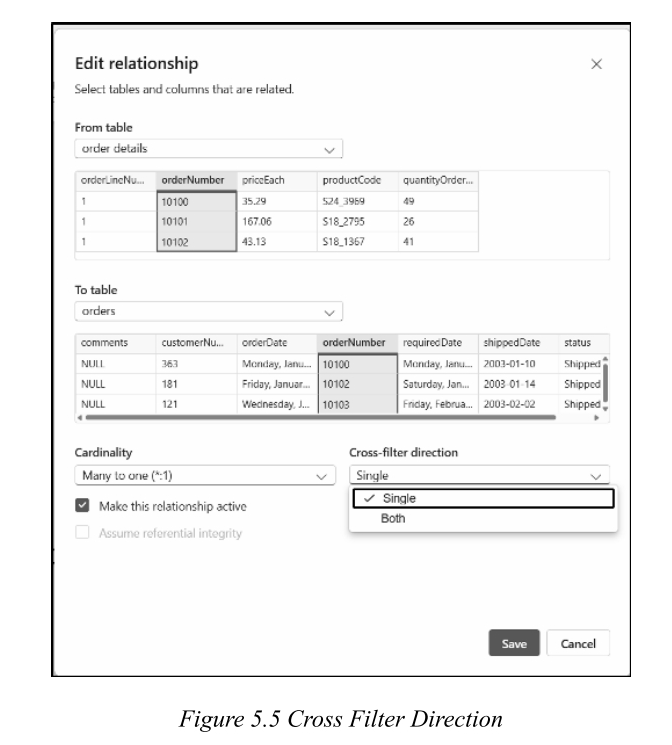
(四)How to Set / 如何设置?
- Go to Model View in Power BI. / 转到Power BI的模型视图。
- Click on a relationship line between two tables. / 单击两个表之间的关系线。
- In Properties Pane , find "Cross filter direction". / 在属性窗格中,找到"交叉筛选方向"。
- Choose Single or Both . / 选择单向 或双向。
- Click Apply and test. / 单击应用并测试。
七、Create Hierarchies / 创建层次结构
(一)Definition 定义
- A way to organize data in a multi-level structure showing relationships between fields. / 以多级结构组织数据,显示字段之间关系的方式。
- Allows drill down and drill up to explore data at different granularities. / 允许向下钻取 和向上钻取,以不同粒度探索数据。
(二)Purpose 目的
- Drill-down and Drill-up : Navigate between summary and detail. / 下钻与上钻:在汇总与明细间导航。
- Hierarchical Analysis : Show parent-child relationships (e.g., Region → Country → City). / 层次分析:显示父子关系。
- Interactive Reports : Enhance interactivity with slicers, filters, and visuals. / 交互式报表:通过切片器、筛选器和视觉对象增强交互性。
(三)Common Types / 常见类型
- Time-Based: Year → Quarter → Month → Day. / 时间型:年→季度→月→日。
- Geographical: Country → State → City → Postal Code. / 地理型:国家→州→城市→邮政编码。
- Product-Based: Category → Sub-Category → Product. / 产品型:类别→子类别→产品。
- Organizational: Department → Manager → Employee. / 组织型:部门→经理→员工。
(四)How to Create / 创建步骤
- Go to Model view . / 转到模型视图。
- Right-click a column → Select Create hierarchy . / 右键单击某列→选择创建层次结构。
- Rename the hierarchy (e.g., "Geography"). / 重命名层次结构(如"Geography")。
- Drag additional columns onto the hierarchy in the Fields pane . / 在字段窗格中将其他列拖到层次结构上。
- Order: Region → Country → Product Category → Product. / 顺序:区域→国家→产品类别→产品。
📌 Note:
- A column can be part of multiple hierarchies . / 一列可以是多个层次结构的一部分。
- Hierarchy items inherit sorting from original columns. / 层次结构项继承原始列的排序。
- All columns in a hierarchy must be from the same table . / 层次结构中的所有列必须来自同一表。
- To include columns from different tables, use Power Query or DAX
RELATEDfunction. / 要包含不同表的列,请使用Power Query或DAX的RELATED函数。
八、Row-Level Security (RLS) / 行级安全性
- Row-level security (RLS) with Power BI can be used to restrict data access for given users. Filters restrict data access at the row level, and you can define filters within roles. In the Power BI service, members of a workspace have access to datasets in the workspace. RLS doesn't restrict this data access.
- 具有Power BI的行级安全(RLS)可用于限制给定用户的数据访问。筛选器在行级别限制数据访问,您可以在角色中定义筛选器。在Power BI服务中,工作区的成员可以访问工作区中的数据集。RLS不限制这种数据访问。
(一)Definition 定义
- Restricts data access at the row level for given users. / 在行级别限制特定用户的数据访问。
- Filters are defined within roles using DAX expressions . / 使用DAX表达式 在角色中定义筛选器。
(二)Important Notes 重要说明
- RLS does not restrict access for workspace members. / RLS不限制工作区成员的访问。
- Can be configured for Import and DirectQuery datasets. / 可为导入 和DirectQuery数据集配置。
- For AS / AAS live connections , configure RLS in the model, not in Power BI Desktop. / 对于AS/AAS实时连接,在模型中配置RLS,而非在Power BI Desktop中。
- Security option will not show up for live connection datasets. / 实时连接数据集不显示安全选项。
(三)How to Define Roles in Power BI Desktop / 在Power BI Desktop中定义角色
- Go to Modeling tab → Click Manage Roles . / 转到建模 选项卡→单击管理角色。
- Click Create → Enter a role name (e.g., "North America"). / 单击创建→输入角色名称(如"North America")。
- Under Tables , select the table to apply DAX rule. / 在表下,选择要应用DAX规则的表。
- In Table filter DAX expression box, enter DAX expression (returns TRUE/FALSE). / 在表筛选器DAX表达式 框中,输入DAX表达式(返回TRUE/FALSE)。
- Example:
[Region] = "North America"
- Example:
- Click the checkmark to validate → Click Save . / 单击对勾验证→单击保存。
(四)Assign Users in Power BI Service / 在Power BI Service中分配用户
- Publish the report to Power BI Service . / 将报表发布到Power BI Service。
- Navigate to the dataset → Click Security . / 导航到数据集→单击安全。
- Select a role → Click Add to assign users or security groups. / 选择一个角色→单击添加以分配用户或安全组。
(五)View As Roles (Test in Desktop) / 以角色身份查看(在Desktop中测试)
- Go to Modeling tab → Click View as Roles . / 转到建模 选项卡→单击以角色身份查看。
- Select a role → Click OK → Power BI displays filtered data. / 选择一个角色→单击确定→Power BI显示筛选后的数据。
(六)Advantages of RLS / RLS的优点
- Data Security : Sensitive data visible only to authorized users. / 数据安全:敏感数据仅对授权用户可见。
- Simplifies Sharing : One report, multiple users, different data views. / 简化共享:一个报表,多个用户,不同数据视图。
- Dynamic Security : Use
USERPRINCIPALNAME()for dynamic filtering. / 动态安全 :使用USERPRINCIPALNAME()进行动态筛选。 - Reduces Redundancy : No need for separate reports per department/region. / 减少冗余:无需为每个部门/地区创建单独报表。
- Improves Governance : Centralized security policy enforcement. / 改进治理:集中执行安全策略。
九、Q&A Feature / Q&A自然语言查询功能
(一)Definition 定义
- Allows users to ask questions in plain English using Natural Language Processing (NLP) . / 允许用户使用自然语言处理(NLP)以纯英文提问。
- Power BI automatically generates visuals as answers. / Power BI自动生成视觉对象作为答案。
(二)Key Features / 关键特性
- Natural Language Understanding : No DAX or SQL required. / 自然语言理解:无需DAX或SQL。
- Instant Visuals : Auto-selects best visual type. / 即时视觉对象:自动选择最佳视觉类型。
- Auto-suggestions : Suggests completions as you type. / 自动建议:输入时建议补全。
- Synonyms Support : Recognizes alternative names for columns/tables. / 同义词支持:识别列/表的替代名称。
- Teach Q&A : Train Power BI to understand new terms. / 教授Q&A:训练Power BI理解新术语。
(三)How to Use / 使用方法
- In Report view , double-click empty space on canvas → Select Q&A visual . / 在报表视图 中,双击画布空白处→选择Q&A视觉对象。
- Or go to Insert ribbon → Select Q&A . / 或转到插入 功能区→选择Q&A。
- Type a question in natural language (e.g., "Total sales by product category"). / 输入自然语言问题。
(四)Teach Q&A / 教授Q&A
- When Q&A underlines a term in red (doesn't understand it), select the term. / 当Q&A用红色下划线标出术语(不理解)时,选择该术语。
- Select Define → Enter the field it refers to (e.g., "units" refers to "quantity"). / 选择定义→输入它所指的字段(如"units"指"quantity")。
- Click Save . / 单击保存。
(五)Synonyms Setup / 同义词设置
- In Report view → Modeling ribbon → Select Q&A setup . / 在报表视图 →建模 功能区→选择Q&A设置。
- Select Field synonyms . / 选择字段同义词。
- Expand the table → Find the field → Click Add → Enter synonym (e.g., "margin" for "Profit"). / 展开表→找到字段→单击添加→输入同义词(如"Profit"添加"margin")。
- Press Enter → Close the window. / 按Enter→关闭窗口。
- Hidden objects are excluded from Q&A by default. / 默认情况下,隐藏对象不参与Q&A。
十、Performance Optimization / 性能优化
(一)Compression & Cardinality Reduction / 压缩与基数降低
- Power BI uses columnar storage and compression algorithms. / Power BI使用列式存储和压缩算法。
- Reducing cardinality of columns helps optimize the model. / 降低列的基数有助于优化模型。
(二)Change Data Types / 更改数据类型
- Decimal Number: Stores floating-point numbers (more than 4 decimal places). / 存储浮点数(超过4位小数)。
- Fixed Decimal Number: Stores decimals with fixed scale (up to 4 decimal places). More efficient for currency. / 存储固定小数位数(最多4位)。对货币更高效。
- Optimization Tip : Change to Fixed Decimal Number if precision beyond 4 decimals is unnecessary. / 优化提示 :若无需超过4位小数的精度,改为固定小数位数。
(三)Split Date/Time Columns / 拆分日期/时间列
- Split Date/Time columns into separate Date and Time columns to reduce cardinality. / 将日期/时间 列拆分为单独的日期 和时间列以降低基数。
- Time columns often have high cardinality → inefficient memory storage. / 时间列通常具有高基数→内存存储效率低。
(四)Reduce Text Column Size / 减小文本列大小
- For consistent text like Invoice Numbers (e.g., INV01234567), remove prefixes and convert numeric part to Whole Number . / 对于一致的文本如发票号 (如INV01234567),删除前缀并将数字部分转为整数。
- Text → Whole Number conversion is more efficient. / 文本→整数转换更高效。
- Split inconsistent prefixes into separate column for better optimization. / 将不一致的前缀拆分为单独的列以优化。
(五)Data Summarization / 数据汇总
- If detailed data is not needed (e.g., daily sales), aggregate at higher level (e.g., monthly). / 若不需要明细数据(如日销售额),在更高级别汇总(如月度)。
- Trade-off : Reduces model size but loses detail. / 权衡:减小模型大小但丢失细节。
- Best Practice : Perform summarization as close to the data source as possible. / 最佳实践:在尽可能靠近数据源的位置进行汇总。
- Use Power Query's Group By functionality. / 使用Power Query的分组依据功能。
总结
提示:这里对文章进行总结:
例如:以上就是今天要讲的内容,本文仅仅简单介绍了pandas的使用,而pandas提供了大量能使我们快速便捷地处理数据的函数和方法。