文章目录
- 前言
- [一、Power Query Editor Overview / Power Query编辑器概述](#一、Power Query Editor Overview / Power Query编辑器概述)
-
- [(一)Definition and Role / 定义与作用](#(一)Definition and Role / 定义与作用)
-
- [1. Power Query Editor](#1. Power Query Editor)
- [2. Key Characteristics / 关键特征](#2. Key Characteristics / 关键特征)
- [(二)Power BI Workflow / Power BI工作流程](#(二)Power BI Workflow / Power BI工作流程)
-
- [1. Connect to Data Sources / 连接数据源](#1. Connect to Data Sources / 连接数据源)
- [2. Load Data into Power Query Editor / 加载数据到编辑器](#2. Load Data into Power Query Editor / 加载数据到编辑器)
- [3. Clean the Data / 清洗数据](#3. Clean the Data / 清洗数据)
- [4. Transform and Shape Data / 转换和塑造数据](#4. Transform and Shape Data / 转换和塑造数据)
- [5. Apply Transformation Steps / 应用转换步骤](#5. Apply Transformation Steps / 应用转换步骤)
- [二、Power Query Editor Interface Panes / Power Query编辑器界面窗格](#二、Power Query Editor Interface Panes / Power Query编辑器界面窗格)
-
- [(一)Left (Queries) Pane / 左侧(查询)窗格](#(一)Left (Queries) Pane / 左侧(查询)窗格)
-
- [1. Queries Pane](#1. Queries Pane)
- [(二)Center (Data) Pane / 中心(数据)窗格](#(二)Center (Data) Pane / 中心(数据)窗格)
-
- [1. Data Pane](#1. Data Pane)
- [(三)Right (Query Settings) Pane / 右侧(查询设置)窗格](#(三)Right (Query Settings) Pane / 右侧(查询设置)窗格)
-
- [1. Query Settings Pane](#1. Query Settings Pane)
- [(四)Advanced Editor / 高级编辑器](#(四)Advanced Editor / 高级编辑器)
-
- [1. Advanced Editor](#1. Advanced Editor)
- [三、Power Query Home Tab Functions / Home选项卡功能](#三、Power Query Home Tab Functions / Home选项卡功能)
-
- [(一)Data Loading & Management / 数据加载与管理](#(一)Data Loading & Management / 数据加载与管理)
-
- [1. Close & Apply](#1. Close & Apply)
- [2. New Source / 新数据源](#2. New Source / 新数据源)
- [3. Recent Source / 最近使用的源](#3. Recent Source / 最近使用的源)
- [4. Enter Data / 输入数据](#4. Enter Data / 输入数据)
- [5. Data Source Settings / 数据源设置](#5. Data Source Settings / 数据源设置)
- [6. Manage Parameters / 管理参数](#6. Manage Parameters / 管理参数)
- [(二)Query Management / 查询管理](#(二)Query Management / 查询管理)
-
- [1. Refresh Preview / 刷新预览](#1. Refresh Preview / 刷新预览)
- [(三)Column & Row Management / 列和行管理](#(三)Column & Row Management / 列和行管理)
-
- [1. Choose Columns / 选择列](#1. Choose Columns / 选择列)
- [2. Remove Columns / 删除列](#2. Remove Columns / 删除列)
- [3. Keep Rows / 保留行](#3. Keep Rows / 保留行)
- [4. Remove Rows / 删除行](#4. Remove Rows / 删除行)
- [5. Sort / 排序](#5. Sort / 排序)
- [(四)Combine Operations / 合并操作](#(四)Combine Operations / 合并操作)
-
- [1. Append Queries / 追加查询](#1. Append Queries / 追加查询)
- [2. Merge Queries / 合并查询](#2. Merge Queries / 合并查询)
- [(五)Group By / 分组依据](#(五)Group By / 分组依据)
-
- [1. Group By](#1. Group By)
- [(六)Use First Row as Headers / 将第一行用作标题](#(六)Use First Row as Headers / 将第一行用作标题)
-
- [1. Use First Row as Headers](#1. Use First Row as Headers)
- [四、Transform Tab Functions / Transform选项卡功能](#四、Transform Tab Functions / Transform选项卡功能)
-
- [(一)Any Column / 任意列操作](#(一)Any Column / 任意列操作)
-
- [1. Detect Data Type / 检测数据类型](#1. Detect Data Type / 检测数据类型)
- [2. Change Type / 更改类型](#2. Change Type / 更改类型)
- [(二)Text Column / 文本列操作](#(二)Text Column / 文本列操作)
-
- [1. Split Column / 拆分列](#1. Split Column / 拆分列)
- [2. Merge Columns / 合并列](#2. Merge Columns / 合并列)
- [3. Format / 格式](#3. Format / 格式)
- [4. Extract / 提取](#4. Extract / 提取)
- [5. Fill / 填充](#5. Fill / 填充)
- [6. Replace Values / 替换值](#6. Replace Values / 替换值)
- [(三)Number Column / 数值列操作](#(三)Number Column / 数值列操作)
-
- [1. Rounding / 舍入](#1. Rounding / 舍入)
- [2. Statistics / 统计](#2. Statistics / 统计)
- [3. Standard / 标准运算](#3. Standard / 标准运算)
- [4. Scientific / 科学运算](#4. Scientific / 科学运算)
- [5. Trigonometric / 三角函数](#5. Trigonometric / 三角函数)
- [(四)Date & Time Transformations / 日期和时间转换](#(四)Date & Time Transformations / 日期和时间转换)
-
- [1. Date Extraction / 日期提取](#1. Date Extraction / 日期提取)
- [2. Time Extraction / 时间提取](#2. Time Extraction / 时间提取)
- [(五)Pivot & Unpivot / 透视与逆透视](#(五)Pivot & Unpivot / 透视与逆透视)
-
- [1. Pivot Column / 透视列](#1. Pivot Column / 透视列)
- [2. Unpivot Column / 逆透视列](#2. Unpivot Column / 逆透视列)
- [(六)Advanced Scripting / 高级脚本](#(六)Advanced Scripting / 高级脚本)
-
- [1. Run R Script / 运行R脚本](#1. Run R Script / 运行R脚本)
- [2. Run Python Script / 运行Python脚本](#2. Run Python Script / 运行Python脚本)
- [五、Add Column Tab Functions / Add Column选项卡功能](#五、Add Column Tab Functions / Add Column选项卡功能)
-
- [(一)Custom Columns / 自定义列](#(一)Custom Columns / 自定义列)
-
- [1. Custom Column / 自定义列](#1. Custom Column / 自定义列)
- [2. Conditional Column / 条件列](#2. Conditional Column / 条件列)
- [3. Invoke Custom Function / 调用自定义函数](#3. Invoke Custom Function / 调用自定义函数)
- [(二)Column Transformations / 列转换](#(二)Column Transformations / 列转换)
-
- [1. Duplicate Column / 复制列](#1. Duplicate Column / 复制列)
- [2. Extract / 提取](#2. Extract / 提取)
- [3. Parse / 解析](#3. Parse / 解析)
- [4. Format / 格式](#4. Format / 格式)
- [(三)Index & Rank / 索引与排名](#(三)Index & Rank / 索引与排名)
-
- [1. Index Column / 索引列](#1. Index Column / 索引列)
- [2. Rank Column / 排名列](#2. Rank Column / 排名列)
- [(四)Date, Time & Duration / 日期、时间和持续时间](#(四)Date, Time & Duration / 日期、时间和持续时间)
-
- [1. Date Section / 日期部分](#1. Date Section / 日期部分)
- [2. Time Section / 时间部分](#2. Time Section / 时间部分)
- [3. Duration Section / 持续时间部分](#3. Duration Section / 持续时间部分)
- [(五)Math & Statistics / 数学与统计](#(五)Math & Statistics / 数学与统计)
-
- [1. Statistics / 统计](#1. Statistics / 统计)
- [六、View Tab Functions / View选项卡功能](#六、View Tab Functions / View选项卡功能)
-
- [(一)Interface Customization / 界面定制](#(一)Interface Customization / 界面定制)
-
- [1. Formula Bar / 公式栏](#1. Formula Bar / 公式栏)
- [2. Monospaced / 等宽字体](#2. Monospaced / 等宽字体)
- [3. Show Whitespace / 显示空白字符](#3. Show Whitespace / 显示空白字符)
- [(二)Data Profiling / 数据剖析](#(二)Data Profiling / 数据剖析)
-
- [1. Column Quality / 列质量](#1. Column Quality / 列质量)
- [2. Column Distribution / 列分布](#2. Column Distribution / 列分布)
- [3. Column Profile / 列配置文件](#3. Column Profile / 列配置文件)
- [4. Query Dependencies / 查询依赖项](#4. Query Dependencies / 查询依赖项)
- [七、Tools Tab & Help Tab / Tools选项卡和Help选项卡](#七、Tools Tab & Help Tab / Tools选项卡和Help选项卡)
-
- [(一)Diagnostics / 诊断工具](#(一)Diagnostics / 诊断工具)
-
- [1. Diagnose Step / 诊断步骤](#1. Diagnose Step / 诊断步骤)
- [2. Start Diagnostics / 启动诊断](#2. Start Diagnostics / 启动诊断)
- [(二)Help Tab / 帮助选项卡](#(二)Help Tab / 帮助选项卡)
-
- [1. Help Resources](#1. Help Resources)
- [八、Basic Data Operations / 基础数据操作](#八、Basic Data Operations / 基础数据操作)
-
- [(一)Filtering Data / 数据筛选](#(一)Filtering Data / 数据筛选)
-
- [1. Filtering by Unchecking Values](#1. Filtering by Unchecking Values)
- [2. Number Filters / 数值筛选](#2. Number Filters / 数值筛选)
- [(二)Sorting Data / 数据排序](#(二)Sorting Data / 数据排序)
-
- [1. Single Column Sort](#1. Single Column Sort)
- [(三)Managing Data Types / 数据类型管理](#(三)Managing Data Types / 数据类型管理)
-
- [1. Change Data Type](#1. Change Data Type)
- [(四)Replace Values / 替换值](#(四)Replace Values / 替换值)
-
- [1. Replace Values Operation](#1. Replace Values Operation)
前言
This review notes compile the core knowledge of Power Query Editor from Chapter 3, presented in a bilingual structured format for exam preparation. Covers interface panes, ribbon tabs, transformation features, and basic data operations.
本复习笔记整理了第3章Power Query Editor的核心知识,采用中英双语结构化格式,便于期末备考。涵盖界面窗格、功能区选项卡、转换功能及基础数据操作。
一、Power Query Editor Overview / Power Query编辑器概述
(一)Definition and Role / 定义与作用
1. Power Query Editor
- Power Query Editor is a data preparation and transformation too l in Power BI Desktop that allows users to connect to multiple data sources, clean, shape, and transform raw data, and prepare it for analysis and visualization without modifying the original data source.
- Power Query Editor 是Power BI Desktop中的数据准备和转换工具 ,允许用户连接多个数据源,清洗、塑造和转换原始数据,为分析和可视化做准备,且不修改原始数据源。
2. Key Characteristics / 关键特征
- It does not modify the original data source, only shapes the data view.
它不修改原始数据源,仅塑造数据视图。 - Every transformation is recorded as an Applied Step and executed sequentially.
每次转换都被记录为应用步骤,并按顺序执行。 - The underlying data remains unchanged throughout the process.
底层数据在整个过程中保持不变。
(二)Power BI Workflow / Power BI工作流程
1. Connect to Data Sources / 连接数据源
Import data from files, databases, web sources, or cloud services using Get Data .
使用获取数据从文件、数据库、Web源或云服务导入数据。
2. Load Data into Power Query Editor / 加载数据到编辑器
Data is opened in Power Query Editor for inspection and preprocessing.
数据在Power Query Editor中打开,进行检查和预处理。
3. Clean the Data / 清洗数据
Remove nulls, duplicates, and unnecessary rows or columns. Fix incorrect or inconsistent values.
移除空值、重复项以及不必要的行或列。修正不正确或不一致的值。
4. Transform and Shape Data / 转换和塑造数据
- Change data types / 更改数据类型
- Split or merge columns / 拆分或合并列
- Pivot or unpivot data / 透视或逆透视数据
- Create calculated or conditional columns / 创建计算列或条件列
5. Apply Transformation Steps / 应用转换步骤
Each transformation is recorded as an Applied Step. Steps are executed sequentially and are editable.
每次转换都被记录为应用步骤,按顺序执行且可编辑。
二、Power Query Editor Interface Panes / Power Query编辑器界面窗格
(一)Left (Queries) Pane / 左侧(查询)窗格
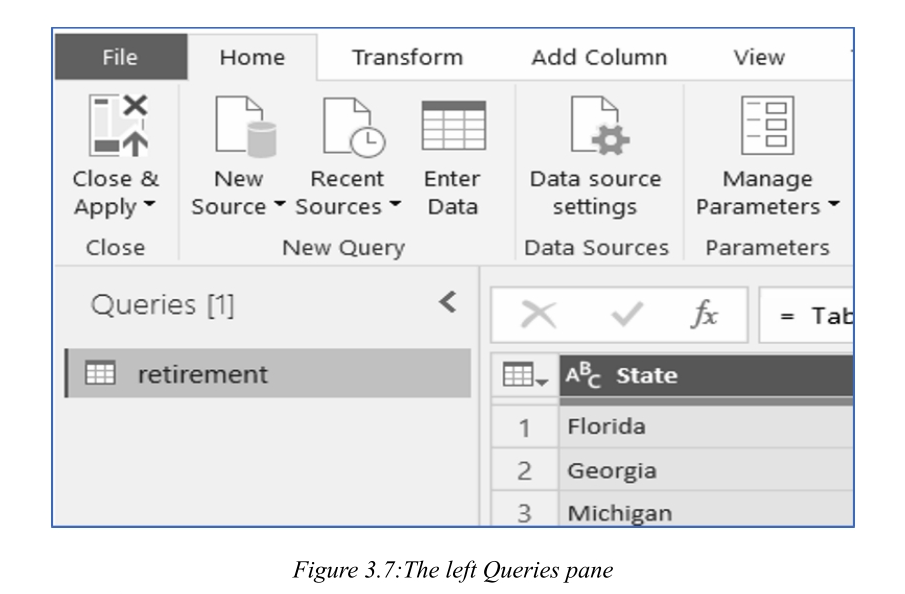
1. Queries Pane
The left pane (Queries pane) displays the number of active queries and the name of each query. When you select a query, its data is displayed in the center pane for shaping and transformation.
左侧窗格(查询窗格) 显示活动查询数量和每个查询的名称。选择查询时,其数据显示在中心窗格中,供塑造和转换。
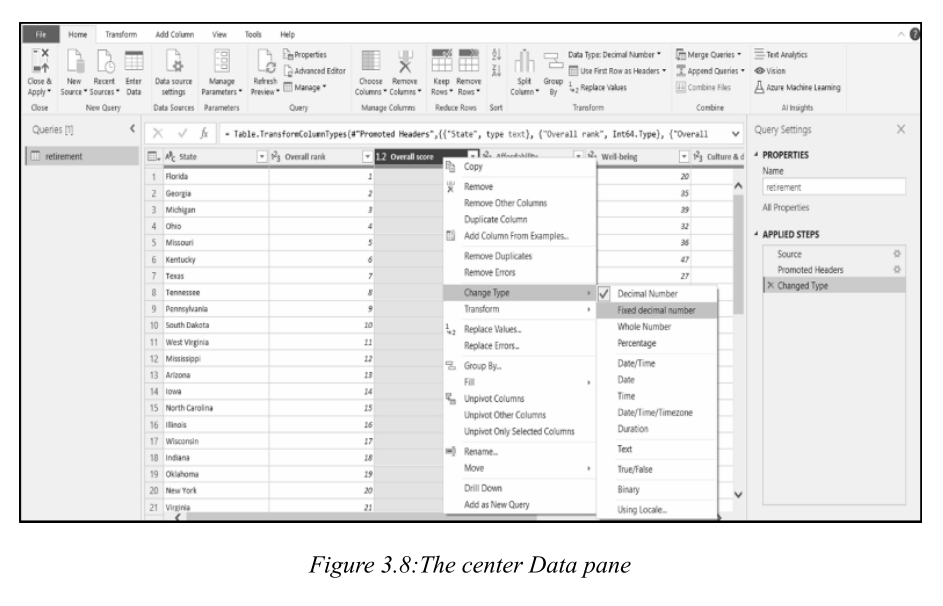
(二)Center (Data) Pane / 中心(数据)窗格
1. Data Pane
The center pane (Data pane) displays data from the selected query. This is where most of the transformation work is accomplished. Right-click menu items offer the same options as ribbon buttons.
中心窗格(数据窗格) 显示所选查询的数据。这是完成大部分转换工作的地方。右键菜单项提供与功能区按钮相同的选项。
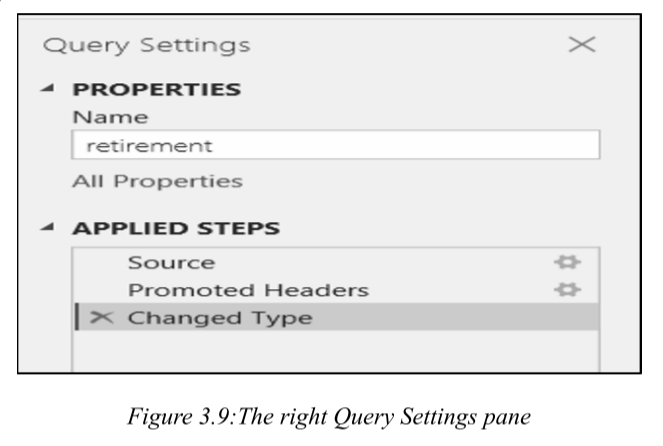
(三)Right (Query Settings) Pane / 右侧(查询设置)窗格
1. Query Settings Pane
The right pane (Query Settings pane) displays all steps associated with a query in the Applied Steps section. Additional shaping steps are captured here sequentially.
右侧窗格(查询设置窗格) 在应用步骤部分显示与查询关联的所有步骤。额外的塑造步骤按顺序在此捕获。
- Important: The underlying data isn't changed; Power Query Editor adjusts its view of the data.
重要提示:底层数据未更改;Power Query Editor调整其数据视图。
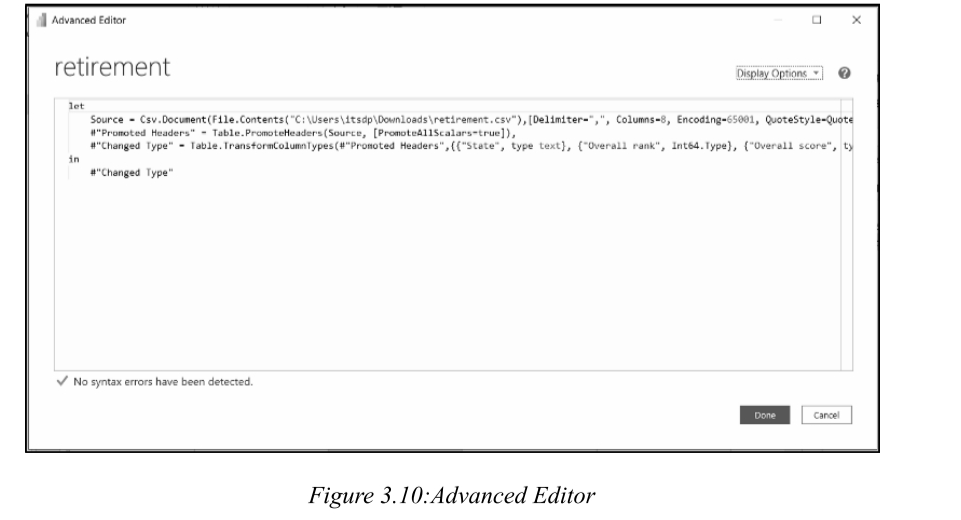
(四)Advanced Editor / 高级编辑器
1. Advanced Editor
The Advanced Editor lets you view the M code that Power Query Editor creates with each step, and also allows you to write your own shaping code. To launch, select View → Advanced Editor .
高级编辑器 允许查看Power Query Editor为每个步骤创建的M代码,也允许编写自己的塑造代码。通过选择 视图 → 高级编辑器 启动。
三、Power Query Home Tab Functions / Home选项卡功能
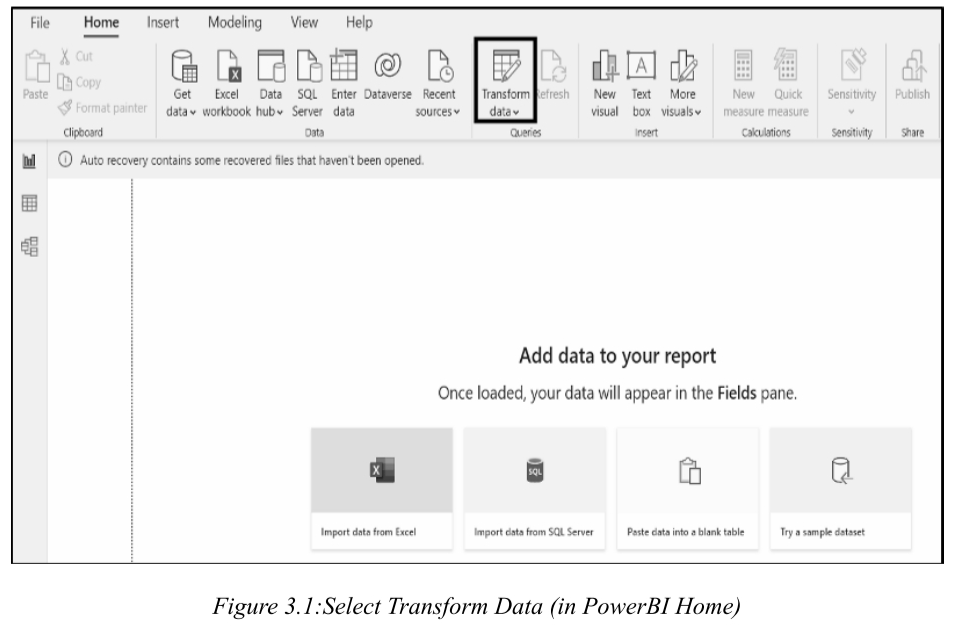
- In Power BI Query Editor, the ribbon at the top contains multiple tabs, each offering different transformation and data manipulation options. Here's a breakdown of the main tabs in Power Query Editor:
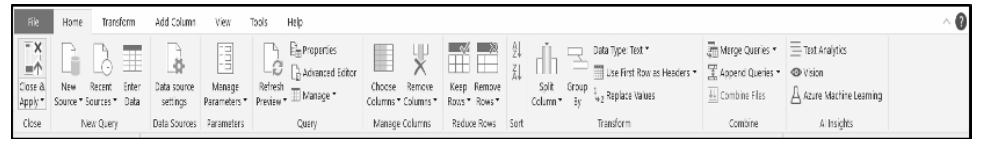
(一)Data Loading & Management / 数据加载与管理
1. Close & Apply
Finalizes all changes made in Power Query Editor and loads the transformed data back into Power BI's data model. Use Close & Load To for connection-only or direct report loading.
完成Power Query Editor中的所有更改,并将转换后的数据加载回Power BI数据模型。使用关闭并应用至可选择仅连接或直接加载到报表。
2. New Source / 新数据源
Allows connection to a new data source, including databases (SQL Server, MySQL), files (Excel, CSV), web services, and more.
允许连接新数据源,包括数据库(SQL Server、MySQL)、文件(Excel、CSV)、Web服务等。
3. Recent Source / 最近使用的源
Displays a list of recently used data sources for quicker reconnection.
显示最近使用的数据源列表,便于快速重新连接。
4. Enter Data / 输入数据
Opens a spreadsheet-style editor for manual data input. Useful for creating small lookup tables or static reference lists.
打开电子表格样式的编辑器,用于手动输入数据。适用于创建小型查找表或静态参考列表。
5. Data Source Settings / 数据源设置
Data Source Settings allows users to view, manage, and modify data connections. It lists all data sources with details like file path, authentication method, and privacy level. Useful for updating paths or credentials without rebuilding reports.
数据源设置 允许查看、管理和修改数据连接。列出所有数据源及其文件路径、认证方式和隐私级别等信息。适用于在不重建报告的情况下更新路径或凭据。
6. Manage Parameters / 管理参数
Manage Parameters enables creation of dynamic and reusable values within queries. Parameters can be used for filtering, defining data source paths, setting thresholds, or any value that needs to be reused or changed easily.
管理参数 允许在查询中创建动态可重用值。参数可用于筛选、定义数据源路径、设置阈值或任何需要轻松重用或更改的值。
(二)Query Management / 查询管理
1. Refresh Preview / 刷新预览
Updates data previews with the latest source data.
使用最新源数据更新数据预览。
(三)Column & Row Management / 列和行管理
1. Choose Columns / 选择列
Allows selective retention of relevant columns from a dataset. Opens a checklist dialog to deselect unnecessary columns, simplifying the data model and improving performance.
允许有选择地保留数据集中的相关列。打开清单对话框取消选择不必要的列,简化数据模型并提高性能。
2. Remove Columns / 删除列
Provides a direct way to eliminate one or more selected columns. Often used to discard irrelevant data, metadata, or unused fields.
提供直接删除一个或多个选定列的方法。常用于丢弃不相关数据、元数据或未使用字段。
3. Keep Rows / 保留行
Retains specific rows based on conditions or position: top rows, bottom rows, a specific range, or rows matching a filter.
基于条件或位置保留特定行:顶部行、底部行、特定范围或匹配筛选的行。
4. Remove Rows / 删除行
Deletes rows that are not required: top/bottom rows, blank rows, or duplicates. Helps cleanse the dataset.
删除不需要的行:顶部/底部行、空行或重复项。有助于清洗数据集。
5. Sort / 排序
Arranges data in ascending or descending order based on one or more columns. Useful for improving readability and ensuring accuracy of subsequent operations.
基于一个或多个列按升序或降序排列数据。适用于提高可读性和确保后续操作的准确性。
(四)Combine Operations / 合并操作
1. Append Queries / 追加查询
Combines two or more tables by adding rows (stacking vertically).
通过添加行(垂直堆叠)组合两个或多个表。
2. Merge Queries / 合并查询
Joins two tables based on a common column (like SQL JOIN).
基于共同列联接两个表(类似SQL JOIN)。
(五)Group By / 分组依据
1. Group By
Groups data based on one or more columns. Useful for aggregating data (summing, averaging) after categorization.
基于一个或多个列对数据进行分组。适用于分类后进行数据聚合(求和、平均值)。
(六)Use First Row as Headers / 将第一行用作标题
1. Use First Row as Headers
Promotes values in the first row to become official column headers. Commonly used when importing CSV, Excel, or web sources where headers are not correctly interpreted.
将第一行中的值提升为正式列标题。常用于导入CSV、Excel或Web源时标头未被正确解释的情况。
四、Transform Tab Functions / Transform选项卡功能
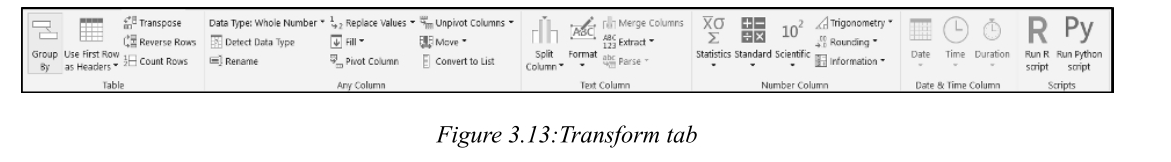
(一)Any Column / 任意列操作
1. Detect Data Type / 检测数据类型
Automatically identifies column data types.
自动识别列数据类型。
2. Change Type / 更改类型
Manually set data type: Text, Whole Number, Decimal Number, Date/Time, Boolean, etc.
手动设置数据类型:文本、整数、小数、日期/时间、布尔值等。
(二)Text Column / 文本列操作
1. Split Column / 拆分列
Divides a column into multiple columns based on a delimiter or by number of characters. Useful for parsing compound data like full names, dates with time, or codes.
基于分隔符或字符数将一列拆分为多列。适用于解析复合数据,如全名、带时间的日期或编码。
2. Merge Columns / 合并列
Combines multiple columns into one.
将多个列合并为一列。
3. Format / 格式
- Convert text to uppercase/lowercase / 转换为大写/小写
- Trim extra spaces / 修剪多余空格
- Add prefixes or suffixes / 添加前缀或后缀
- Capitalize each word / 每个单词首字母大写
4. Extract / 提取
Extracts specific parts of a text string: first/last characters, text before/after a delimiter, or a specific character range.
提取文本字符串的特定部分:首/尾字符、分隔符前后的文本或特定字符范围。
5. Fill / 填充
Fill Down copies the most recent non-blank value downward to fill empty cells; Fill Up does the reverse. Useful for hierarchical or grouped data.
向下填充 将最近的非空值向下复制以填充空单元格;向上填充 反之。适用于层次结构或分组数据。
6. Replace Values / 替换值
Substitutes specific values within a column with new ones. Useful for standardizing inconsistent, misspelled, or outdated entries. Non-destructive and recorded as an Applied Step.
将列中的特定值替换为新值。适用于标准化不一致、拼写错误或过时的条目。非破坏性,记录为应用步骤。
(三)Number Column / 数值列操作
1. Rounding / 舍入
Standard rounding, rounding up, rounding down, rounding towards or away from zero. Essential for standardizing financial and numeric data.
标准舍入、向上舍入、向下舍入、向零舍入或远离零舍入。对标准化财务和数值数据至关重要。
2. Statistics / 统计
Generates summary statistics: Sum, Min, Max, Average, Median, Standard Deviation, Count.
生成摘要统计信息:总和、最小值、最大值、平均值、中位数、标准差、计数。
3. Standard / 标准运算
Common mathematical operations: Addition, Subtraction, Multiplication, Division, Modulo, Percentage calculation.
常见数学运算:加法、减法、乘法、除法、取模、百分比计算。
4. Scientific / 科学运算
Exponentials, Logarithms, Powers, Square roots. Used in scientific and engineering analysis.
指数、对数、幂、平方根。用于科学和工程分析。
5. Trigonometric / 三角函数
Sine, Cosine, Tangent, and their inverses. Used in mathematical and geospatial contexts.
正弦、余弦、正切及其反函数。用于数学和地理空间领域。
(四)Date & Time Transformations / 日期和时间转换
1. Date Extraction / 日期提取
Extract Year, Quarter, Month, Week, Day from a date field. Add or subtract days, calculate age or duration.
从日期字段中提取年、季度、月、周、日。加减天数,计算年龄或持续时间。
2. Time Extraction / 时间提取
Extract Hours, Minutes, Seconds. Perform arithmetic between time values.
提取小时、分钟、秒。对时间值执行算术运算。
(五)Pivot & Unpivot / 透视与逆透视
1. Pivot Column / 透视列
Transforms unique values within a column into separate new columns, creating a cross-tabulated summary format. User must specify a value column for aggregation (sum, count, etc.).
将列中的唯一值转换为单独的新列,创建交叉表格式摘要。必须指定值列用于聚合(求和、计数等)。
2. Unpivot Column / 逆透视列
Normalizes data by converting columns into attribute-value pairs. Transforms wide tables into analytical-friendly row-based structures. Essential for creating visuals and filters that rely on categorical fields.
通过将列转换为属性-值对来规范化数据。将宽表转换为适合分析的行结构。对于创建依赖分类字段的视觉对象和筛选器至关重要。
(六)Advanced Scripting / 高级脚本
1. Run R Script / 运行R脚本
Leverages R language for complex data transformation, statistical modeling, or visualization within Power Query. Requires R installation and configuration.
利用R语言在Power Query中执行复杂数据转换、统计建模或可视化。需要安装和配置R。
2. Run Python Script / 运行Python脚本
Extends transformation capabilities using Python with libraries like pandas, NumPy, scikit-learn. Power BI imports resulting data frame back into the query pipeline. Requires Python installation.
使用Python和pandas、NumPy、scikit-learn等库扩展转换能力。Power BI将生成的数据帧导入回查询管道。需要安装Python。
五、Add Column Tab Functions / Add Column选项卡功能
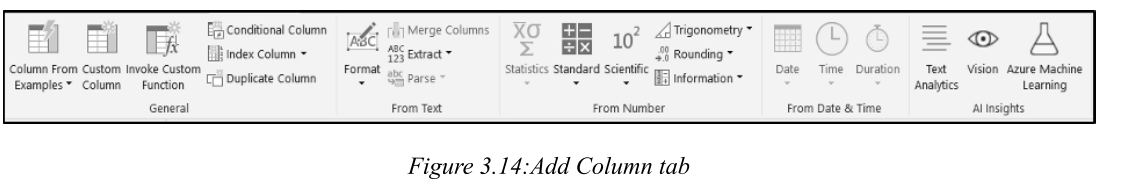
(一)Custom Columns / 自定义列
1. Custom Column / 自定义列
Allows writing M code expressions to generate new columns based on logic, arithmetic, or string manipulation. Essential for derived metrics and complex business rules.
允许编写M代码表达式,基于逻辑、算术或字符串操作生成新列。对派生指标和复杂业务规则至关重要。
2. Conditional Column / 条件列
Adds a column with if-then-else logic via user-friendly interface. Classifies records (e.g., "High"/"Medium"/"Low" based on sales) without writing code.
通过用户友好界面添加具有if-then-else逻辑的列。无需编写代码即可对记录进行分类。
3. Invoke Custom Function / 调用自定义函数
Applies a predefined or user-defined Power Query function to columns or tables. Promotes modularity and reusability of logic.
将预定义或用户定义的Power Query函数应用于列或表。提高逻辑的模块化和可重用性。
(二)Column Transformations / 列转换
1. Duplicate Column / 复制列
Creates a copy of an existing column.
创建现有列的副本。
2. Extract / 提取
Generates a new column by pulling out specific portions of a text string: first/last characters, text before/after delimiter.
通过提取文本字符串的特定部分生成新列:首/尾字符、分隔符前后的文本。
3. Parse / 解析
Interprets structured text formats like JSON or XML and converts them into tabular columns. Useful for API data integration.
解析JSON或XML等结构化文本格式并转换为表格列。适用于API数据集成。
4. Format / 格式
Creates a new column that transforms text values into a desired format without modifying the original column.
创建新列,将文本值转换为所需格式而不修改原始列。
(三)Index & Rank / 索引与排名
1. Index Column / 索引列
Adds a row number starting from 0 or 1.
添加从0或1开始的行号。
2. Rank Column / 排名列
Assigns a ranking based on a column's values.
基于列的值分配排名。
(四)Date, Time & Duration / 日期、时间和持续时间
1. Date Section / 日期部分
Creates new columns by extracting year, month, quarter, week, or day from a date value.
通过从日期值中提取年、月、季度、周或日创建新列。
2. Time Section / 时间部分
Derives new columns from time values by extracting hours, minutes, or seconds.
通过提取小时、分钟或秒从时间值派生新列。
3. Duration Section / 持续时间部分
Computes or manipulates duration values. Extract total days, hours, minutes, or seconds from a duration.
计算或操作持续时间值。从持续时间中提取总天数、小时数、分钟数或秒数。
(五)Math & Statistics / 数学与统计
1. Statistics / 统计
Derives statistical values: Minimum, Maximum, Average, Median, Standard Deviation, Variance on a row-level basis.
在行级别派生统计值:最小值、最大值、平均值、中位数、标准差、方差。
六、View Tab Functions / View选项卡功能
(一)Interface Customization / 界面定制
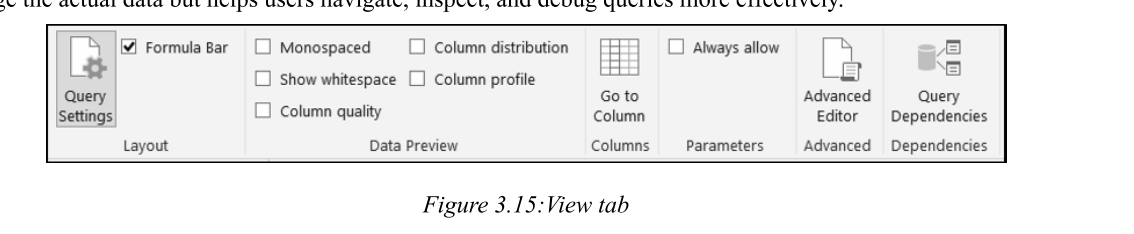
1. Formula Bar / 公式栏
Displays the M code for the selected transformation step. Allows viewing and editing of M formulas, auditing transformations, troubleshooting errors, and replicating steps.
显示所选转换步骤的M代码。允许查看和编辑M公式、审计转换、排查错误和复制步骤。
2. Monospaced / 等宽字体
Changes the font to a fixed-width typeface (Consolas). Improves readability for code snippets, fixed-width files, and formatted strings.
将字体更改为等宽字体(Consolas)。提高代码片段、固定宽度文件和格式化字符串的可读性。
3. Show Whitespace / 显示空白字符
Visually displays invisible characters like spaces, tabs, and line breaks. Helps in cleaning textual data with leading/trailing spaces or hidden control characters.
可视化显示空格、制表符和换行符等不可见字符。有助于清洗含有前导/尾随空格或隐藏控制字符的文本数据。
(二)Data Profiling / 数据剖析
1. Column Quality / 列质量
Shows a colored bar above each column displaying the percentage of valid, error, and empty values. Helps quickly identify problematic columns with data issues.
在每个列上方显示彩色条,显示有效值、错误值和空值的百分比。有助于快速识别有数据问题的列。
2. Column Distribution / 列分布
Provides a horizontal histogram representing the frequency of distinct values. Shows the count of unique and distinct values per column. Valuable for understanding data variability and spotting duplicates.
提供表示不同值频率的水平直方图。显示每列的唯一值和不同值计数。对理解数据变异性和发现重复项很有价值。
3. Column Profile / 列配置文件
Provides detailed statistical and structural summary of a selected column: count, error count, empty count, distinct values, min, max, average, standard deviation, and value distribution chart. Activated in the bottom pane.
提供选定列的详细统计和结构摘要:计数、错误计数、空计数、不同值、最小值、最大值、平均值、标准差和值分布图。在底部窗格中激活。
4. Query Dependencies / 查询依赖项
Shows a flowchart of how queries are linked.
显示查询之间链接方式的流程图。
七、Tools Tab & Help Tab / Tools选项卡和Help选项卡
(一)Diagnostics / 诊断工具
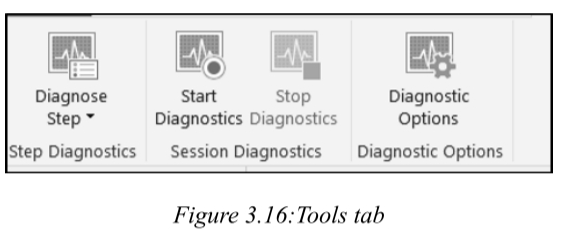
1. Diagnose Step / 诊断步骤
Analyzes the performance and behavior of specific transformation steps. Captures metrics like duration, data volume, and processing load. Helps pinpoint performance bottlenecks.
分析特定转换步骤的性能和行为。捕获持续时间、数据量和处理负载等指标。有助于精确定位性能瓶颈。
2. Start Diagnostics / 启动诊断
Provides comprehensive performance analysis of the entire Power Query process. Tracks execution time, CPU usage, and rows processed per step. Generates a diagnostics query with performance logs.
提供整个Power Query过程的综合性能分析。跟踪执行时间、CPU使用率和每步处理的行数。生成包含性能日志的诊断查询。
(二)Help Tab / 帮助选项卡
1. Help Resources
Provides resources, documentation, and support options. Helps users find guidance, access learning materials, and troubleshoot issues.
提供资源、文档和支持选项。帮助用户查找指南、访问学习材料和排查问题。
八、Basic Data Operations / 基础数据操作
(一)Filtering Data / 数据筛选
1. Filtering by Unchecking Values
Click the dropdown arrow on a column, uncheck unwanted values (e.g., "unknow") from the list to remove those rows. Commonly used to filter out null or invalid entries.
单击列的下拉箭头,从列表中取消选中不需要的值(如"unknow")以删除这些行。常用于过滤空值或无效条目。
2. Number Filters / 数值筛选
Use Number Filters to filter rows based on numeric conditions. Example: Keep rows where Rating is greater than 3 or less than 4. Select "Greater Than" or "Less Than" and set the threshold values.
使用数字筛选器基于数值条件筛选行。示例:保留Rating大于3或小于4的行。选择"大于"或"小于"并设置阈值。
(二)Sorting Data / 数据排序
1. Single Column Sort
Click the column header to toggle between ascending and descending order. Improves readability and helps identify top performers or trends.
单击列标题在升序和降序之间切换。提高可读性,有助于识别前几名或趋势。
(三)Managing Data Types / 数据类型管理
1. Change Data Type
Right-click the column header → Change Type → select appropriate data type (Text, Whole Number, Decimal Number, Date/Time, Boolean). Correct data types are essential for accurate calculations and visualizations.
右键单击列标题 → 更改类型 → 选择适当的数据类型(文本、整数、小数、日期/时间、布尔值)。正确的数据类型对准确计算和可视化至关重要。
(四)Replace Values / 替换值
1. Replace Values Operation
Replace Values substitutes specific values within a column with new ones. Useful for standardizing inconsistent entries. For example, standardize "NY", "N.Y.", "New York" to "New York". Also corrects null values or replaces errors with meaningful text. Non-destructive and recorded as steps.
替换值 将列中的特定值替换为新值。适用于标准化不一致的条目。例如,将"NY"、"N.Y."、"New York"标准化为"New York"。也可修正空值或用有意义文本替换错误。非破坏性且记录为步骤。