Node Exporter + Prometheus + Grafana
本文档介绍如何在 Ubuntu 24.04 上安装 Node Exporter、Prometheus 和 Grafana。
| 软件 | 安装 | 说明 |
|---|---|---|
| Node Exporter | Github release 包 | 安装在宿主机上 |
| Prometheus | docker 安装 | 无宿主机依赖要求,用 docker 安装 |
| Grafana | docker 安装 | 无宿主机依赖要求,用 docker 安装 |
一、Node Exporter
(一)下载 release 包
bash
wget https://github.com/prometheus/node_exporter/releases/download/v1.11.1/node_exporter-1.11.1.linux-amd64.tar.gz(二)解压
bash
tar -zxvf node_exporter-1.11.1.linux-amd64.tar.gz
bash
# 目录中包含 node_exporter 可执行文件
node_exporter-1.11.1.linux-amd64$ ls
LICENSE  node_exporter  NOTICE
(三)移动专属目录
1. 创建专属目录
bash
sudo mkdir /opt/node_exporter2. 复制 node_exporter 可执行文件到专属目录
bash
sudo cp ./node_exporter /opt/node_exporter/3. 给 node_exporter 可执行文件添加执行权限
bash
sudo chmod +x /opt/node_exporter/node_exporter(四)配置 Systemd 服务
1. 创建 Systemd 服务文件
bash
sudo nano /etc/systemd/system/node_exporter.service写入以下内容(注意 ExecStart 的路径):
ini
[Unit]
Description=Prometheus Node Exporter
After=network-online.target

[Service]
User=node_exporter
Group=node_exporter
Type=simple
ExecStart=/opt/node_exporter/node_exporter

[Install]
WantedBy=multi-user.target
2. 创建专用 node_exporter 用户
创建用户
bash
sudo useradd --no-create-home --shell /bin/false node_exporter参数解释:
--no-create-home: 不创建用户家目录--shell /bin/false: 将该用户的默认 Shell 设置为/bin/false,防止用户登录node_exporter: 用户名
读取和执行权限
bash
sudo chown -R node_exporter:node_exporter /opt/node_exporter(五)启动并验证服务
1. 重新加载 Systemd 配置
bash
sudo systemctl daemon-reload2. 启动服务并设置开机自启
bash
sudo systemctl enable --now node_exporter3. 检查运行状态
bash
sudo systemctl status node_exporter(六)验证数据
1. 在浏览器中验证(最直观)
打开浏览器(主机就可以,不需要虚拟机),在地址栏输入:
plaintext
http://<您虚拟机的IP地址>:9100/metrics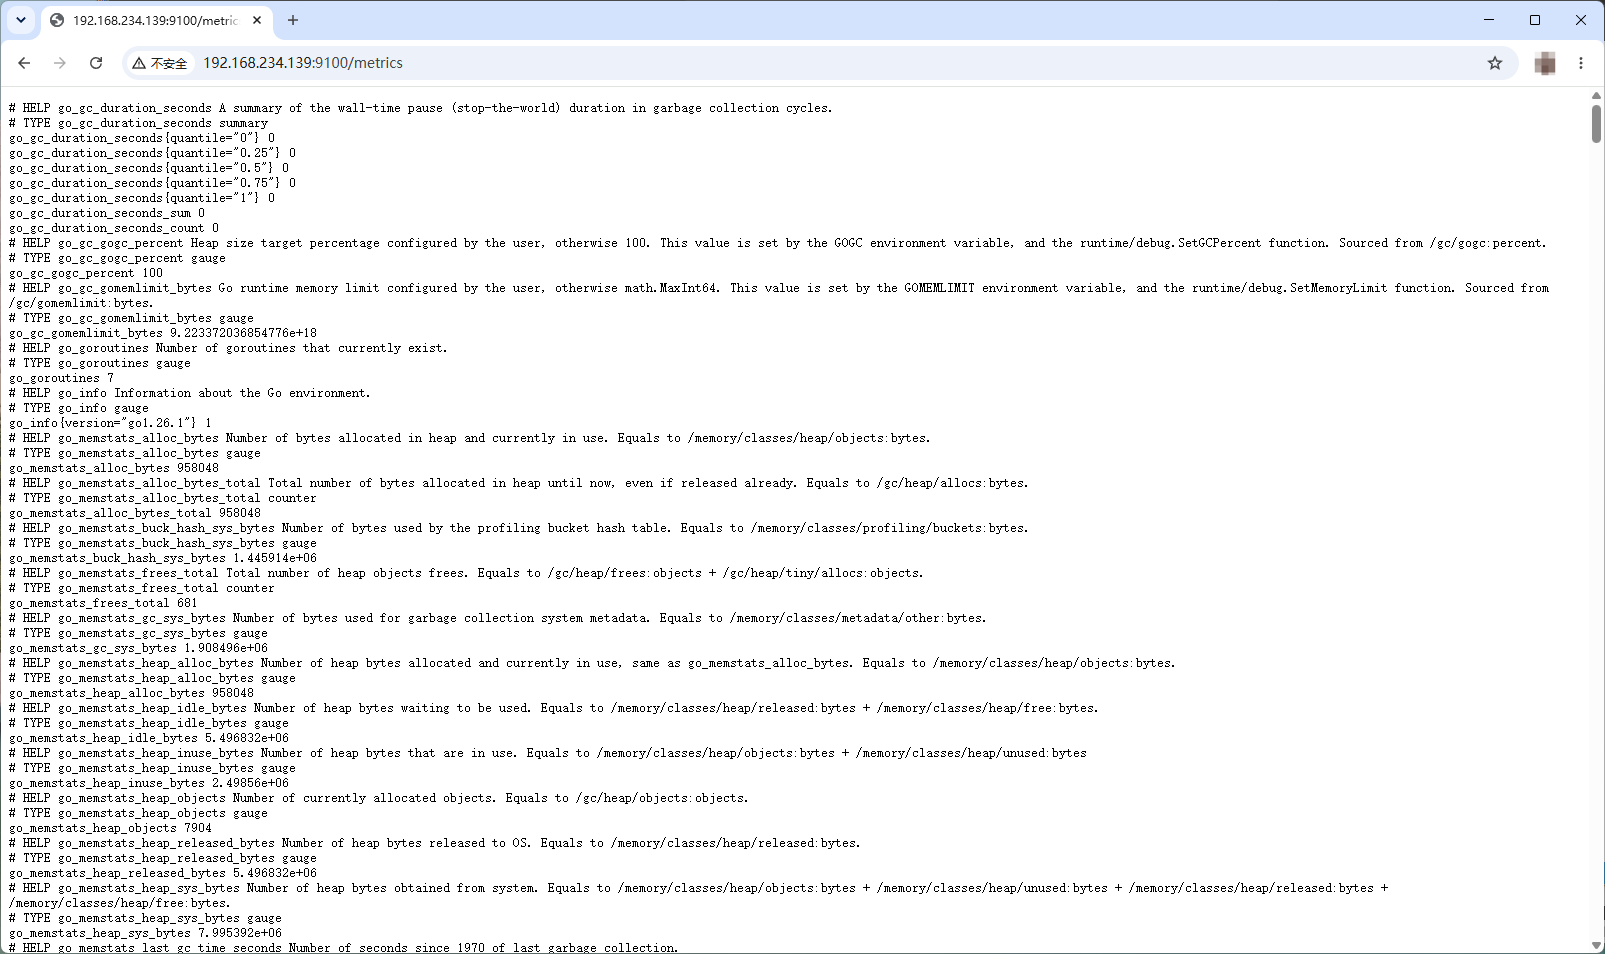
2. 在终端中验证(最快)
在当前的终端中,执行以下命令:
bash
curl -s http://localhost:9100/metrics | head -n 15如果一切正常,会看到类似下面这样的文本输出,包含大量的 # HELP 和 node_ 开头的指标数据:
plaintext
# HELP go_gc_duration_seconds A summary of the wall-time pause (stop-the-world) duration in garbage collection cycles.
# TYPE go_gc_duration_seconds summary
go_gc_duration_seconds{quantile="0"} 1.9215e-05
go_gc_duration_seconds{quantile="0.25"} 3.921e-05
go_gc_duration_seconds{quantile="0.5"} 8.7665e-05
go_gc_duration_seconds{quantile="0.75"} 0.000221364
go_gc_duration_seconds{quantile="1"} 0.000286378
go_gc_duration_seconds_sum 0.000653832
go_gc_duration_seconds_count 5
# HELP go_gc_gogc_percent Heap size target percentage configured by the user, otherwise 100. This value is set by the GOGC environment variable, and the runtime/debug.SetGCPercent function. Sourced from /gc/gogc:percent.
# TYPE go_gc_gogc_percent gauge
go_gc_gogc_percent 100
# HELP go_gc_gomemlimit_bytes Go runtime memory limit configured by the user, otherwise math.MaxInt64. This value is set by the GOMEMLIMIT environment variable, and the runtime/debug.SetMemoryLimit function. Sourced from /gc/gomemlimit:bytes.
# TYPE go_gc_gomemlimit_bytes gauge
go_gc_gomemlimit_bytes 9.223372036854776e+18
二、docker & docker compose
Prometheus 和 Grafana 使用 docker 安装,这里介绍安装 docker 和 docker compose。
(一)安装必要依赖
bash
sudo apt update
bash
sudo apt install -y ca-certificates curl gnupg(二)创建密钥环目录并添加 Docker 官方的 GPG 密钥(使用阿里云加速)
bash
sudo install -m 0755 -d /etc/apt/keyrings
bash
sudo curl -fsSL https://mirrors.aliyun.com/docker-ce/linux/ubuntu/gpg -o /etc/apt/keyrings/docker.asc
bash
sudo chmod a+r /etc/apt/keyrings/docker.asc(三)将 Docker 的 apt 仓库源添加到系统中
bash
echo \
  "deb [arch=$(dpkg --print-architecture) signed-by=/etc/apt/keyrings/docker.asc] https://mirrors.aliyun.com/docker-ce/linux/ubuntu \
  $(. /etc/os-release && echo "$VERSION_CODENAME") stable" | \
  sudo tee /etc/apt/sources.list.d/docker.list > /dev/null
(四)再次更新 apt 索引,并安装 Docker 引擎及 Compose V2 插件
bash
sudo apt update
bash
sudo apt install -y docker-ce docker-ce-cli containerd.io docker-buildx-plugin docker-compose-plugin(五)将当前用户加入 docker 组(免 sudo 执行 docker 命令)
bash
sudo usermod -aG docker $USER(六)验证安装
bash
sudo docker --version
bash
# 注意:compose 后面是空格,不是连字符
sudo docker compose version
(七)让当前终端立刻生效 docker 组权限(这样后面敲命令就不用一直加 sudo 了)
bash
newgrp docker三、Prometheus
(一)创建目录结构与设置权限
1. 创建主目录和 Prometheus 的专属子目录(包含配置目录和数据目录)
bash
sudo mkdir -p /opt/monitoring/prometheus/data2. 给 Prometheus 的数据目录赋予正确的权限 (容器内是 nobody 用户,UID 65534)
bash
sudo chown -R 65534:65534 /opt/monitoring/prometheus/data3. 进入主工作目录
bash
cd /opt/monitoring(二)编写 Prometheus 配置文件
在 Prometheus 自己的目录下,创建它的配置文件:
bash
sudo nano prometheus/prometheus.yml粘贴以下内容,保存并退出
yaml
global:
  scrape_interval: 15s

scrape_configs:
  - job_name: 'prometheus'
    static_configs:
      - targets: ['localhost:9090']

  - job_name: 'node_exporter'
    static_configs:
      # 使用魔法域名跨越网络访问宿主机上的 Node Exporter
      - targets: ['host.docker.internal:9100']
(三)编写 docker-compose.yml (仅包含 Prometheus)
在主目录(monitoring/)下,创建总控文件。注意看 volumes 里的路径,现在它们指向了子文件夹。
bash
sudo nano docker-compose.yml粘贴以下内容,保存并退出:
yaml
services:
  prometheus:
    image: prom/prometheus:latest
    container_name: prometheus
    restart: unless-stopped
    volumes:
      # 注意这里的路径变化:指向了 prometheus 子文件夹
      - ./prometheus/prometheus.yml:/etc/prometheus/prometheus.yml
      - ./prometheus/data:/prometheus
    ports:
      - "9090:9090"
    # 核心魔法:让容器能通过 host.docker.internal 访问宿主机
    extra_hosts:
      - "host.docker.internal:host-gateway"
(四)启动 Prometheus
确保还在 monitoring/ 主目录下(也就是 docker-compose.yml 所在的目录),执行:
bash
docker compose up -d第一次运行会下载镜像,看到 Started 即可。
bash
/opt/monitoring$ docker compose up -d
[+] up 13/13
✔ Image prom/prometheus:latest Pulled 28.4s
✔ Network monitoring_default Created 0.8s
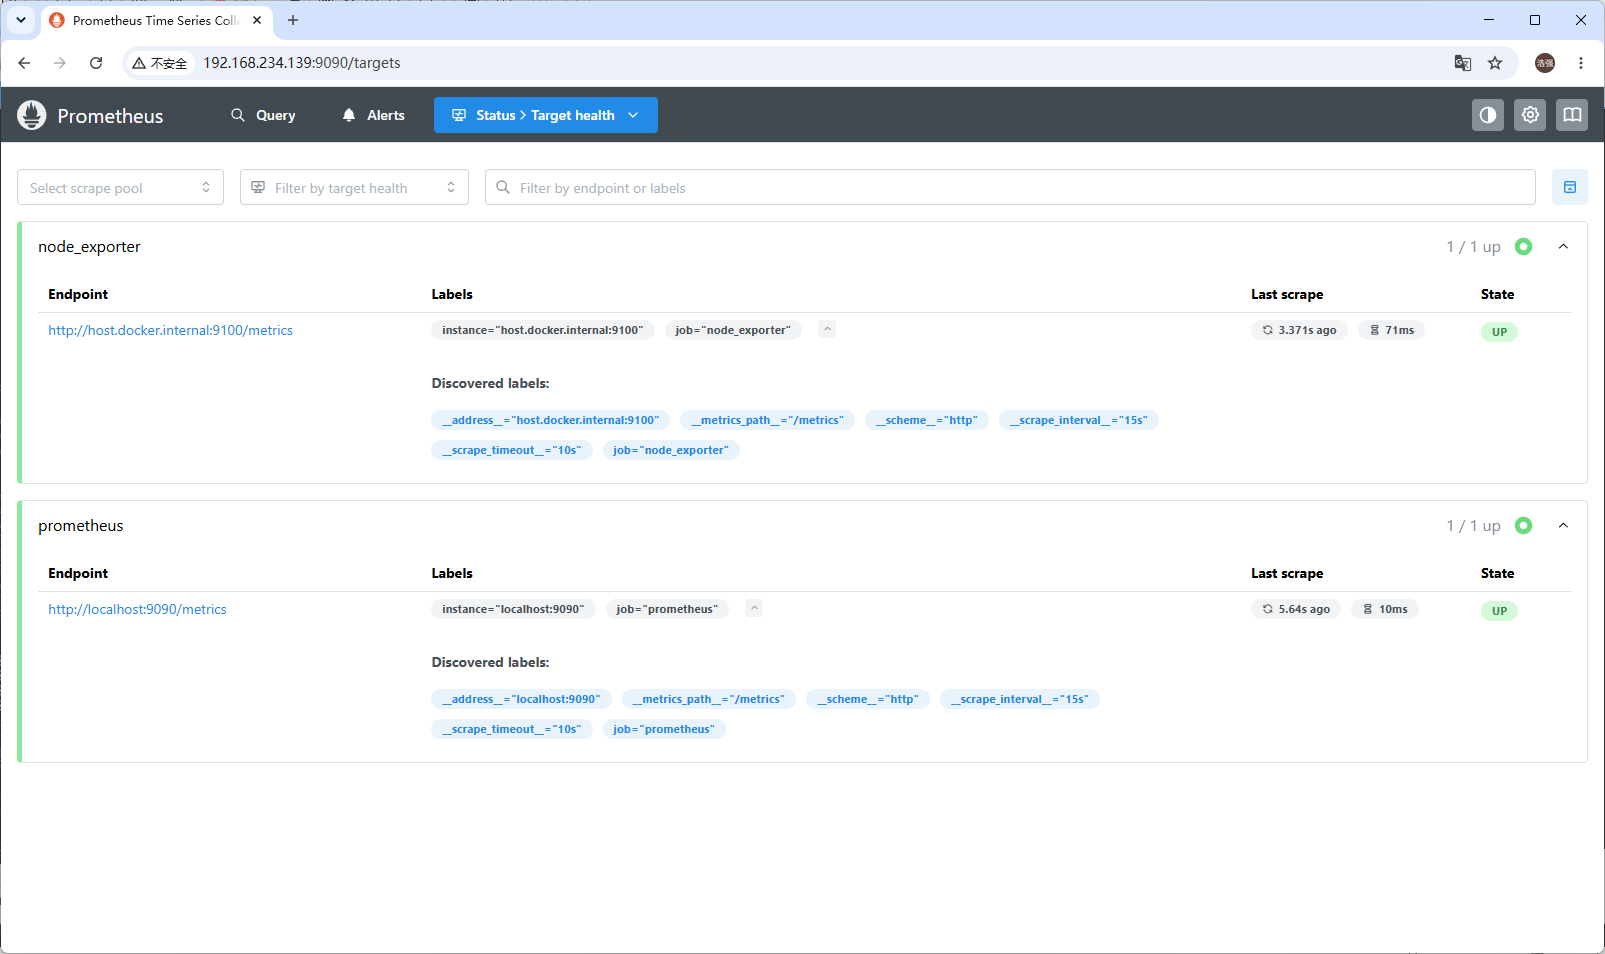
✔ Container prometheus Started 12.9s(五)验证 Prometheus
确保 Prometheus 已经成功启动
打开浏览器,访问:http://<您的虚拟机IP>:9090/targets
验收标准:
- 页面能正常打开。
- 在 "Targets" 列表中,
prometheus状态是绿色的 UP。 - 最重要的一点:
node_exporter状态也必须是绿色的 UP。
(如果node_exporter是红色的 DOWN,通常是宿主机防火墙拦截了,请在终端执行sudo ufw allow 9100/tcp后刷新页面重试。)
四、Grafana
(一)创建目录结构与设置权限
1. 创建主目录和 Grafana 的专属子目录(用于持久化仪表盘/数据)
bash
sudo mkdir -p /opt/monitoring/grafana2. 给 Grafana 的数据目录赋予正确的权限
Grafana 容器内使用 grafana 用户 (UID 472)
bash
sudo chown -R 472:472 /opt/monitoring/grafana(二)编写 docker-compose.yml (追加 Grafana 服务)
打开 compose 文件
bash
nano docker-compose.yml在文件末尾(prometheus 服务后面)添加以下内容:
yaml
  grafana:
    image: grafana/grafana:latest
    container_name: grafana
    ports:
      - "3000:3000"
    volumes:
      - ./grafana:/var/lib/grafana
    depends_on:
      - prometheus
    restart: unless-stopped
(三)启动 Grafana
确保还在 monitoring/ 主目录下(也就是 docker-compose.yml 所在的目录),执行:
bash
docker compose up -d第一次运行会下载镜像,看到 Started 即可。
bash
/opt/monitoring$ docker compose up -d
[+] up 14/14
✔ Image grafana/grafana:latest Pulled 158.7s
✔ Container prometheus Running 0.0s
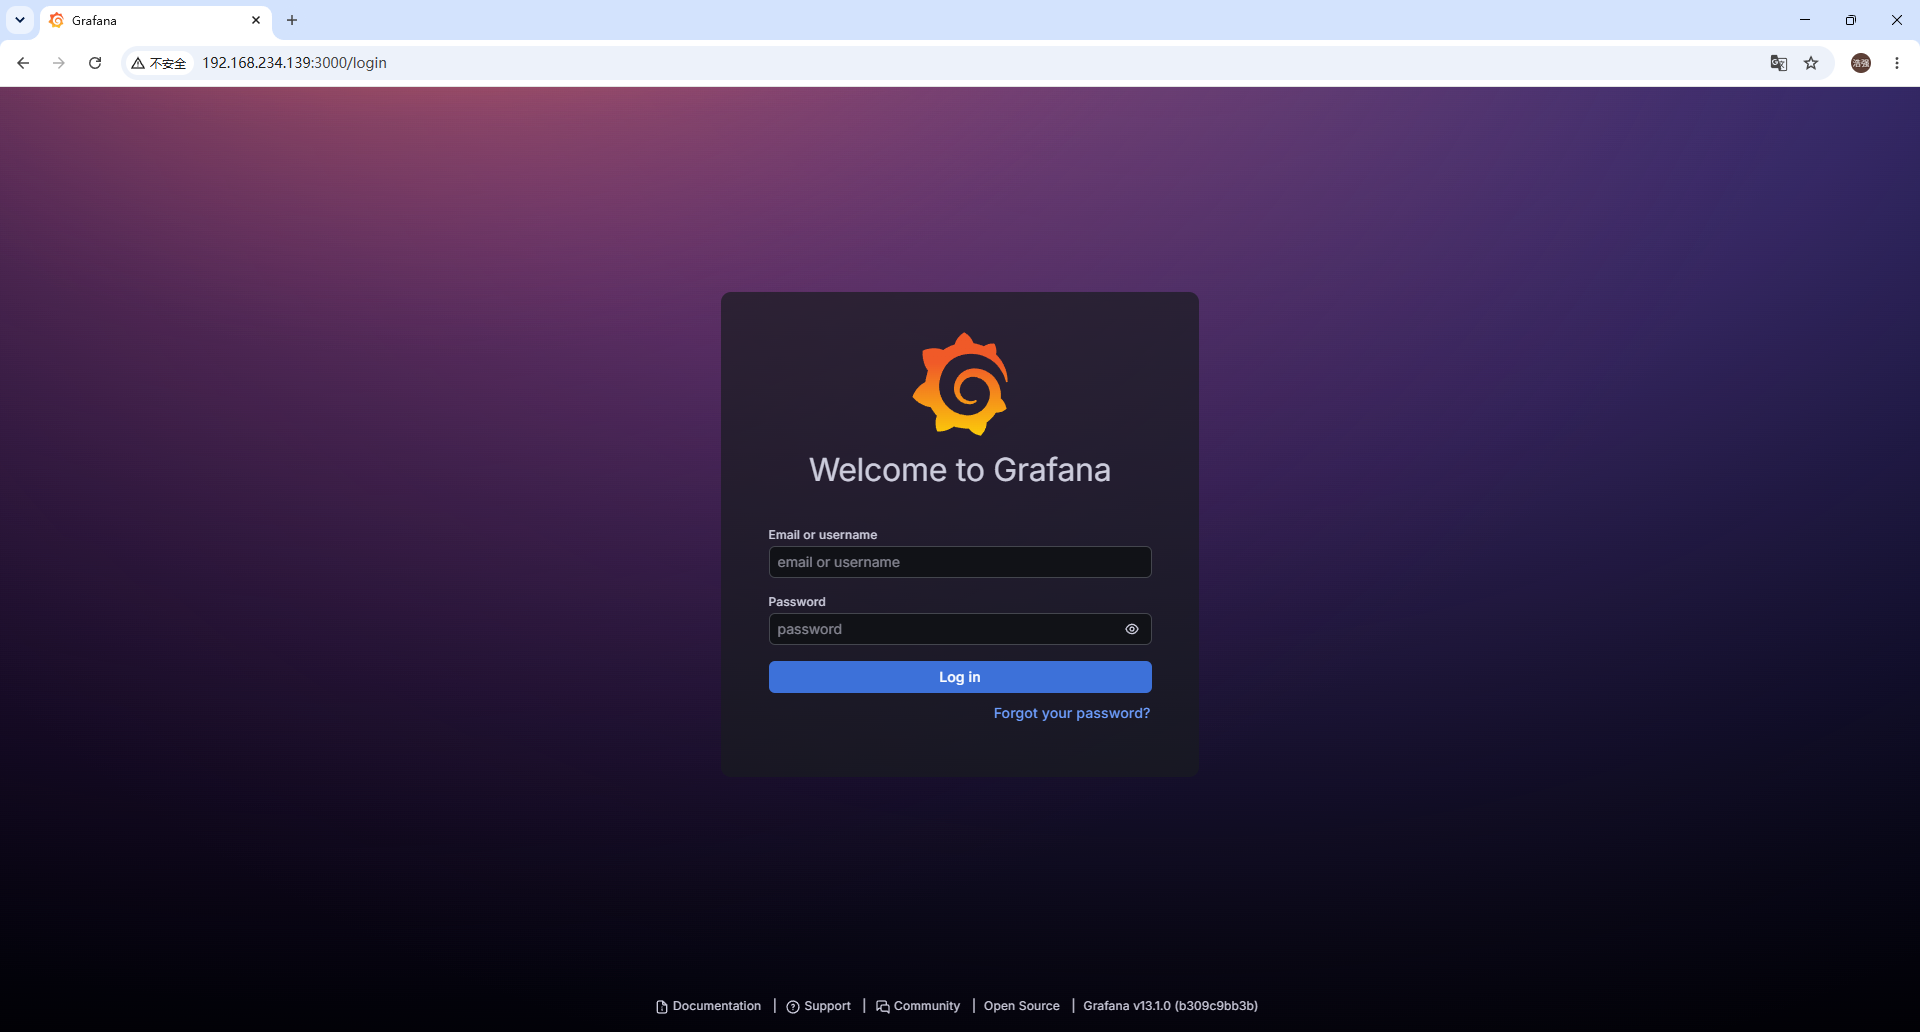
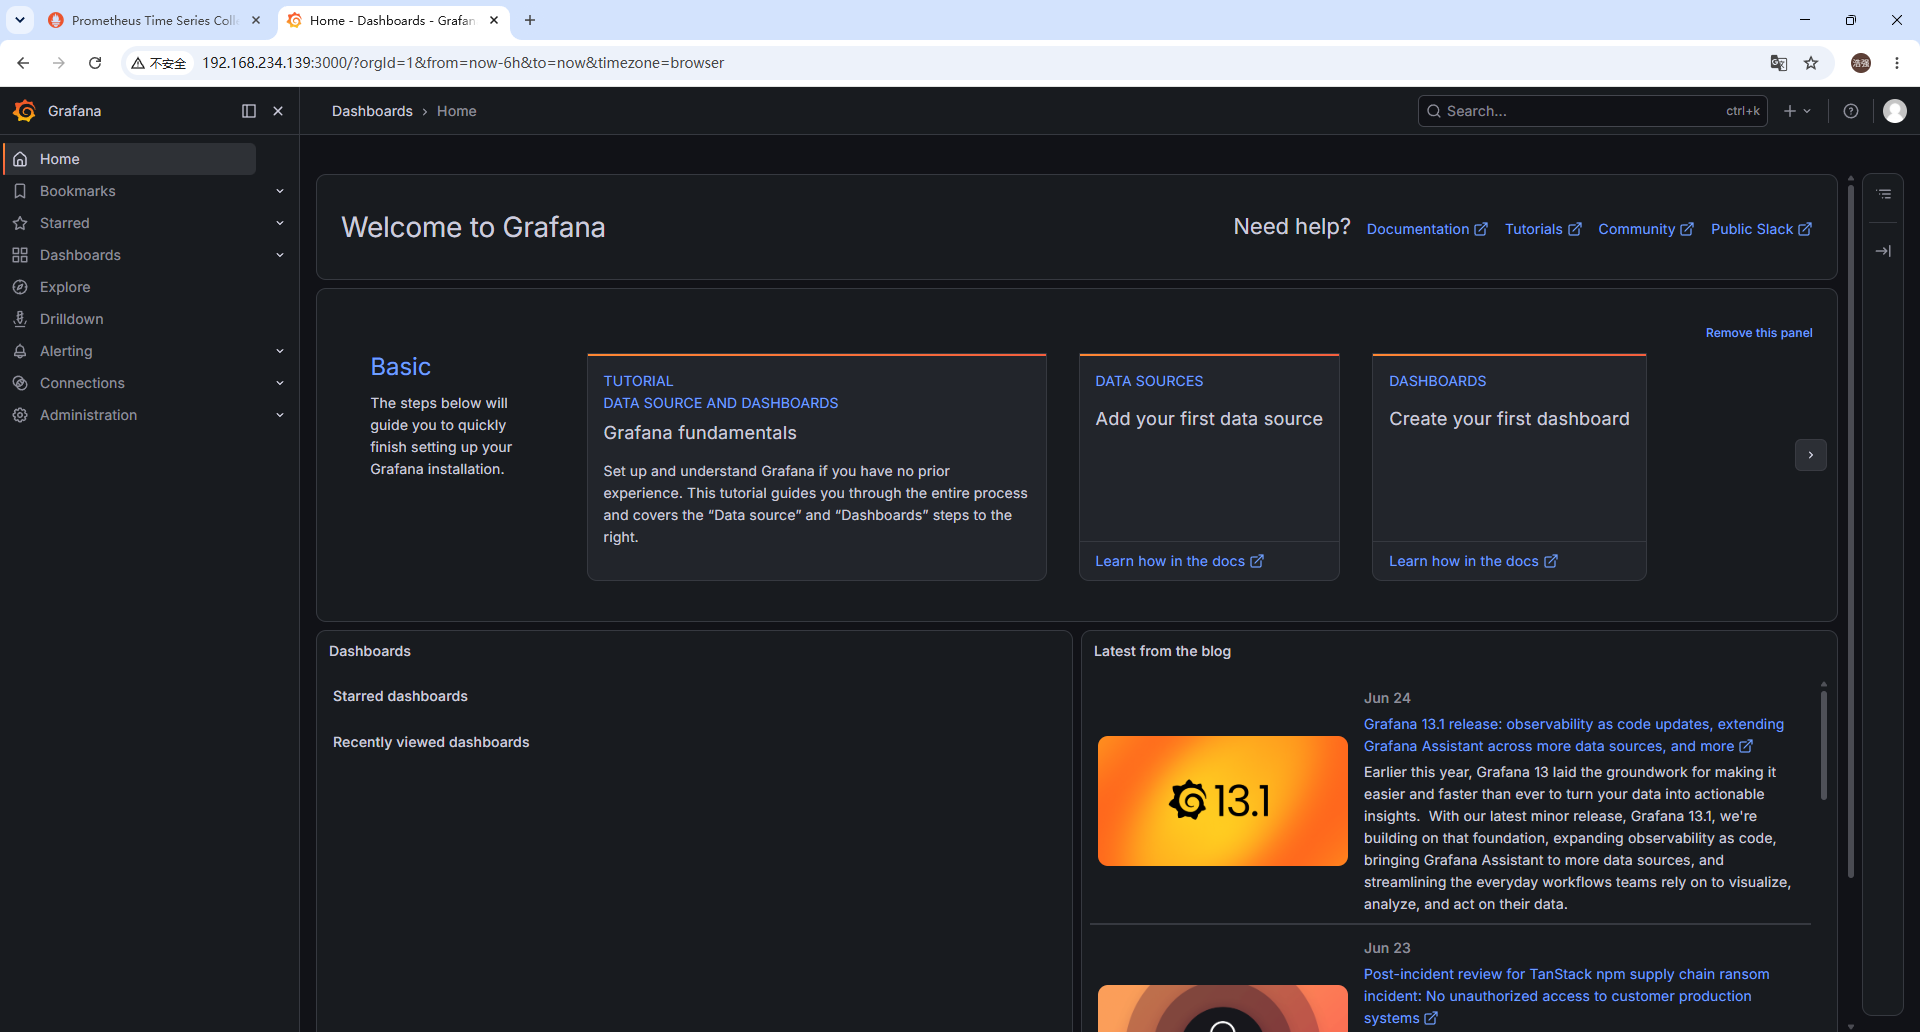
✔ Container grafana Started 7.4s(四)验证 Grafana
打开浏览器,访问:http://<您的虚拟机IP>:3000
验收标准:
- 页面能正常打开。
- 登录时,用户名是 admin,密码是admin。
五、Grafana 配置 Prometheus 数据源
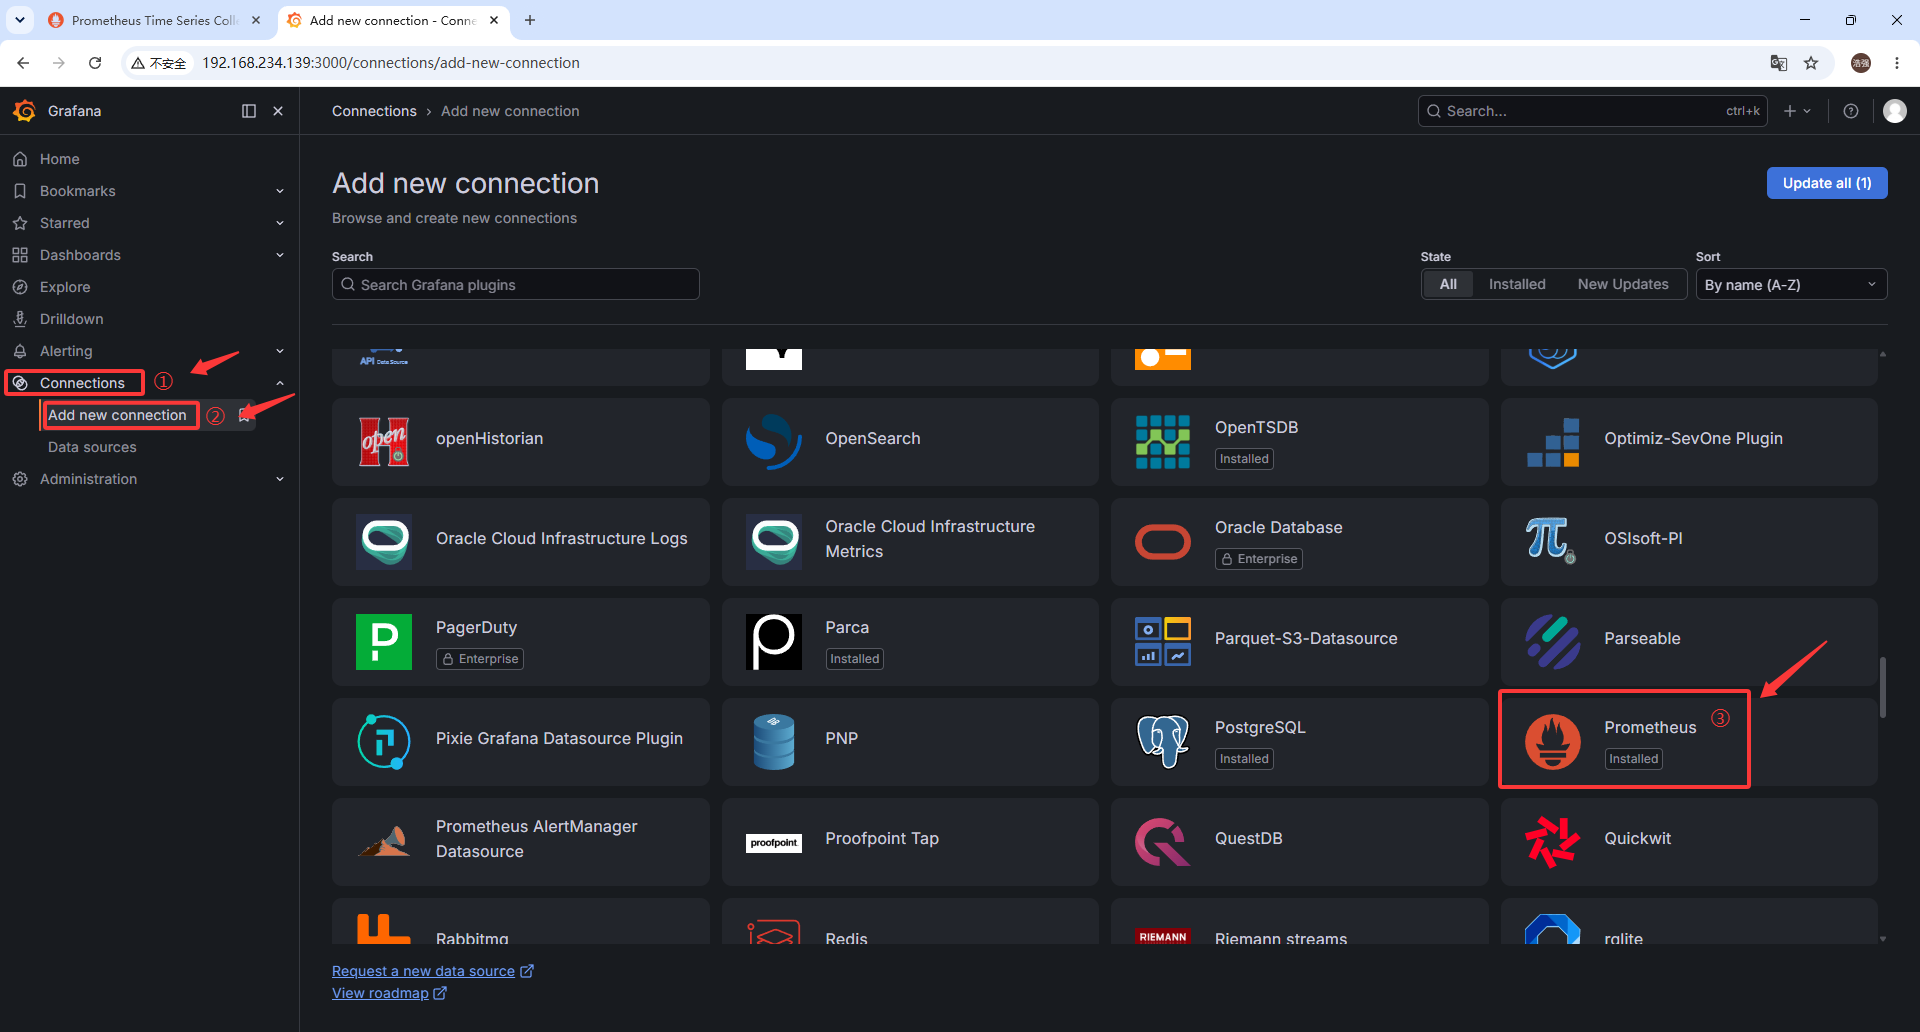
1. 点击 Connections ➡️ Add new conncetion ➡️ Prometheus
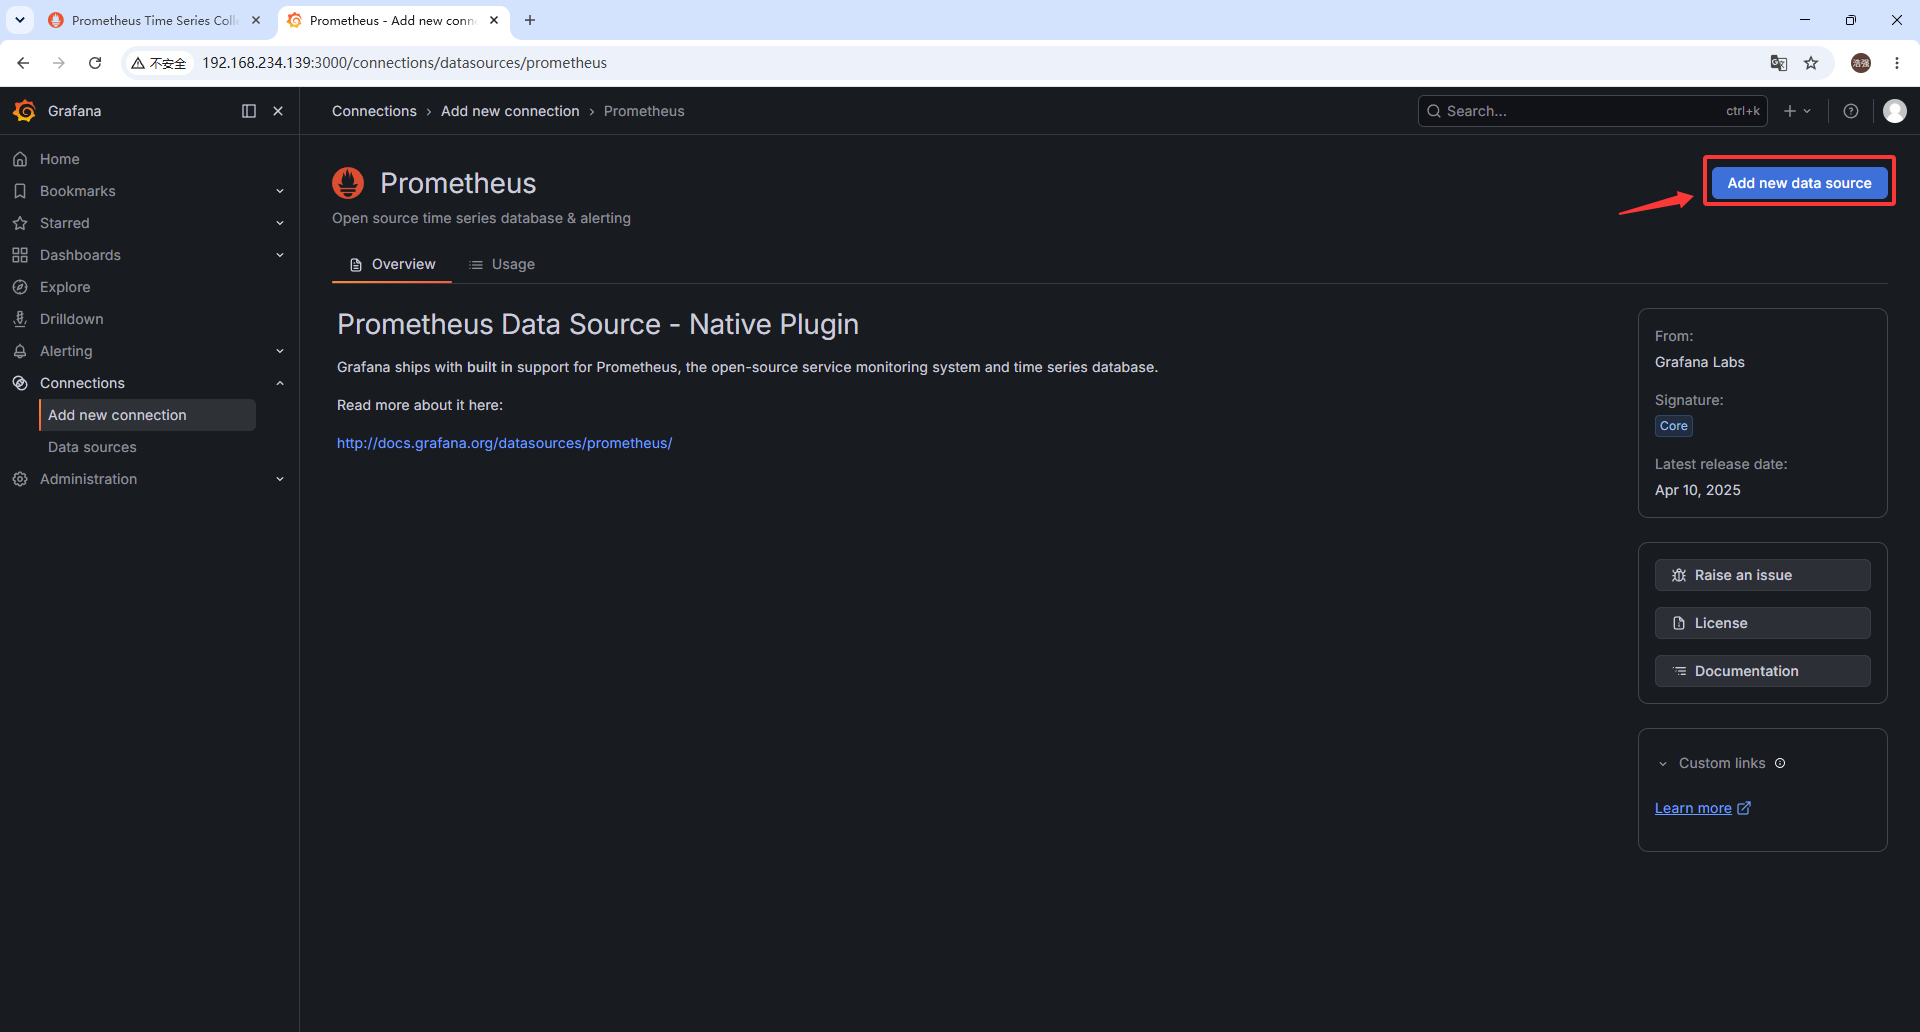
2. 点击 Add new data source
3. 填写相关数据信息
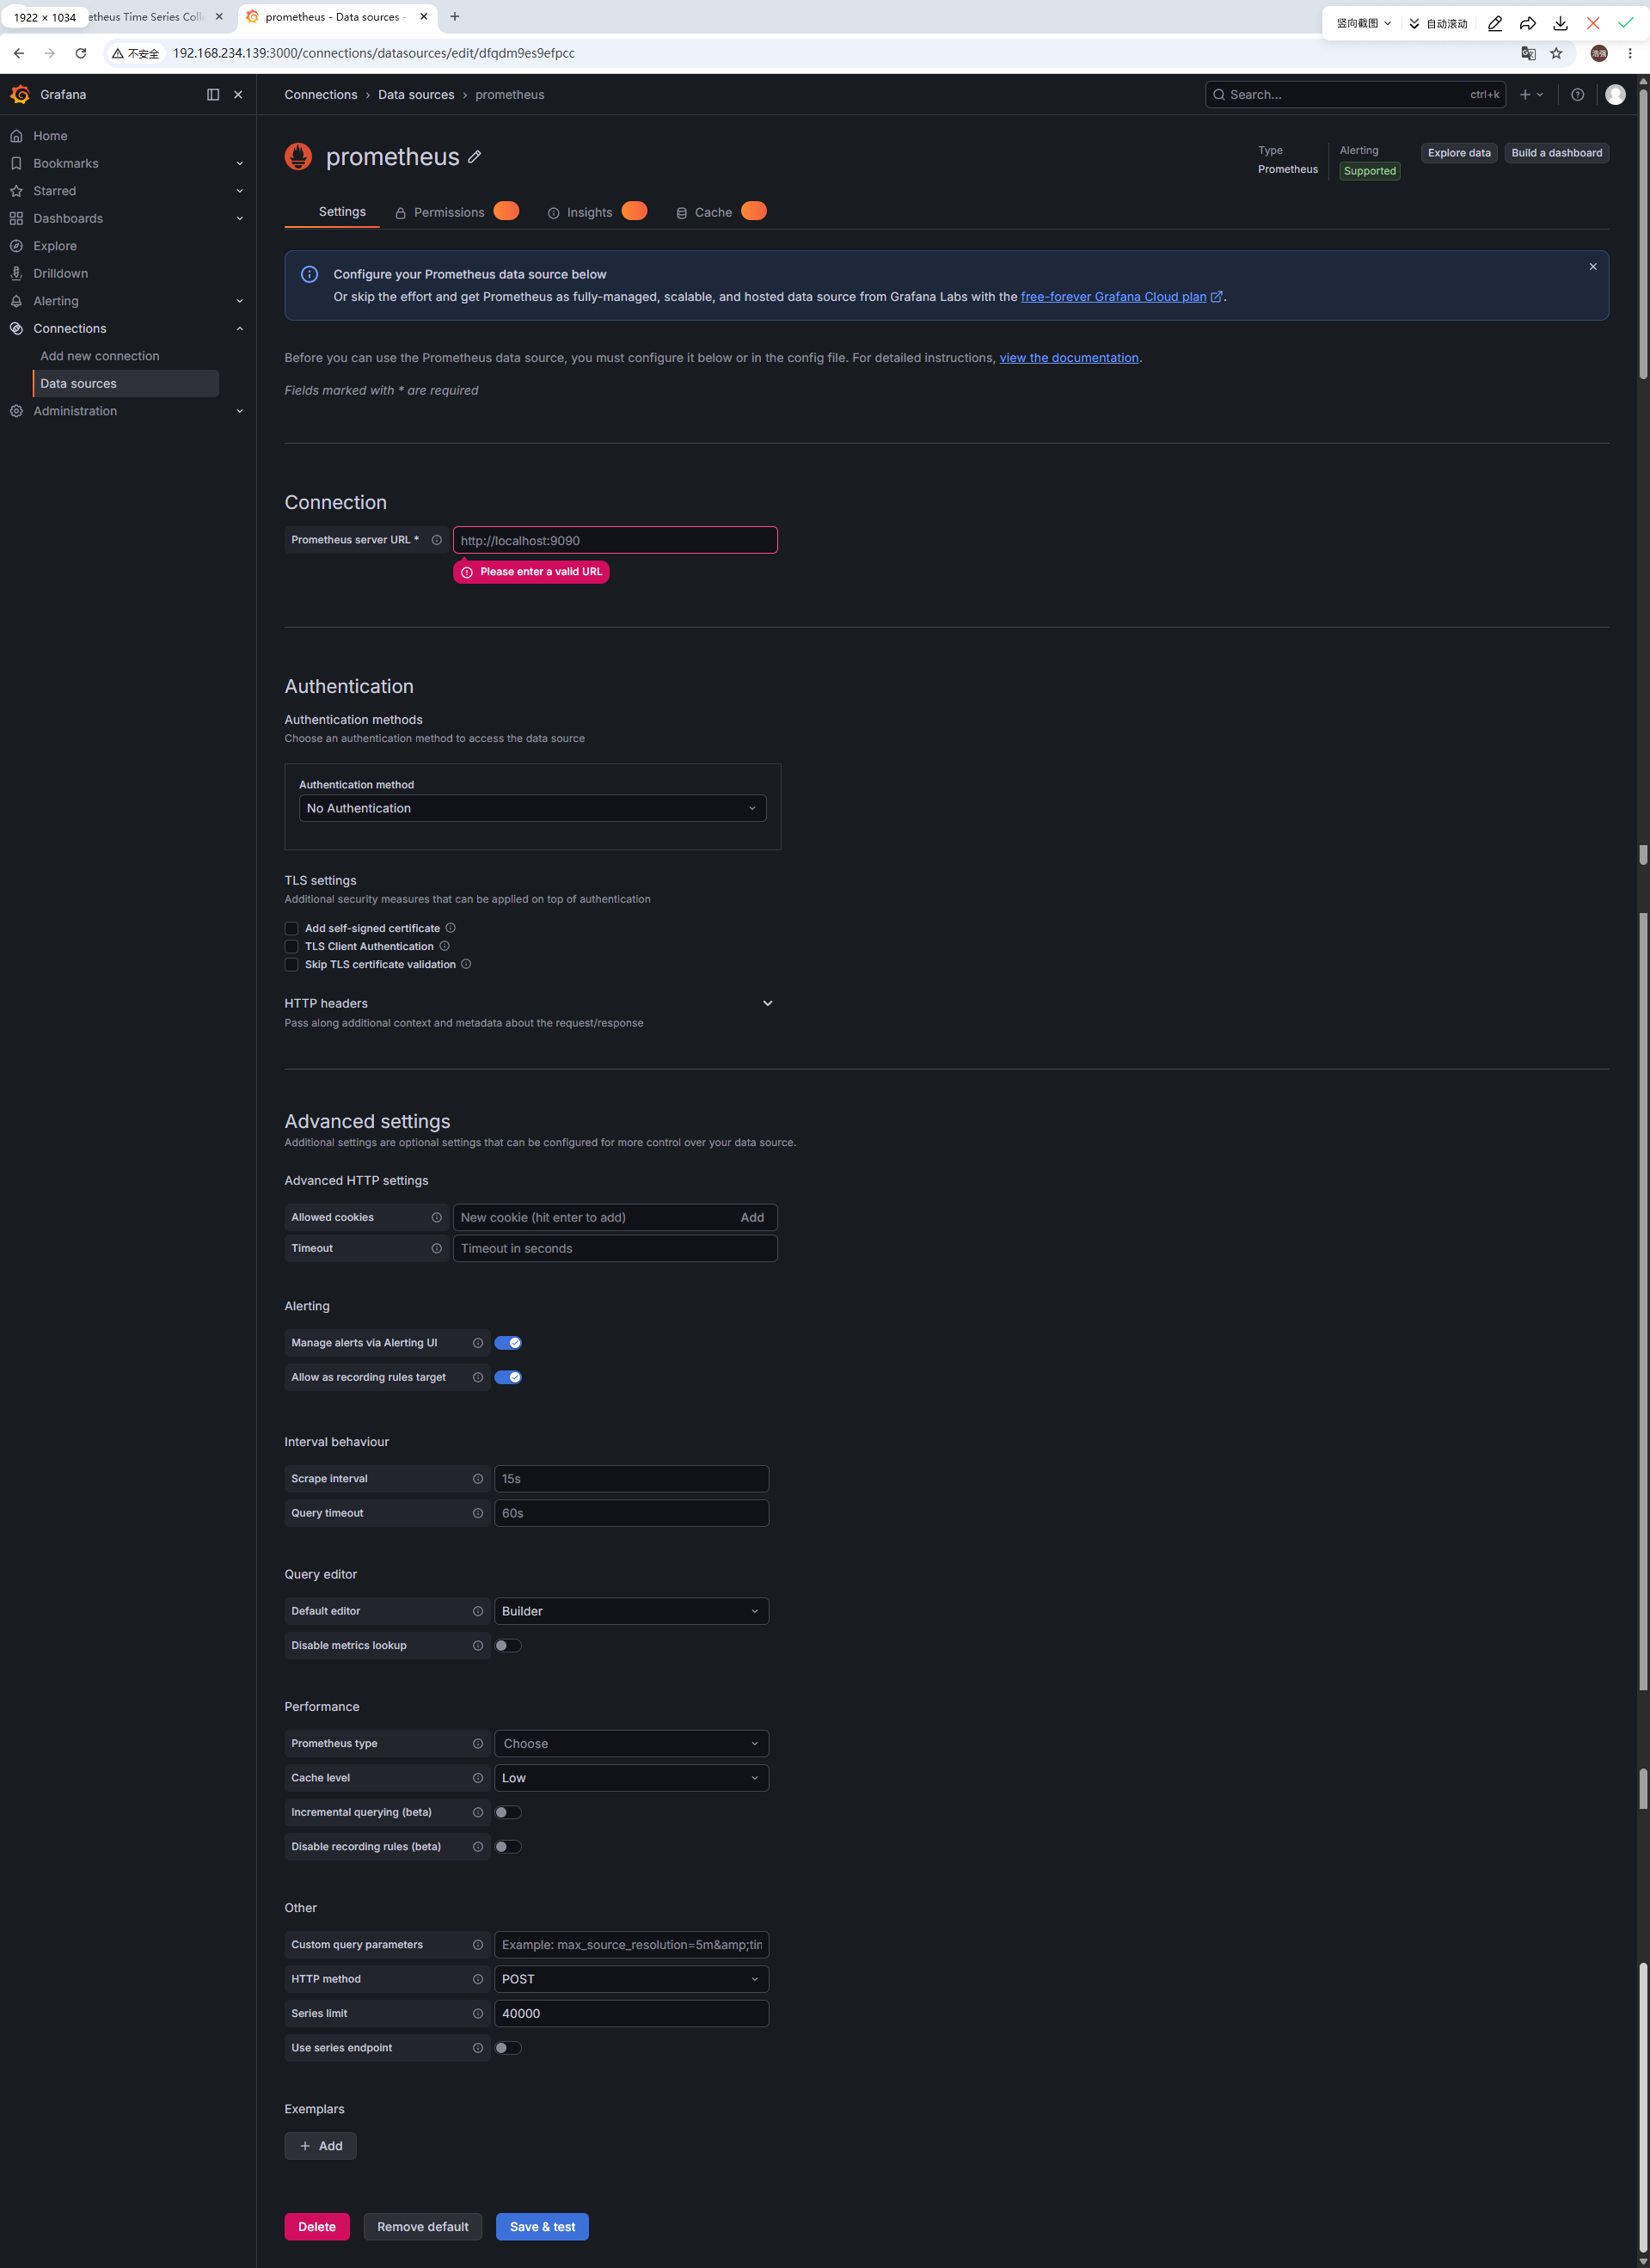
精简配置:
| 配置项 | 当前错误值 | 正确值 | 为什么? |
|---|---|---|---|
| Prometheus server URL | http://localhost:9090 |
http://prometheus:9090 |
✅ Docker Compose 服务名自动解析为容器 IP |
| Authentication method | No Authentication |
保持默认 | ✅ 我们没设置 Prometheus 认证 |
| Scrape interval | 15s |
保持默认 | ✅ 与 Prometheus 配置一致 |
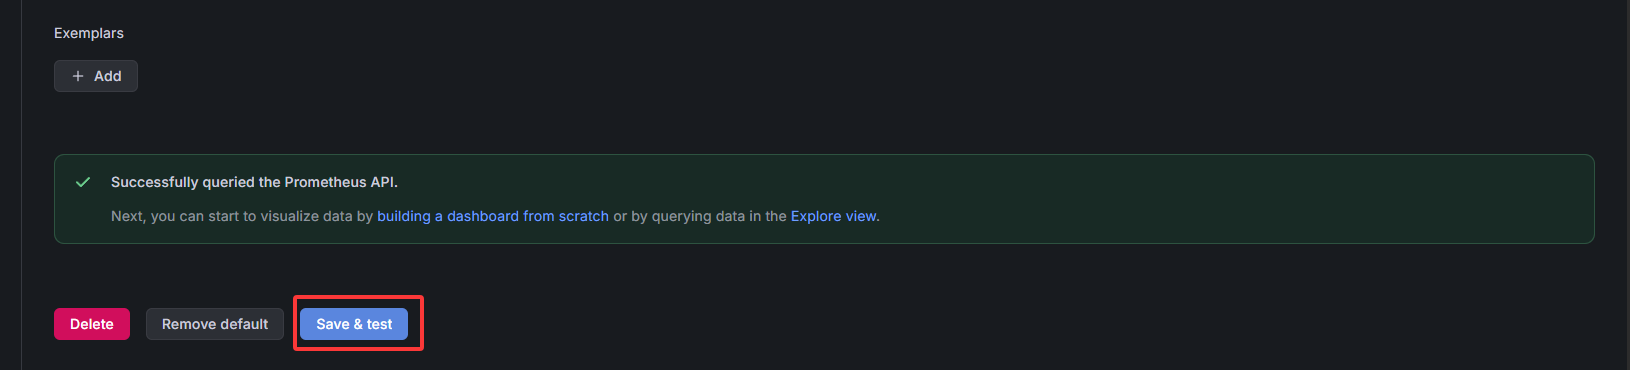
4. 点击 Save & Test
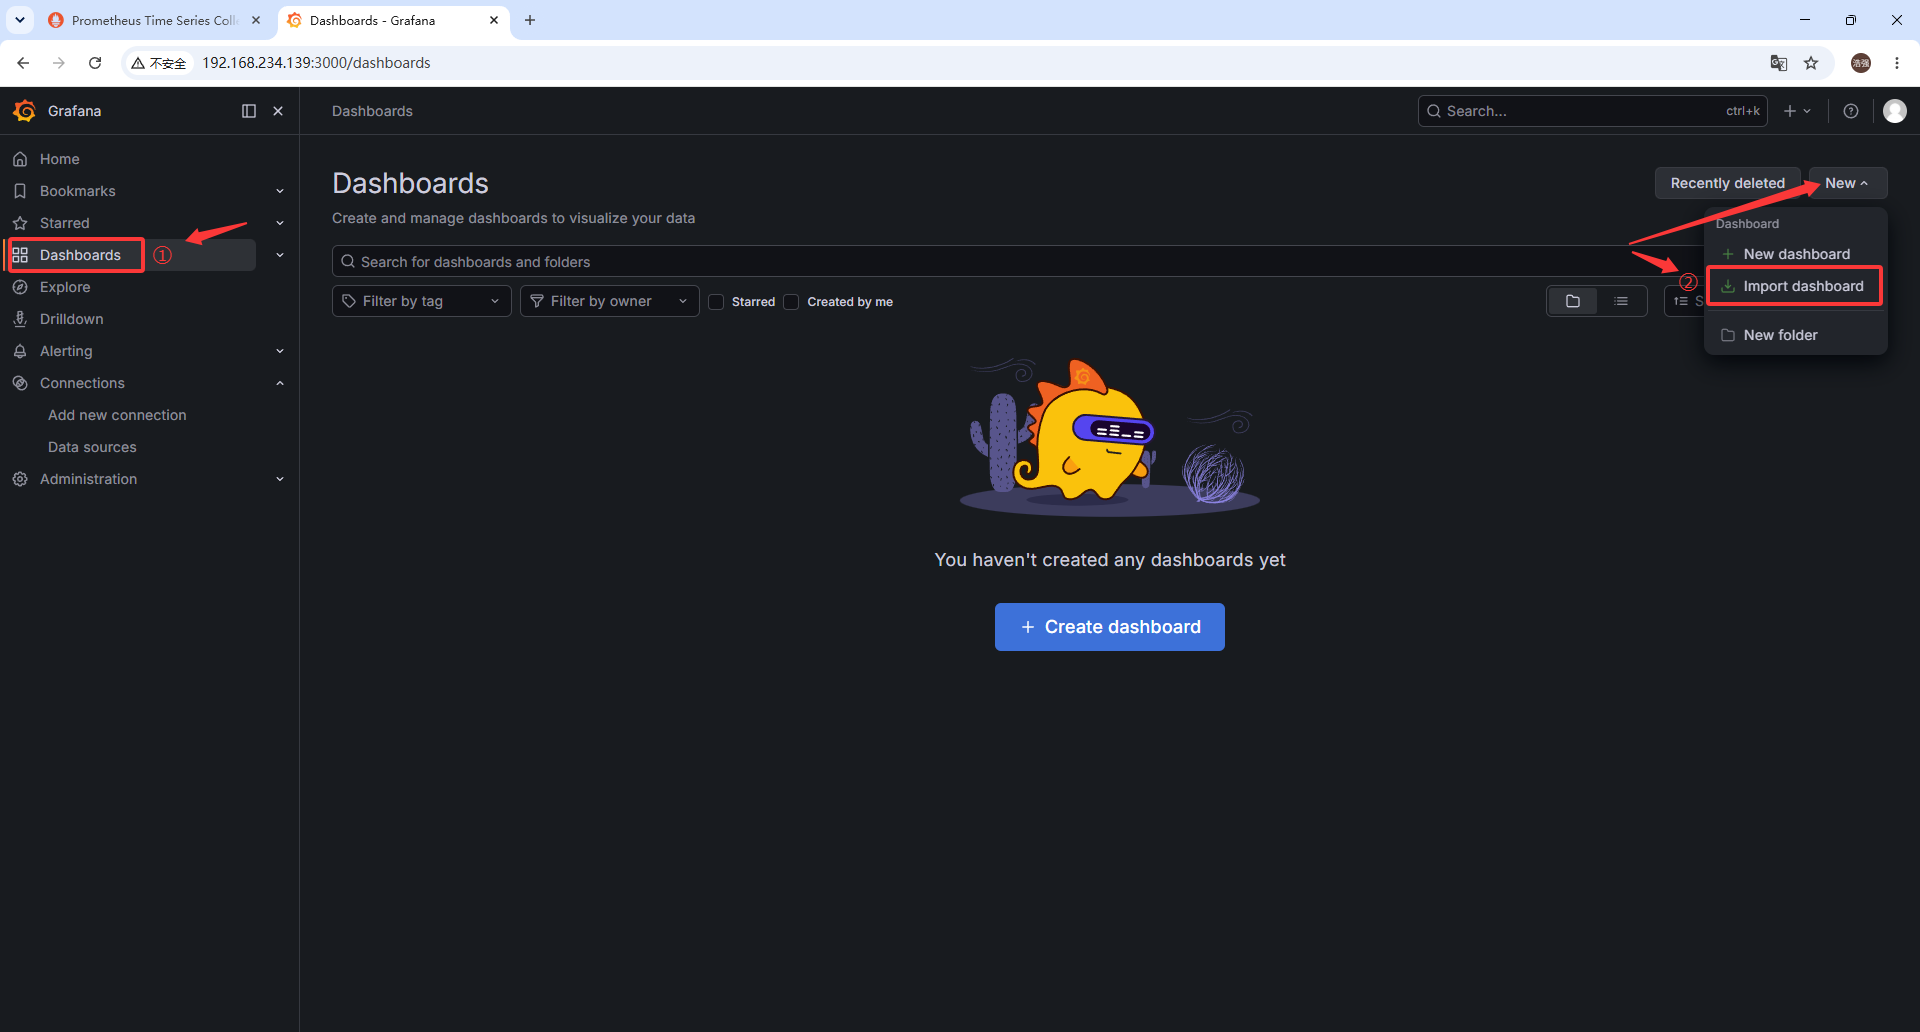
六、Grafana 配置 Dashboards 仪表盘
Grafana dashboards 上有很多可用的仪表盘。在导入界面也有链接可跳转找到心仪的仪表盘。
1. 点击 Dashboards ➡️ New ➡️ Import dashboard
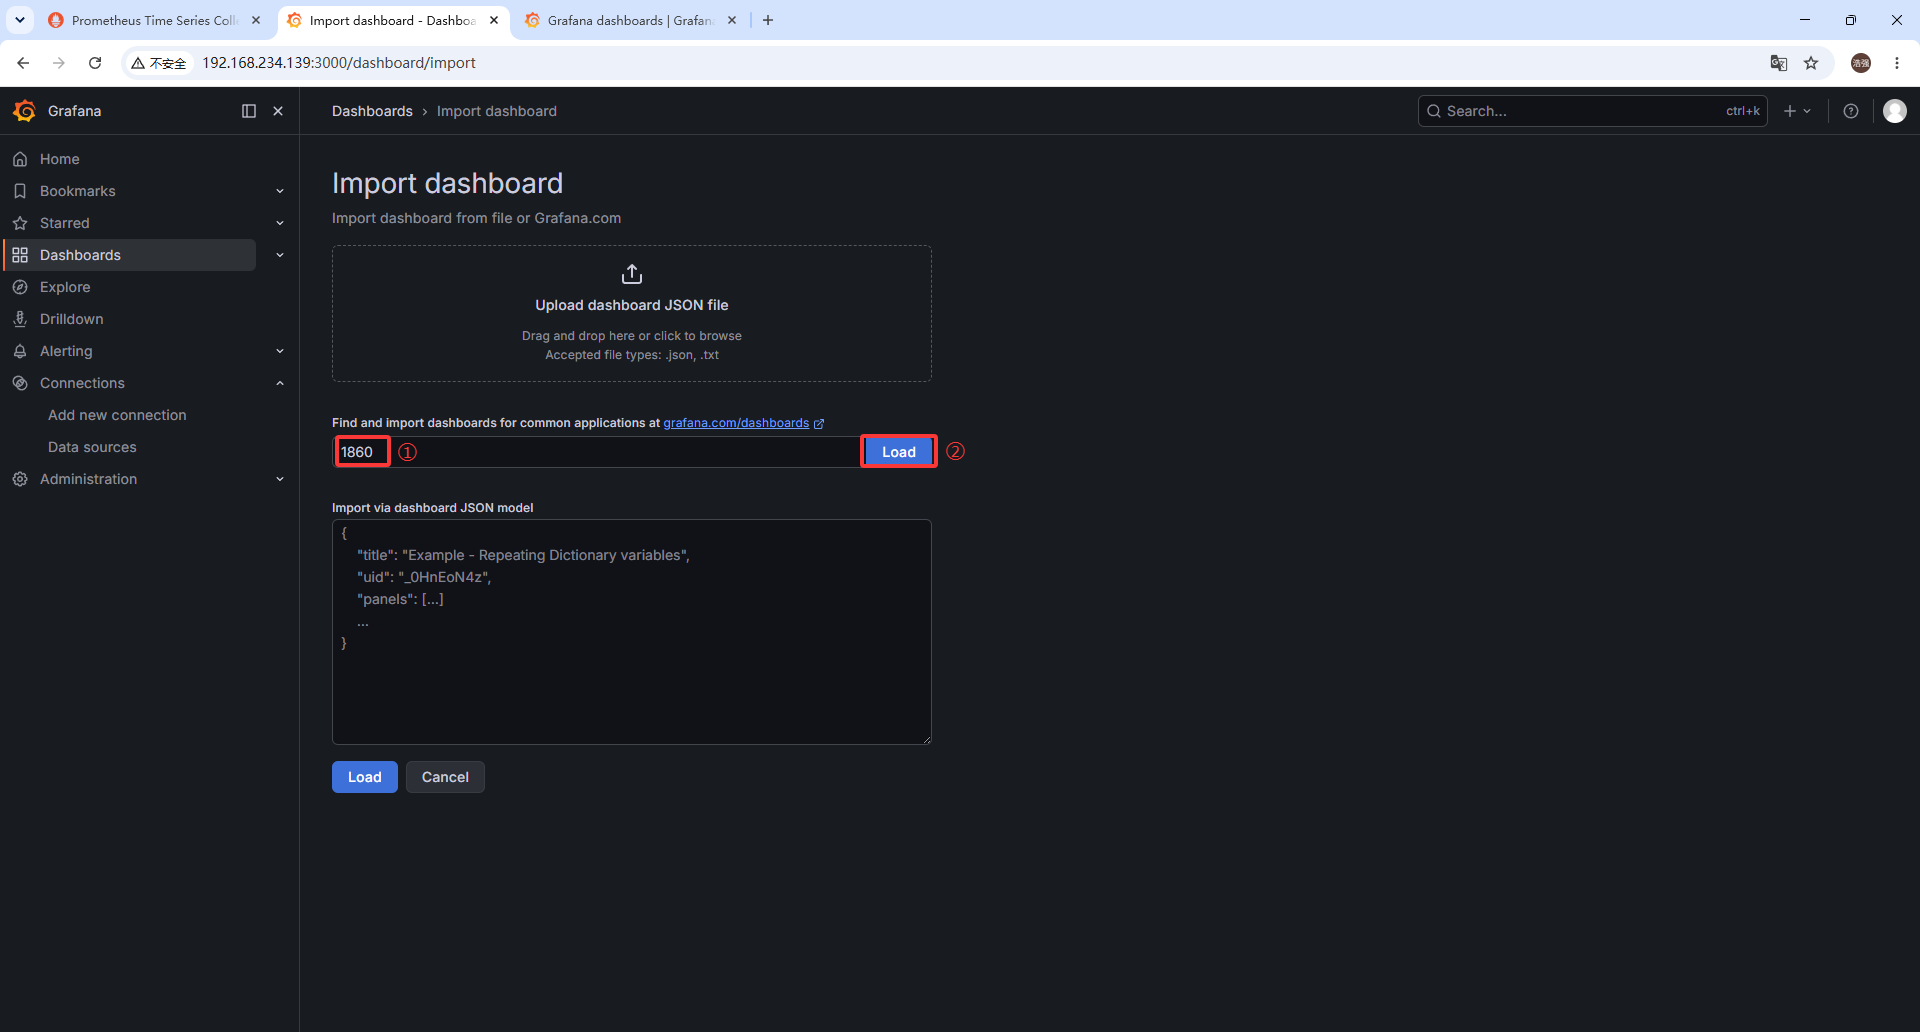
2. 导入 1860 仪表盘
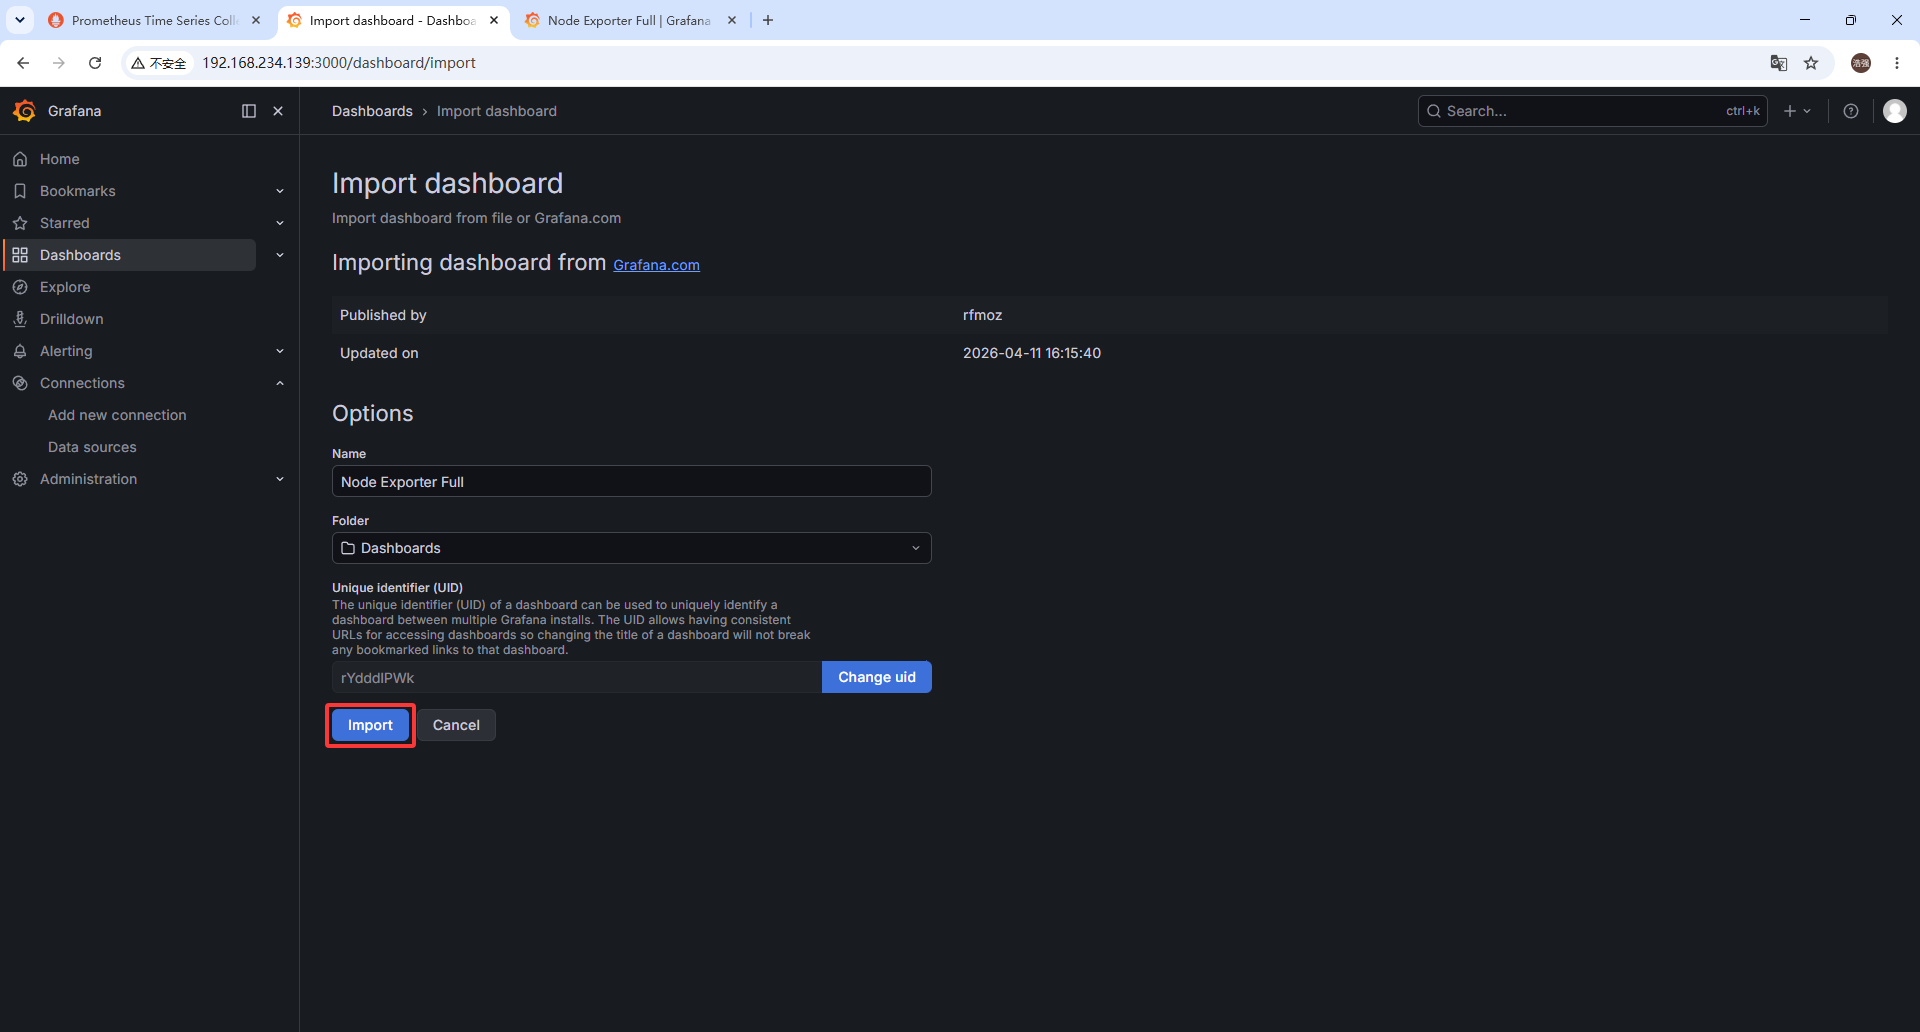
3. 点击 Import
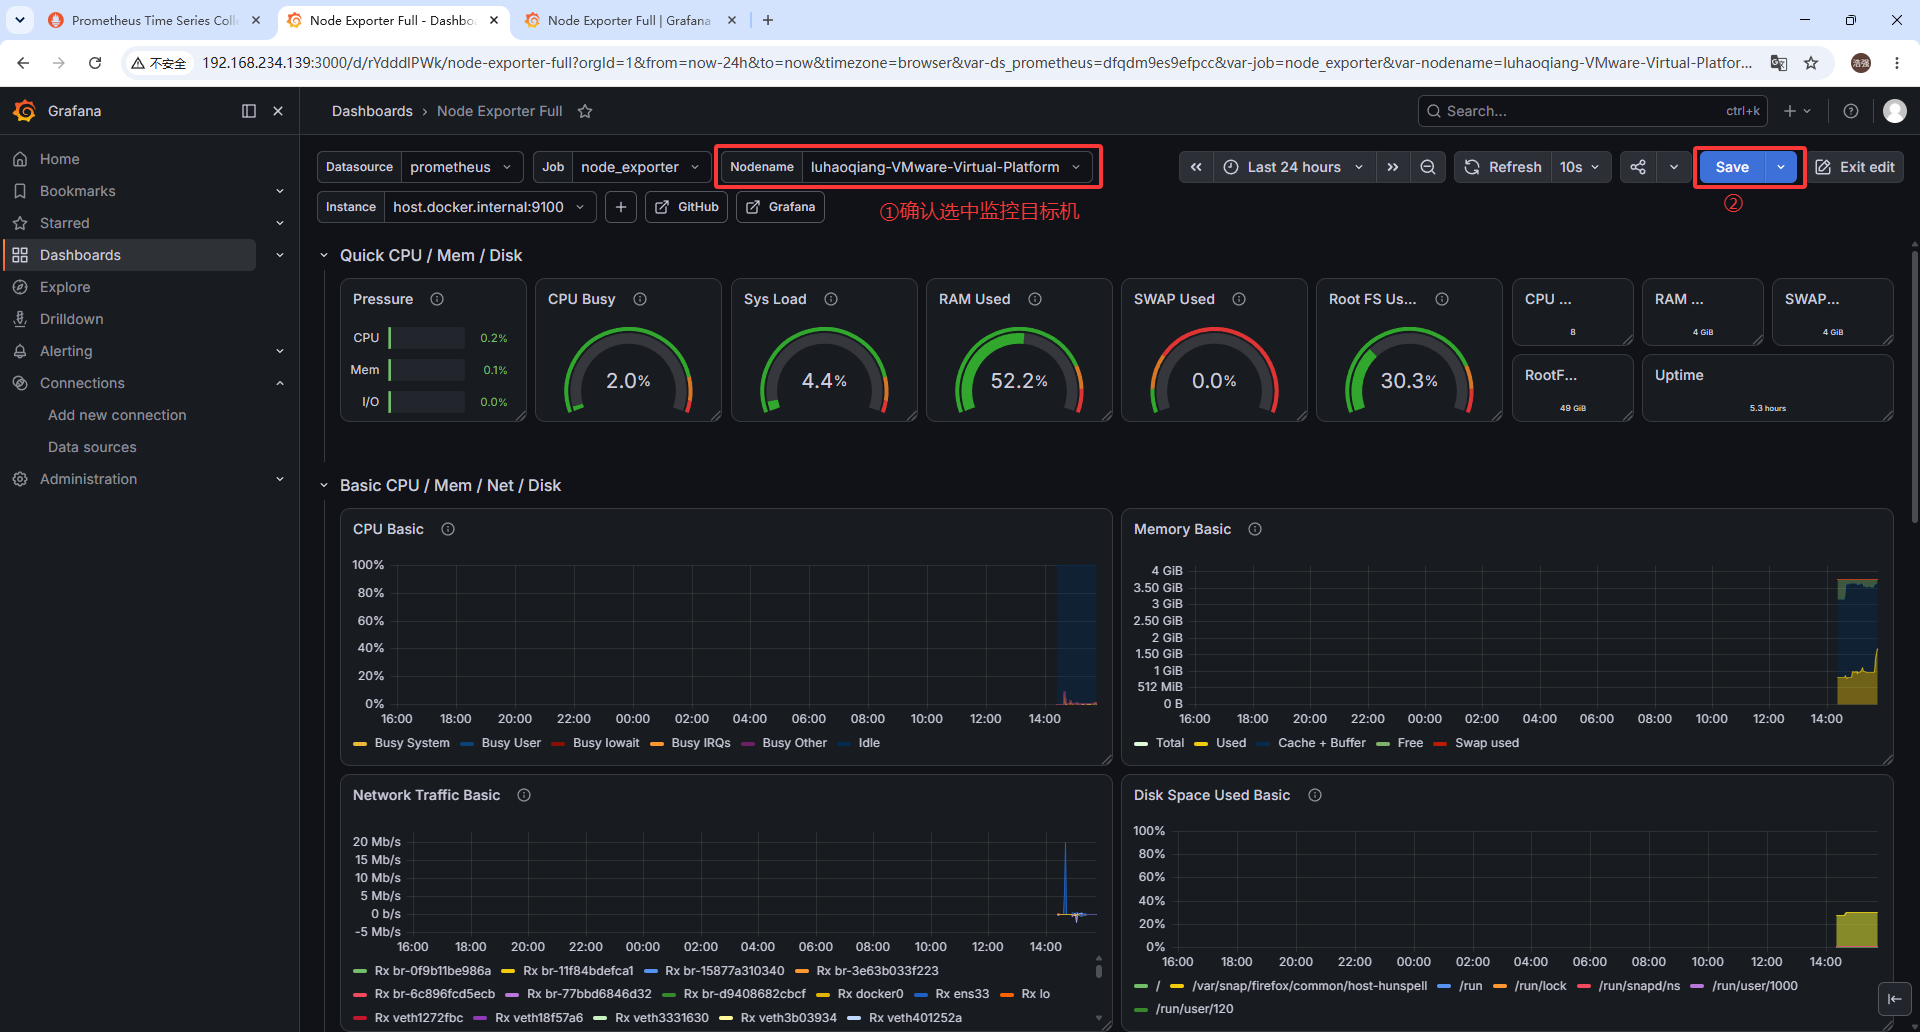
4. 确认并保存(如需 Edit)
如果需要编辑仪表盘,点击 Edit 按钮,进入编辑模式,修改完成后点击 Save 保存。
有关问题
(一)镜像下载网络问题
1. 问题现象
bash
/opt/monitoring$ docker compose up -d
[+] up 1/1
 ✘ Image prom/prometheus:latest Error failed to resolve reference "docker.io/prom/prometheus:latest": failed to do request: Head "https://registry-1.docker.io/v2/prom/prometheus/manifests/latest": dial tcp 108.160.172.232:443: connect: connection refused           21.3s
Error response from daemon: failed to resolve reference "docker.io/prom/prometheus:latest": failed to do request: Head "https://registry-1.docker.io/v2/prom/prometheus/manifests/latest": dial tcp 108.160.172.232:443: connect: connection refused
2. 问题原因
典型的网络问题 !错误信息里的 connection refused 和访问 registry-1.docker.io 失败,表明您的虚拟机当前无法直接连接到 Docker Hub 的官方服务器 (这是国内网络环境的常见限制)。
需要给 Docker 配置一个国内镜像加速器 ,让它从国内的代理节点下载镜像。
或者给 Docker 配置代理软件,让它通过代理下载镜像。
3. 解决方法
这里通过配置代理软件来解决。我的代理软件运行在 Windows 宿主机上
第一步:创建 Docker 的 systemd 代理配置
在终端执行以下命令,直接通过 echo 把配置写入文件
1. 创建存放 Docker 服务覆盖配置的目录
bash
sudo mkdir -p /etc/systemd/system/docker.service.d2. 将代理配置写入文件 (直接使用 Windows IP 和 代理端口)
bash
sudo tee /etc/systemd/system/docker.service.d/http-proxy.conf <<-'EOF'
[Service]
Environment="HTTP_PROXY=http://192.168.1.13:7890"
Environment="HTTPS_PROXY=http://192.168.1.13:7890"
Environment="NO_PROXY=localhost,127.0.0.0/8,192.168.0.0/16,10.0.0.0/8,172.16.0.0/12"
EOF
💡 注意:NO_PROXY 里的 192.168.0.0/16 很重要,它确保了以后 Grafana 容器通过局域网 IP 连接 Prometheus 容器时,不会傻傻地去绕一圈 Windows 代理,而是直接在内网通信。
第二步:重载配置并重启 Docker
bash
sudo systemctl daemon-reload
bash
sudo systemctl restart docker第三步:验证代理是否配置成功
执行以下命令检查 Docker 是否已经吃到了代理环境变量:
bash
sudo systemctl show --property=Environment docker(二)docker & docker compose
Docker 是什么?做什么用的?
Docker 是一个开源的应用容器引擎,它是整个容器化生态的"底座"。
做什么用?
它允许开发者把应用程序以及它运行所需的所有依赖(代码、运行环境、系统工具、数据库驱动等)打包成一个轻量级、可移植的 "镜像(Image)" 。这个镜像可以运行在任何安装了 Docker 的机器上运行,运行起来的实例叫做 "容器(Container)"。
解决的核心痛点
彻底消灭了"这段代码在我的电脑上明明能跑,怎么到你那里就报错了"的环境不一致问题。
Docker Compose 是什么?做什么用的?
Docker Compose 是建立在 Docker 之上的一个多容器编排工具。
做什么用?
在实际开发中,一个完整的项目往往不止一个服务。比如一个典型的Web应用可能包含:前端 Nginx + 后端 Node.js/Java + MySQL 数据库 + Redis 缓存。如果用纯 Docker,需要手动敲4条 docker run 命令,还要手动配置它们之间的网络互通和启动顺序,非常繁琐且容易出错。
解决的核心痛点
它允许你通过一个 YAML 格式的配置文件(通常叫 docker-compose.yml),把整个项目的所有服务、网络、数据卷一次性定义好,然后一键启动/停止整个项目集群。
两者关系
- 依赖关系:Docker Compose 是 Docker 的补充和高级封装。没有 Docker,Docker Compose 就无法工作(Compose 底层调用的依然是 Docker 的 API 来创建和管理容器)。
- 分工明确
- Docker 负责"制造和管理单个集装箱"(构建镜像、运行单个容器)。
- Docker Compose 负责"编排一堆集装箱"(管理多个容器组成的微服务架构)。
核心区别对比
| 对比维度 | Docker | Docker Compose |
|---|---|---|
| 管理对象 | 单个容器 / 镜像 | 多个容器组成的应用服务栈 |
| 配置文件 | Dockerfile(用于定义如何构建单个镜像) |
compose.yaml(用于定义如何编排多个容器) |
| 启动命令 | docker run [一长串参数] [镜像名] |
docker compose up(自动读取配置,一键启动) |
| 网络管理 | 需要手动创建网络、配置容器互联 | 自动为项目创建一个隔离的默认网络,容器间可通过服务名直接互相访问 |
| 依赖与顺序 | 难以控制多个容器的启动先后顺序 | 支持配置 depends_on,确保数据库等基础服务先于应用服务启动 |
| 适用场景 | 运行单一服务(如单纯跑个 MySQL 或 Nginx 测试) | 运行完整的本地开发环境、微服务架构、CI/CD 自动化测试环境 |
补充说明:命令的演进
网上资料,可能会有两种写法: docker-compose 和 docker compose,带横杠 和空格隔开。
- 过去(V1 版本):
docker-compose是一个用 Python 写的独立脚本需要额外单独安装,命令带横杠。目前已被官方废弃。 - 现在(V2 版本):
docker compose是用 Go 语言重写的,已经作为原生插件直接集成到了 Docker CLI 中。只要安装了较新的 Docker,就自带这个命令(中间是空格)。
(三)Node Exporter 监控问题
node exporter 如果使用 docker 镜像安装启动,则 node exporter 的监控对象,取决于启动 Docker 容器时的配置方式。
简答来说:
- 如果直接启动(不做特殊配置):它监控的只是 Docker 容器自身 的信息(这通常毫无意义)。
- 如果做了正确配置:它监控的就是 宿主机 的信息。
为什么默认监控的是 Docker 容器自身?
Node Exporter 采集系统指标(如 CPU、内存、磁盘、网络)的原理,是读取 Linux 系统的虚拟文件系统(主要是 /proc 和 /sys)。
由于 Docker 容器具有 命名空间隔离(Namespace) 特性,容器内部有自己独立的 /proc 和 /sys。如果你只是简单地运行 docker run prom/node-exporter,它读取到的仅仅是这个容器内部的资源使用情况,而不是宿主机的。
如何让 Docker 版 Node Exporter 监控宿主机?
为了让容器内的 Node Exporter 看到宿主机的真实数据,需要在启动时做三件事:
- 挂载宿主机的目录到容器内。
- 共享网络和 PID 命名空间,让容器能看到宿主机的网络接口和进程。
- 通过启动参数告诉 Node Exporter 去读取挂载进来的宿主机路径。
方式一:使用 docker run 命令
bash
docker run -d \
  --name node_exporter \
  --restart=unless-stopped \
  --net="host" \
  --pid="host" \
  -v "/:/host:ro,rslave" \
  -v "/proc:/host/proc:ro" \
  -v "/sys:/host/sys:ro" \
  prom/node-exporter:latest \
  --path.rootfs=/host \
  --path.procfs=/host/proc \
  --path.sysfs=/host/sys
方式二:使用 docker-compose.yml
yaml
version: '3.8'
services:
  node_exporter:
    image: prom/node-exporter:latest
    container_name: node_exporter
    restart: unless-stopped
    network_mode: host
    pid: host
    volumes:
      - /:/host:ro,rslave
      - /proc:/host/proc:ro
      - /sys:/host/sys:ro
    command:
      - '--path.rootfs=/host'
      - '--path.procfs=/host/proc'
      - '--path.sysfs=/host/sys'
关键参数原理解析
| 参数 | 作用解释 |
|---|---|
--net="host" |
共享网络命名空间 。让 Node Exporter 能采集到宿主机真实的网卡信息(如 eth0、bond0)和网络流量,而不是容器虚拟的 eth0。 |
--pid="host" |
共享 PID 命名空间。让 Node Exporter 能看到宿主机上所有的进程信息,从而正确统计系统负载(load average)和进程状态。 |
-v "/proc:/host/proc:ro" |
将宿主机的 /proc(包含 CPU、内存、负载等内核信息)以只读方式挂载到容器的 /host/proc。 |
-v "/sys:/host/sys:ro" |
将宿主机的 /sys(包含硬件设备、内核模块等信息)以只读方式挂载到容器的 /host/sys。 |
-v "/:/host:ro,rslave" |
将宿主机的根目录挂载进去,主要用于采集磁盘/文件系统 的使用情况(如 /dev/sda1 挂载在 / 上的空间使用率)。rslave 确保宿主机后续的挂载事件能传播到容器内。 |
--path.rootfs=/host |
告诉 Node Exporter 程序:"宿主机的根文件系统在 /host 目录下,请去那里读取磁盘信息"。 |