提示:本文原创作品,良心制作,干货为主,简洁清晰,一看就会
文章目录
- 前言
- 一、安装eck
-
- [1.1 安装crds.yaml](#1.1 安装crds.yaml)
- [1.2 安装operator.yaml](#1.2 安装operator.yaml)
- [二、安装es 8.x版本集群](#二、安装es 8.x版本集群)
-
- [2.1 创建es pod](#2.1 创建es pod)
- [2.2 查看基本情况](#2.2 查看基本情况)
- 三、安装kibana
-
- [3.1 创建kibana pod](#3.1 创建kibana pod)
- [3.2 查看基本情况](#3.2 查看基本情况)
- 四、安装kafka
-
- [4.1 安装kafka pod](#4.1 安装kafka pod)
- [4.2 查看基本情况](#4.2 查看基本情况)
- 五、安装logstash
-
- [5.1 创建logstash pod](#5.1 创建logstash pod)
- [5.2 查看基本情况](#5.2 查看基本情况)
- 六、安装filebeat
-
- [6.1 创建filebeat pod](#6.1 创建filebeat pod)
- [6.2 创建filebeat cm](#6.2 创建filebeat cm)
- [6.3 创建filebeat rbac](#6.3 创建filebeat rbac)
- [6.4 查看基本情况](#6.4 查看基本情况)
- 七、验证信息
-
- [7.1 filebeat验证](#7.1 filebeat验证)
- [7.2 kafka验证](#7.2 kafka验证)
- [7.3 es验证](#7.3 es验证)
- 八、查看日志
前言
在Kubernetes集群中,应用的日志分散在各个Pod和节点上,查看和排查问题非常不便。为了集中管理这些日志,我们基于ECK部署了一套完整的日志收集系统,涵盖ES、Kibana、Kafka、Logstash、Filebeat等组件,实现日志从采集、传输、缓冲到存储和可视化的全链路处理
我的实验环境
| 主机 | ip地址 | 配置 | 作用 |
|---|---|---|---|
| k8s-master | 192.168.13.136 | 内存7G,cpu4核 | k8s集群控制节点 |
| k8s-node1 | 192.168.13.137 | 内存9G,cpu4核 | k8s工作节点 |
| k8s-node2 | 192.168.13.138 | 内存9G,cpu4核 | k8s工作节点 |
| nfs-client | 192.168.13.141 | 内存2G,cpu2核 | NFS存储服务节点,为K8s集群提供共享持久化存储 |
本文档记录了在 Kubernetes 集群中,基于ECK部署日志收集平台的全过程。系统采用 Filebeat 采集容器日志,Kafka(KRaft 模式)作为消息缓冲层,Logstash 进行日志解析与传输,Elasticsearch 存储日志数据,Kibana 提供可视化查询界面。文档详细说明了各组件的安装配置、参数调优及验证方法,旨在为运维人员提供一套可复用的云原生日志解决方案
一、安装eck
ECK 是 Elastic 官方推出的 K8s 云原生运维控制器,依托 CRD 自定义资源,可一键部署、运维 Elasticsearch、Kibana、APM 等组件,实现集群扩缩容、版本升级、备份恢复、权限统一管控,省去手动编写大量 K8s 原生资源配置的繁琐工作
本容器日志采集架构以 ECK 为日志平台运维底座,统一管理组件全生命周期,支持安全认证、存储挂载、资源配额、滚动更新等高可用能力。部署 ECK 控制器后,只需在指定命名空间通过声明式配置创建 ES 集群,即可自动完成节点调度、服务暴露、证书签发,大幅简化 K8s 环境下 ELK 栈部署与运维成本,保障日志存储、检索服务稳定高效运行
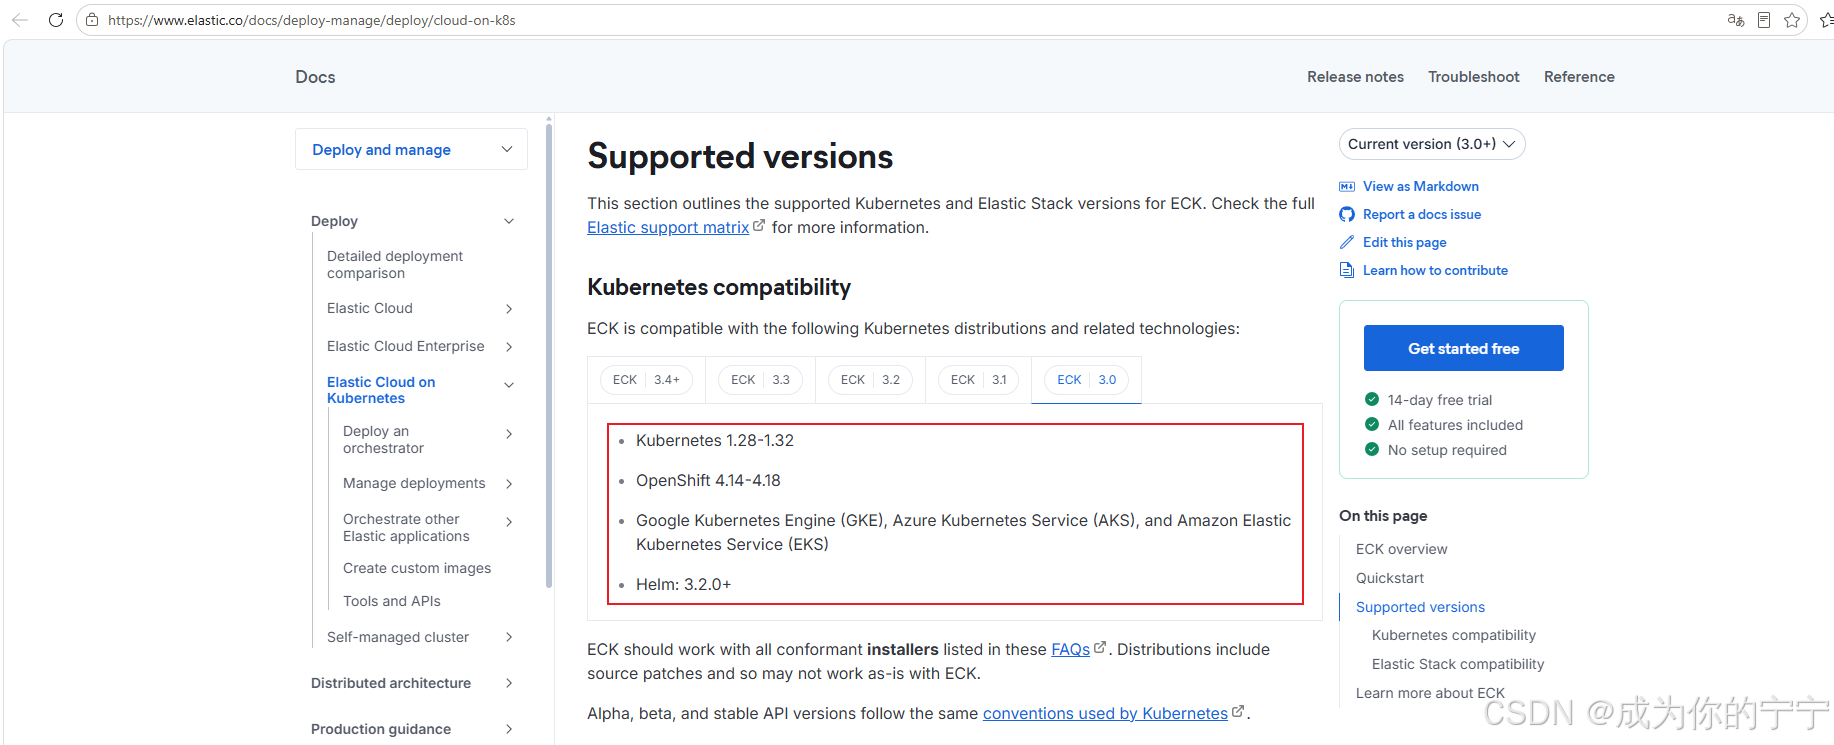
eck和k8s版本依赖:https://www.elastic.co/docs/deploy-manage/deploy/cloud-on-k8s
我K8s是1.28的,所以我这里安装3.0的eck即可
1.1 安装crds.yaml
作用:注册 Elastic 自定义资源(CRD)到 Kubernetes 集群
- 在K8s中注册
Elasticsearch、Kibana、ApmServer等自定义资源类型 - 只有先安装CRD,后续才能通过
kind: Elasticsearch这种自定义yaml来创建ES集群、Kibana实例 - 相当于告诉K8s:ECK要新增几种资源对象,让集群能识别ECK专属的资源声明
yaml
root@k8s-master1:~# mkdir /k8s/log/
root@k8s-master1:~# cd /k8s/log/
root@k8s-master1:/k8s/log# wget https://download.elastic.co/downloads/eck/3.0.0/crds.yaml
root@k8s-master1:/k8s/log# vim crds.yaml
root@k8s-master1:/k8s/log# kubectl apply -f crds.yaml
1.2 安装operator.yaml
作用:部署ECK核心控制器,也就是运维ES/Kibana的管理程序
- 在集群中创建ECK Operator Deployment、ServiceAccount、RBAC权限、配置等资源
- 控制器会持续监听集群内ES、Kibana等自定义资源的变化
- 自动完成节点调度、证书生成、服务创建、PV挂载、滚动升级、扩缩容、安全账号管理等运维操作
yaml
root@k8s-master1:/k8s/log# wget https://download.elastic.co/downloads/eck/3.0.0/operator.yaml
root@k8s-master1:/k8s/log# vim operator.yaml
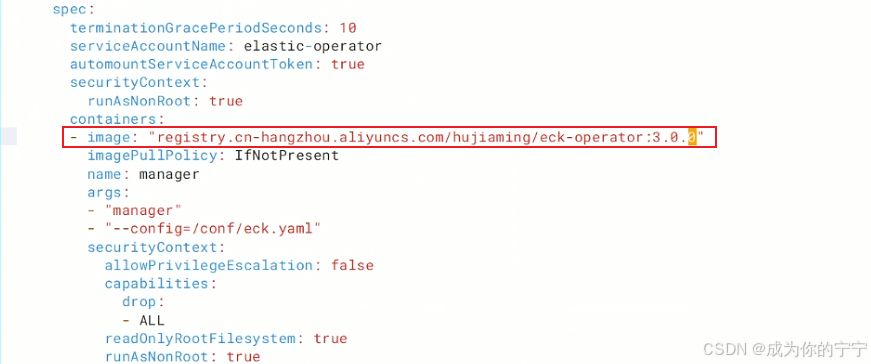
这里可以修改一下镜像地址
yaml
root@k8s-master1:/k8s/log# kubectl apply -f operator.yaml
root@k8s-master1:/k8s/log# kubectl get pod -n elastic-system
NAME                 READY   STATUS    RESTARTS   AGE
elastic-operator-0   1/1     Running   0          87s

## 查看eck crd资源
root@k8s-master1:/k8s/log# kubectl get crd | grep elastic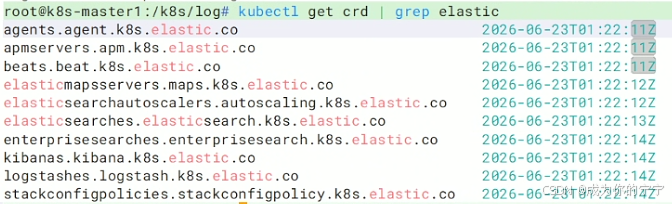
二、安装es 8.x版本集群
Elasticsearch 8.x 是整套日志系统的核心存储与检索引擎,负责接收 Logstash 预处理后的容器原始日志,完成日志数据的分片存储、全文索引构建、多维度条件检索、聚合统计分析
2.1 创建es pod
yaml
## 创建eck-cloud命名空间,组件都放这里面
root@k8s-master1:/k8s/log# kubectl create ns eck-cloud
yaml
## 主数据节点分离架构:3 台 Master 管理节点 + 2 台 Data 数据节点,实现 ES 集群高可用
## Master 负责集群选主、元数据管理,Data 负责日志数据存储与检索
root@k8s-master1:/k8s/log# vim es-cluster.yaml
---
apiVersion: elasticsearch.k8s.elastic.co/v1
kind: Elasticsearch
metadata:
  name: eck-ha-cluster
spec:
  version: 8.17.5
  image: registry.cn-hangzhou.aliyuncs.com/hujiaming/elasticsearch:8.17.5
  nodeSets:
  # 第一组:master主节点组
  - name: master-nodes
    # master节点副本数3,高可用
    count: 3
    config:
      node.roles: ["master"]
    volumeClaimTemplates:
    - metadata:
        name: elasticsearch-data
      spec:
        accessModes:
        - ReadWriteOnce
        # 存储资源申请
        resources:
          requests:
            storage: 5Gi
        # sc名称
        storageClassName: nfs-client
    # pod调度、权限、初始化配置
    podTemplate:
      spec:
        # 添加容忍度,允许调度到控制平面节点,我这里资源不足所以这样设置
        tolerations:
        - key: "node-role.kubernetes.io/control-plane"
          operator: "Exists"
          effect: "NoSchedule"
        # 初始化容器
        initContainers:
        - name: sysctl
          securityContext:
            privileged: true
            runAsUser: 0
          # es运行必备内核参数
          command: ['sh', '-c', 'sysctl -w vm.max_map_count=262144']
          # 初始化容器资源配额
          resources:
            requests:
              # 最小申请0.5核cpu,512m内存
              cpu: 500m
              memory: 512Mi
            limits:
              # 最大限制1核cpu,1g内存
              cpu: 1000m
              memory: 1Gi
        # es业务容器配置
        containers:
        - name: elasticsearch
          readinessProbe:
            exec:
              command:
              - bash
              - -c
              - /mnt/elastic-internal/scripts/readiness-probe-script.sh
            failureThreshold: 3
            initialDelaySeconds: 10
            periodSeconds: 12
            successThreshold: 1
            timeoutSeconds: 12
          resources:
            requests:
              cpu: 1000m
              memory: 1Gi
            limits:
              cpu: 2000m
              memory: 2Gi
          env:
          - name: READINESS_PROBE_TIMEOUT
            value: "10"
        affinity:
          podAntiAffinity:
            preferredDuringSchedulingIgnoredDuringExecution:
            - weight: 100
              podAffinityTerm:
                labelSelector:
                  matchLabels:
                    elasticsearch.k8s.elastic.co/cluster-name: eck-ha-cluster
                topologyKey: eck-cluster
  # 第二组:data数据节点组
  - name: data-nodes
    # 资源不够,我设置的2
    count: 2
    # 作为数据节点,负责日志数据存储,检索
    config:
      node.roles: ["data"]
    volumeClaimTemplates:
    - metadata:
        name: elasticsearch-data
      spec:
        accessModes:
        - ReadWriteOnce
        resources:
          requests:
            storage: 4Gi
        storageClassName: nfs-client
    podTemplate:
      spec:
        # 数据节点也可添加容忍度(可选)
        tolerations:
        - key: "node-role.kubernetes.io/control-plane"
          operator: "Exists"
          effect: "NoSchedule"
        initContainers:
        - name: sysctl
          securityContext:
            privileged: true
            runAsUser: 0
          command: ['sh', '-c', 'sysctl -w vm.max_map_count=262144']
          resources:
            requests:
              cpu: 500m
              memory: 512Mi
            limits:
              cpu: 1000m
              memory: 1Gi
        containers:
        - name: elasticsearch
          readinessProbe:
            exec:
              command:
              - bash
              - -c
              - /mnt/elastic-internal/scripts/readiness-probe-script.sh
            failureThreshold: 3
            initialDelaySeconds: 10
            periodSeconds: 12
            successThreshold: 1
            timeoutSeconds: 12
          resources:
            requests:
              cpu: 1000m
              memory: 1Gi
            limits:
              cpu: 2000m
              memory: 2Gi
          env:
          - name: READINESS_PROBE_TIMEOUT
            value: "10"
        # 数据节点同样配置Pod反亲和策略,打散部署规避单点故障
        affinity:
          podAntiAffinity:
            preferredDuringSchedulingIgnoredDuringExecution:
            - weight: 100
              podAffinityTerm:
                labelSelector:
                  matchLabels:
                    elasticsearch.k8s.elastic.co/cluster-name: eck-ha-cluster
                topologyKey: eck-cluster
2.2 查看基本情况
yaml
## 1. 创建yaml
root@k8s-master1:/k8s/log# kubectl apply -f es-cluster.yaml -n eck-cloud
yaml
## 2. 查看pod,svc
root@k8s-master1:/k8s/log# kubectl get es -n eck-cloud
NAME             HEALTH   NODES   VERSION   PHASE   AGE
eck-ha-cluster   green    5       8.17.5    Ready   7m21s
root@k8s-master1:/k8s/log# kubectl get pod -n eck-cloud -o wide
NAME                               READY   STATUS    RESTARTS   AGE     IP               NODE          NOMINATED NODE   READINESS GATES
eck-ha-cluster-es-data-nodes-0     1/1     Running   0          7m22s   10.244.36.117    k8s-node1     <none>           <none>
eck-ha-cluster-es-data-nodes-1     1/1     Running   0          7m22s   10.244.169.148   k8s-node2     <none>           <none>
eck-ha-cluster-es-master-nodes-0   1/1     Running   0          7m22s   10.244.36.70     k8s-node1     <none>           <none>
eck-ha-cluster-es-master-nodes-1   1/1     Running   0          7m22s   10.244.159.170   k8s-master1   <none>           <none>
eck-ha-cluster-es-master-nodes-2   1/1     Running   0          7m22s   10.244.169.141   k8s-node2     <none>           <none>
root@k8s-master1:/k8s/log# kubectl get svc -n eck-cloud
NAME                              TYPE        CLUSTER-IP      EXTERNAL-IP   PORT(S)    AGE
eck-ha-cluster-es-data-nodes      ClusterIP   None            <none>        9200/TCP   7m30s
eck-ha-cluster-es-http            ClusterIP   10.98.179.47    <none>        9200/TCP   7m30s
eck-ha-cluster-es-internal-http   ClusterIP   10.99.102.220   <none>        9200/TCP   7m30s
eck-ha-cluster-es-master-nodes    ClusterIP   None            <none>        9200/TCP   7m30s
eck-ha-cluster-es-transport       ClusterIP   None            <none>        9300/TCP   7m30s
yaml
## 3. 查看es集群密码,默认用户elastic
root@k8s-master1:/k8s/log# kubectl -n eck-cloud  get secret eck-ha-cluster-es-elastic-user -o go-template='{{.data.elastic | base64decode}}'
IZzs45xl48Xiie1DaG33n097
yaml
## 4. 查看集群状态
root@k8s-master1:/k8s/log# curl -u "elastic:IZzs45xl48Xiie1DaG33n097" https://10.98.179.47:9200/_cluster/health?pretty -k
{
  "cluster_name" : "eck-ha-cluster",
  "status" : "green",
  "timed_out" : false,
  "number_of_nodes" : 5,
  "number_of_data_nodes" : 2,
  "active_primary_shards" : 2,
  "active_shards" : 4,
  "relocating_shards" : 0,
  "initializing_shards" : 0,
  "unassigned_shards" : 0,
  "unassigned_primary_shards" : 0,
  "delayed_unassigned_shards" : 0,
  "number_of_pending_tasks" : 0,
  "number_of_in_flight_fetch" : 0,
  "task_max_waiting_in_queue_millis" : 0,
  "active_shards_percent_as_number" : 100.0
}
三、安装kibana
Kibana 为 es 提供可视化分析平台,日常运维中可通过 Kibana 快速定位容器崩溃、接口异常、程序报错等问题
3.1 创建kibana pod
yaml
root@k8s-master1:/k8s/log# cat kibana.yaml
---
apiVersion: kibana.k8s.elastic.co/v1
kind: Kibana
metadata:
  name: kibana
spec:
  version: 8.17.5
  image: registry.cn-hangzhou.aliyuncs.com/hujiaming/kibana:8.17.5
  count: 1
  elasticsearchRef:
    name: eck-ha-cluster
  http:
   service:
     spec:
       type: NodePort
   tls:
     selfSignedCertificate:
       disabled: true
3.2 查看基本情况
yaml
root@k8s-master1:/k8s/log# kubectl apply -f kibana.yaml -n eck-cloud
root@k8s-master1:/k8s/log# kubectl get pod -n eck-cloud | grep kibana
kibana-kb-7d8b4b8f74-kggpc         1/1     Running   0          4m45s
root@k8s-master1:/k8s/log# kubectl get svc -n eck-cloud | grep kibana
kibana-kb-http                    NodePort    10.99.55.44     <none>        5601:32555/TCP   5m12s
四、安装kafka
Kafka 在 K8s 日志架构中充当消息中间件缓冲层,部署采用 KRaft 模式,同时开启 SASL_PLAINTEXT 身份认证保障日志传输安全
Filebeat 采集到海量容器日志后不会直接推送给 Logstash,而是先发送至 Kafka 指定 Topic 进行临时消息存储,利用 Kafka 高吞吐、消息持久化、多副本容错的特性削峰填谷,避免突发大量日志瞬间压垮后端 ES 与 Logstash 服务
4.1 安装kafka pod
我这里用helm安装
yaml
root@k8s-master1:/k8s/log# helm version
version.BuildInfo{Version:"v3.20.0", GitCommit:"b2e4314fa0f229a1de7b4c981273f61d69ee5a59", GitTreeState:"clean", GoVersion:"go1.25.6"}
root@k8s-master1:/k8s/log# helm repo list
NAME    URL
bitnami https://helm-charts.itboon.top/bitnami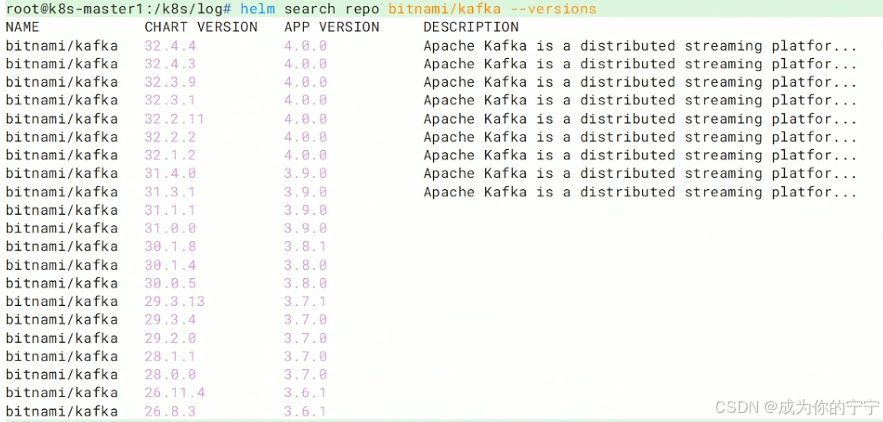
yaml
root@k8s-master1:/k8s/log# helm pull bitnami/kafka
root@k8s-master1:/k8s/log# ls
crds.yaml  es-cluster.yaml  kafka-32.4.4.tgz  kibana.yaml  operator.yaml
root@k8s-master1:/k8s/log# tar xf kafka-32.4.4.tgz
root@k8s-master1:/k8s/log# cd kafka/
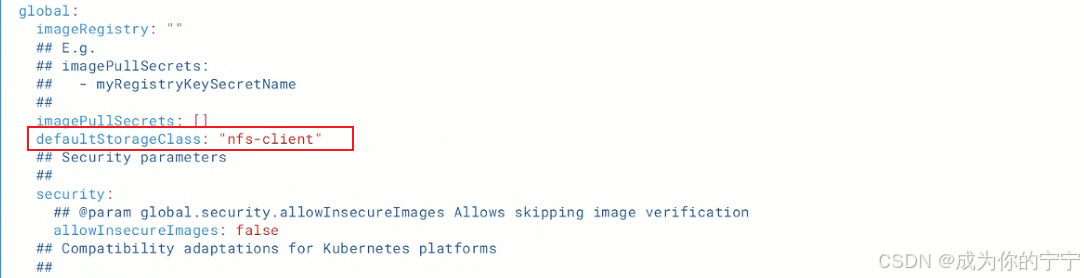
root@k8s-master1:/k8s/log/kafka# vim values.yaml
下面这里修改成自己sc
yaml
## 部署kafka
root@k8s-master1:/k8s/log/kafka# helm install kafka . --set kraft.enabled=true  -n eck-cloud
4.2 查看基本情况
yaml
root@k8s-master1:/k8s/log/kafka# kubectl get pod -n eck-cloud | grep kafka
kafka-controller-0                 1/1     Running   0          4m10s
kafka-controller-1                 1/1     Running   0          4m10s
kafka-controller-2                 1/1     Running   0          4m10s

## svc kafka: 供集群filebeat、logstash同一访问kafak
## svc kafka-controller-headless: kraft集群多节点之间互相发现、通信、选主
root@k8s-master1:/k8s/log/kafka# kubectl get svc -n eck-cloud | grep kafka
kafka                             ClusterIP   10.110.163.118   <none>        9092/TCP                     15m
kafka-controller-headless         ClusterIP   None             <none>        9094/TCP,9092/TCP,9093/TCP   15m
yaml
##  查看Kafka的核心参数、配置文件
root@k8s-master1:/k8s/log# kubectl exec -it -n eck-cloud kafka-controller-0 /bin/bash
I have no name!@kafka-controller-0:/$ cat /opt/bitnami/kafka/config/server.properties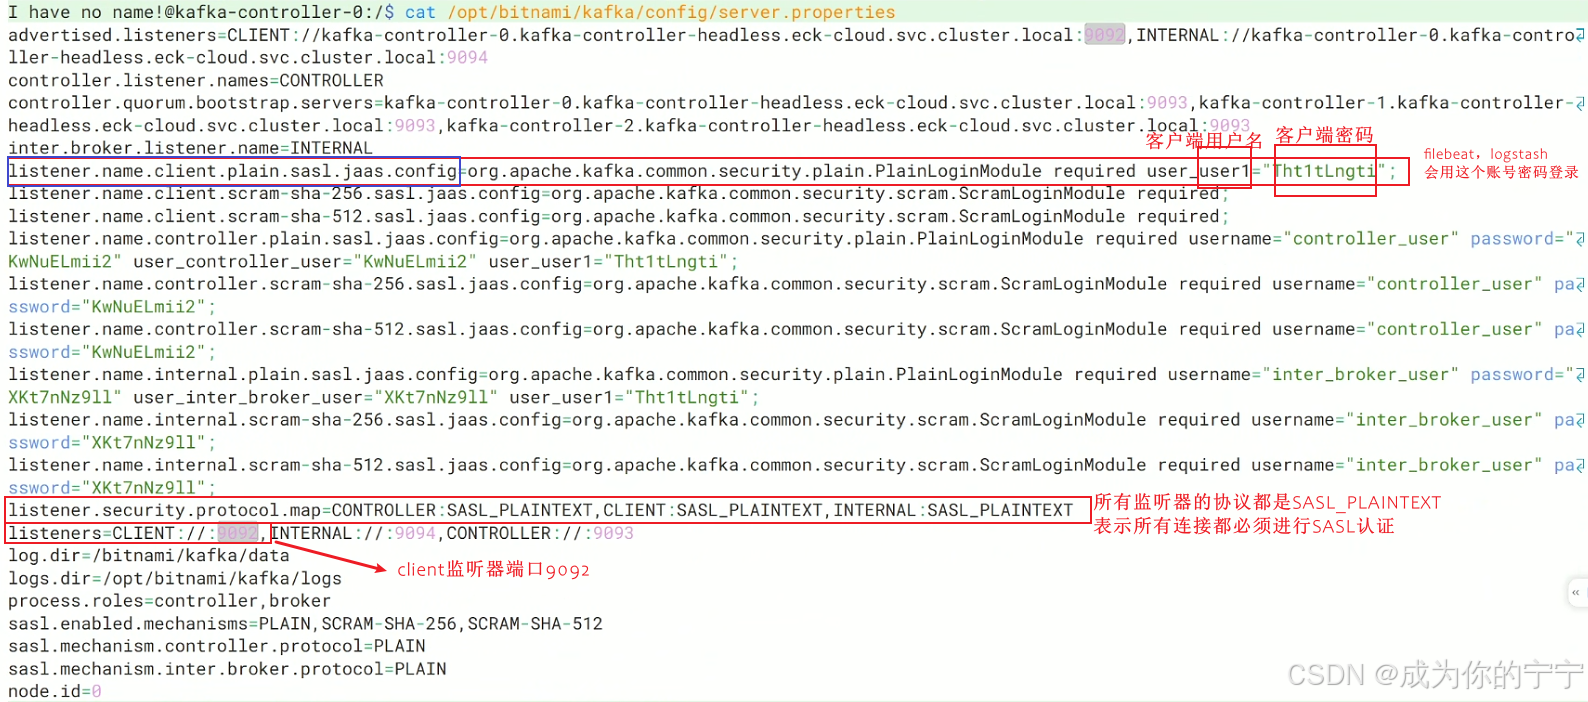
五、安装logstash
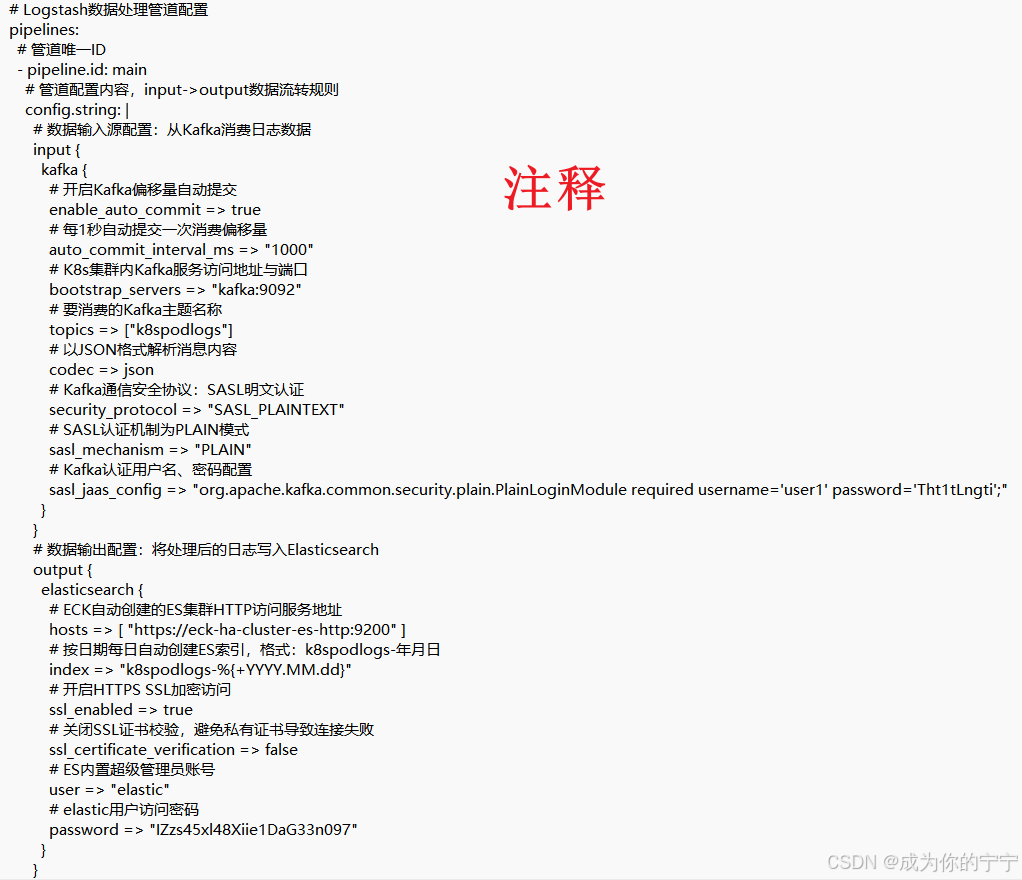
Logstash 属于日志数据预处理中间件,核心承担日志过滤、清洗、格式转换工作,一端消费 Kafka 缓冲队列中的容器原始日志,一端将规范化后的结构化日志推送至 Elasticsearch 集群存储索引
5.1 创建logstash pod
yaml
root@k8s-master1:/k8s/log# vim logstash.yaml
apiVersion: logstash.k8s.elastic.co/v1alpha1
kind: Logstash
metadata:
  name: logstash
spec:
  version: 8.17.5
  image: registry.cn-hangzhou.aliyuncs.com/hujiaming/logstash:8.17.5
  count: 3
  elasticsearchRefs:
    - clusterName: es
      name: eck-ha-cluster
  # Logstash数据处理管道配置
  podTemplate:
    spec:
      tolerations:
        - key: "node-role.kubernetes.io/control-plane"
          operator: "Exists"
          effect: "NoSchedule"
      containers:
        - name: logstash
          resources:
            requests:
              cpu: 500m
              memory: 1Gi
            limits:
              cpu: 1000m
              memory: 1.5Gi
      volumes:
        - name: logstash-data
          emptyDir: {}
  pipelines:
    - pipeline.id: main
      config.string: |
        input {
          kafka {
            enable_auto_commit => true
            auto_commit_interval_ms => "1000"
            bootstrap_servers => "kafka:9092"
            topics => ["k8spodlogs"]
            codec => json
            security_protocol => "SASL_PLAINTEXT"
            sasl_mechanism => "PLAIN"
            sasl_jaas_config => "org.apache.kafka.common.security.plain.PlainLoginModule required username='user1' password='Tht1tLngti';"
          }
        }
        output {
          elasticsearch {
            hosts => [ "https://eck-ha-cluster-es-http:9200" ]
            index => "k8spodlogs-%{+YYYY.MM.dd}"
            ssl_enabled => true
            ssl_certificate_verification => false
            user => "elastic"
            password => "IZzs45xl48Xiie1DaG33n097"
          }
        }
5.2 查看基本情况
yaml
root@k8s-master1:/k8s/log# kubectl apply -f logstash.yaml -n eck-cloud
root@k8s-master1:/k8s/log# kubectl get pod -n eck-cloud | grep logstash
logstash-ls-0                      1/1     Running   0          4m32s
logstash-ls-1                      1/1     Running   0          4m32s
logstash-ls-2                      1/1     Running   0          4m32s
六、安装filebeat
6.1 创建filebeat pod
yaml
root@k8s-master1:/k8s/log# vim filebeat.yaml
apiVersion: beat.k8s.elastic.co/v1beta1
kind: Beat
metadata:
  name: filebeat
  namespace: eck-cloud
spec:
  type: filebeat
  version: 8.17.5
  image: registry.cn-hangzhou.aliyuncs.com/hujiaming/filebeat:8.17.5
  daemonSet:
    podTemplate:
      spec:
        serviceAccountName: filebeat
        automountServiceAccountToken: true
        terminationGracePeriodSeconds: 30
        dnsPolicy: ClusterFirstWithHostNet
        hostNetwork: true
        containers:
        - name: filebeat
          command:
          - /usr/share/filebeat/filebeat
          args:
          - -e
          - -c
          - /config/filebeat.yml
          securityContext:
            runAsUser: 0
          volumeMounts:
          - name: varlogcontainers
            mountPath: /var/log/containers
          - name: varlogpods
            mountPath: /var/log/pods
          - name: varlibdockercontainers
            mountPath: /var/lib/docker/containers
          - name: messages
            mountPath: /var/log/messages
          - name: data
            mountPath: /usr/share/filebeat/data
           # 挂载cm
          - name: config-volume
            mountPath: /config
          env:
          - name: NODE_NAME
            valueFrom:
              fieldRef:
                fieldPath: spec.nodeName
        volumes:
        - name: varlogcontainers
          hostPath:
            path: /var/log/containers
        - name: varlogpods
          hostPath:
            path: /var/log/pods
        - name: varlibdockercontainers
          hostPath:
            path: /var/lib/docker/containers
        - name: messages
          hostPath:
            path: /var/log/messages
        - name: data
          hostPath:
            path: /var/lib/filebeat-data
            type: DirectoryOrCreate
        # cm
        - name: config-volume
          configMap:
            name: filebeat-config
6.2 创建filebeat cm
yaml
root@k8s-master1:/k8s/log# vim filebeat-config.yaml
apiVersion: v1
kind: ConfigMap
metadata:
  name: filebeat-config
  namespace: eck-cloud
data:
  filebeat.yml: |
    filebeat.inputs:
    - type: log
      enabled: true
      paths:
        - /var/log/containers/*.log
      symlinks: true
      tail_files: true
      scan_frequency: 10s
      harvester_limit: 100
      processors:
      - add_kubernetes_metadata:
          host: ${NODE_NAME}
      - add_fields:
          target: fields
          fields:
            log_topic: k8spodlogs
      - add_cloud_metadata: {}
      - add_host_metadata: {}
      - drop_event:
          when:
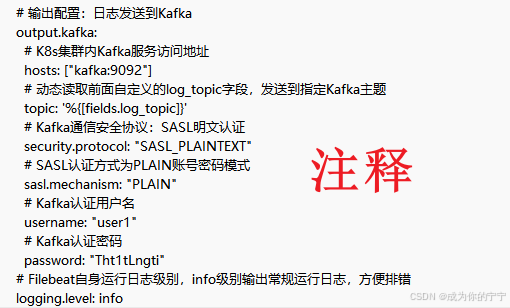
            or:
            - equals:
                kubernetes.container.name: "filebeat"
    output.kafka:
      hosts: ["kafka:9092"]
      topic: '%{[fields.log_topic]}'
      security.protocol: "SASL_PLAINTEXT"
      sasl.mechanism: "PLAIN"
      username: "user1"
      password: "Tht1tLngti"
    logging.level: info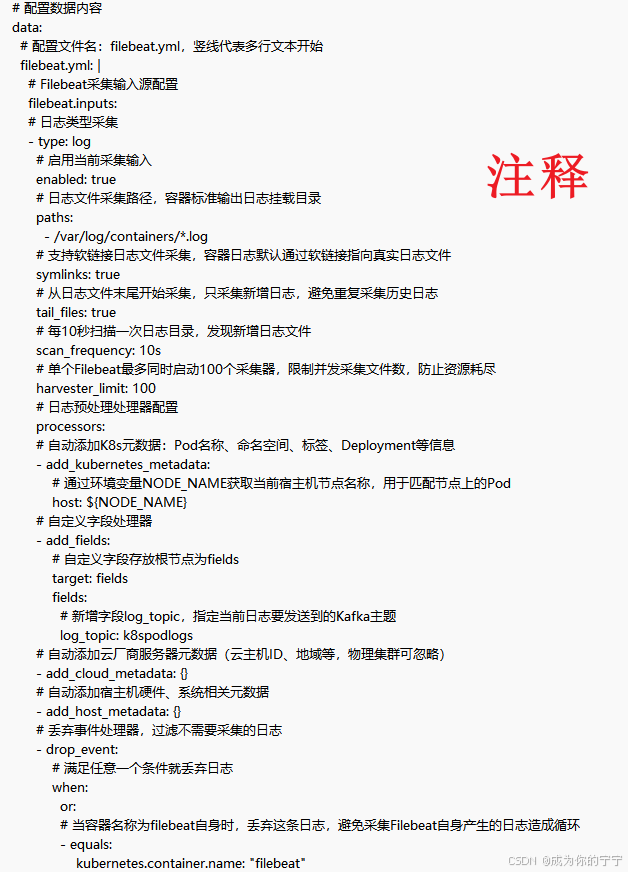
6.3 创建filebeat rbac
yaml
root@k8s-master1:/k8s/log# vim filebeat-rbac.yaml
apiVersion: v1
kind: ServiceAccount
metadata:
  name: filebeat
  namespace: eck-cloud
---
apiVersion: rbac.authorization.k8s.io/v1
kind: ClusterRole
metadata:
  name: filebeat
rules:
- apiGroups: [""]
  resources:
  - nodes
  - namespaces
  - events
  - pods
  - services
  - configmaps
  verbs: ["get", "list", "watch"]
- apiGroups: ["extensions"]
  resources:
  - replicasets
  verbs: ["get", "list", "watch"]
- apiGroups: ["apps"]
  resources:
  - statefulsets
  - deployments
  - replicasets
  verbs: ["get", "list", "watch"]
---
apiVersion: rbac.authorization.k8s.io/v1
kind: ClusterRoleBinding
metadata:
  name: filebeat
subjects:
- kind: ServiceAccount
  name: filebeat
  namespace: eck-cloud
roleRef:
  kind: ClusterRole
  name: filebeat
  apiGroup: rbac.authorization.k8s.io
root@k8s-master1:/k8s/log#
6.4 查看基本情况
yaml
root@k8s-master1:/k8s/log# kubectl apply -f filebeat-rbac.yaml -n eck-cloud
root@k8s-master1:/k8s/log# kubectl apply -f filebeat-config.yaml -n eck-cloud
root@k8s-master1:/k8s/log# kubectl apply -f filebeat.yaml -n eck-cloud
root@k8s-master1:/k8s/log# kubectl get pod -n eck-cloud | grep filebeat
filebeat-beat-filebeat-724c8       1/1     Running   0          101s
filebeat-beat-filebeat-p9thx       1/1     Running   0          101s
七、验证信息
下面的验证都要正确,否则kibana上查看不到日志
7.1 filebeat验证
1,查看一下我们自己写的cm有没有被加载到pod中
yaml
root@k8s-master1:/k8s/log# kubectl exec -it -n eck-cloud  filebeat-beat-filebeat-724c8 /bin/bash
root@k8s-node1:/usr/share/filebeat# ls /config/
filebeat.yml
root@k8s-node1:/usr/share/filebeat# cat /config/filebeat.yml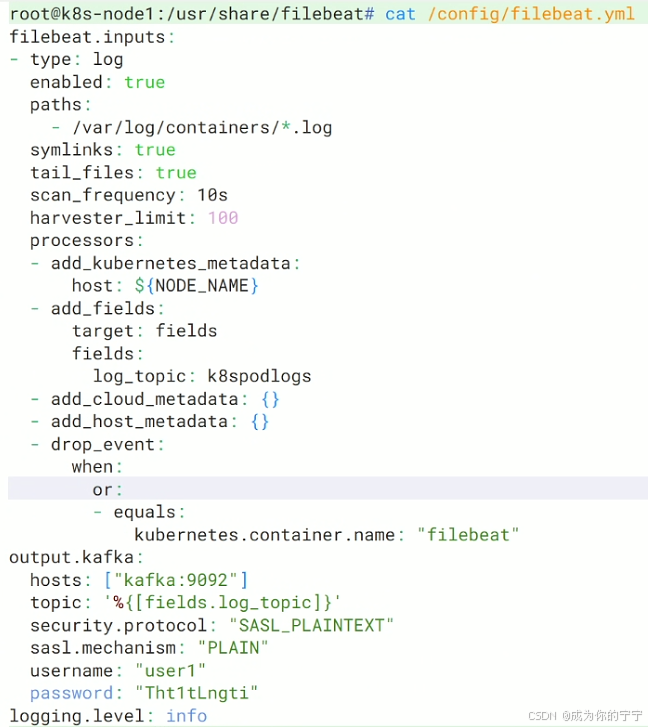
查看进程有没有运行,如果没有运行,我们的cm就没有加载成功
yaml
root@k8s-node1:/usr/share/filebeat# ps aux | grep filebeat
root          1  0.2  1.2 2086120 111360 ?      Ssl  02:01   0:31 /usr/share/filebeat/filebeat -e -c /config/filebeat.yml
root         29  0.0  0.0   3308   720 pts/0    S+   05:58   0:00 grep --color=auto filebeat
2,查看/var/log/containers/是否有日志文件
yaml
root@k8s-master1:/k8s/log# kubectl exec -it -n eck-cloud  filebeat-beat-filebeat-724c8 /bin/bash
root@k8s-node1:/usr/share/filebeat# ls /var/log/containers/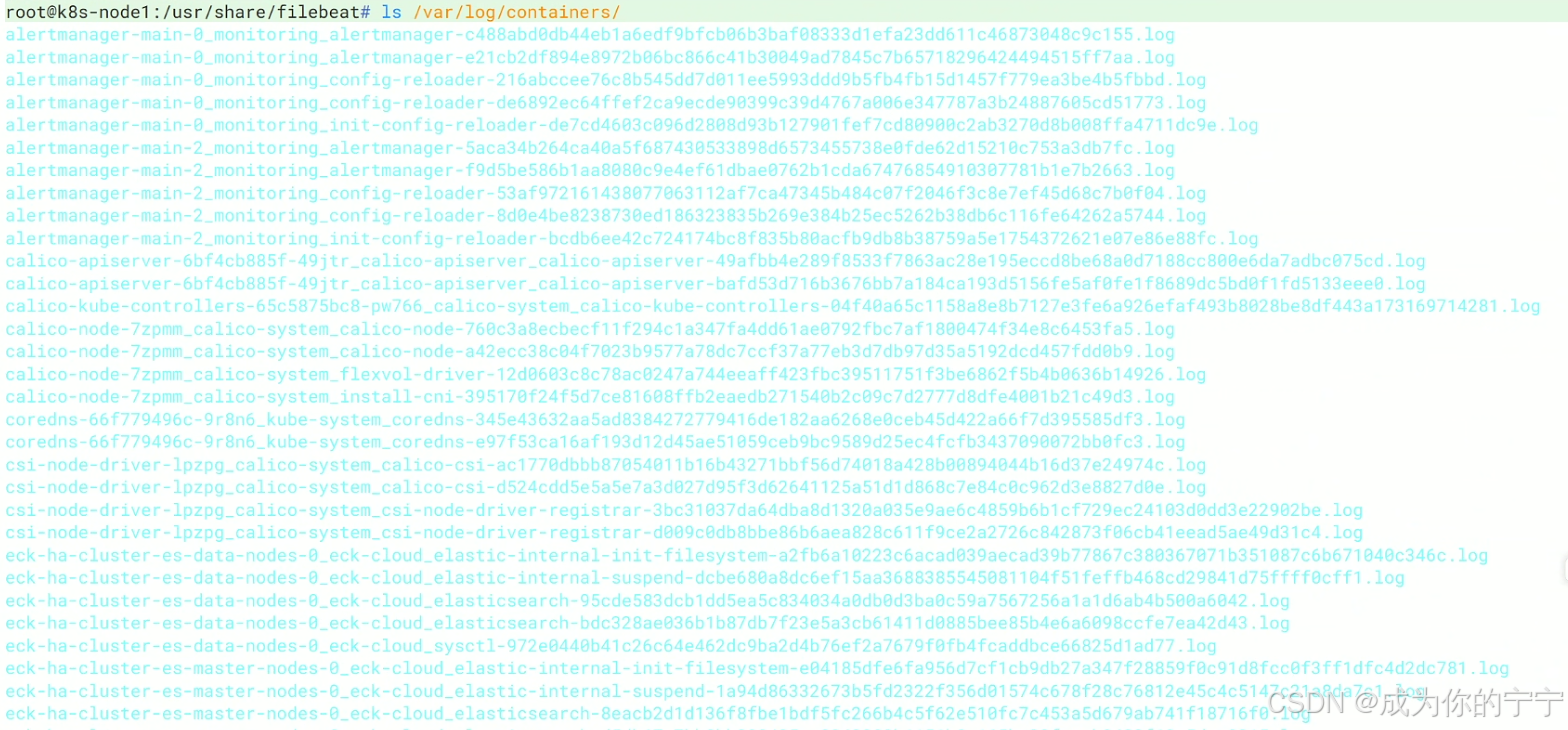
3,查看harvester.open_files是否大于0
yaml
root@k8s-master1:/k8s/log# kubectl logs -n eck-cloud filebeat-beat-filebeat-724c8 | grep harvester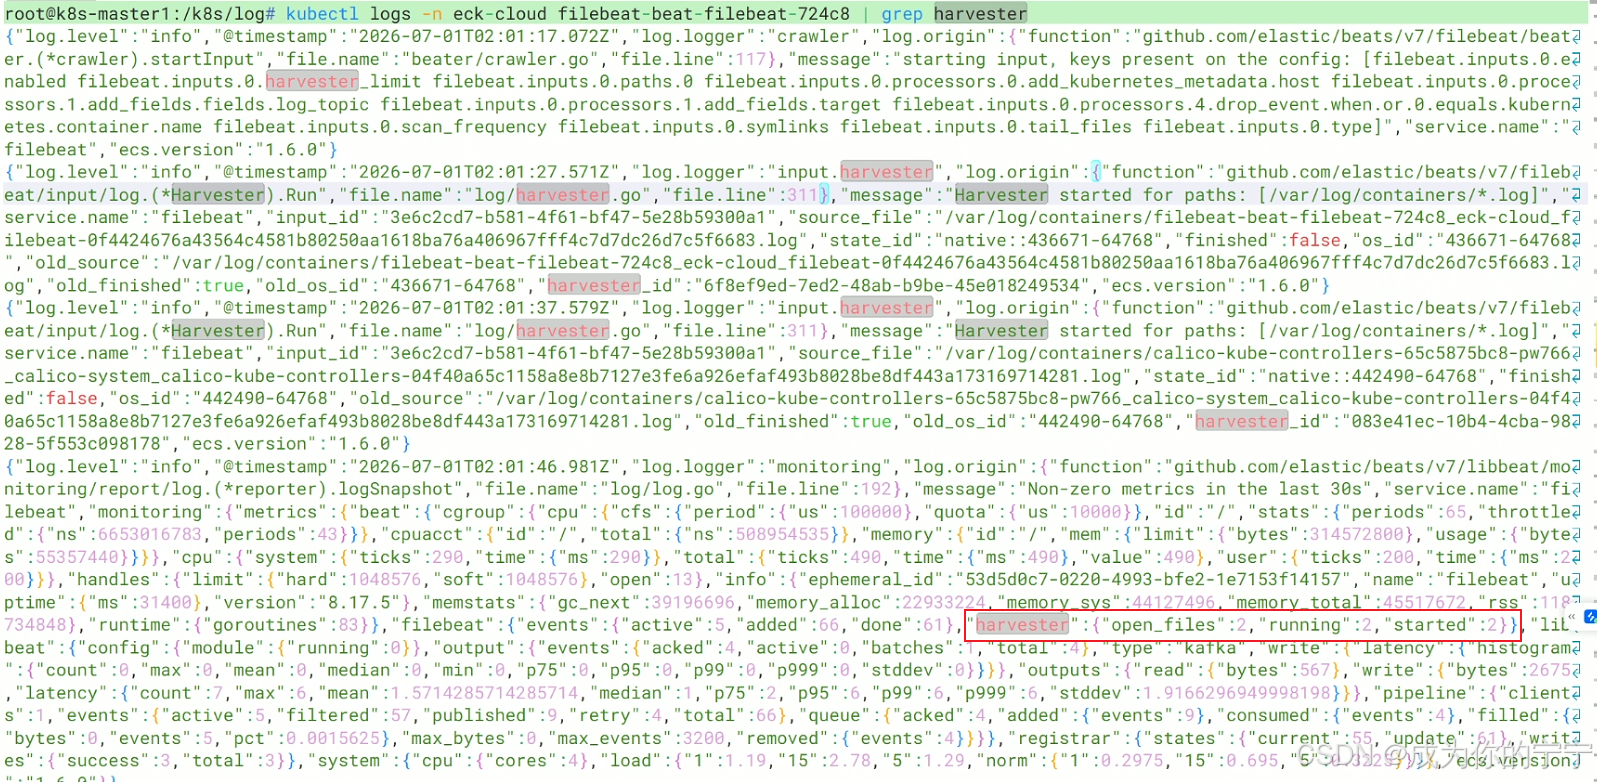
7.2 kafka验证
查看fakfa有没有采集到filebeat的日志
yaml
root@k8s-master1:/k8s/log# kubectl exec -it -n eck-cloud kafka-controller-0 /bin/bash
I have no name!@kafka-controller-0:/$ kafka-console-consumer.sh \
  --bootstrap-server kafka:9092 \
  --topic k8spodlogs \
  --from-beginning \
  --consumer-property security.protocol=SASL_PLAINTEXT \
  --consumer-property sasl.mechanism=PLAIN \
  --consumer-property 'sasl.jaas.config=org.apache.kafka.common.security.plain.PlainLoginModule required username="user1" password="Tht1tLngti";'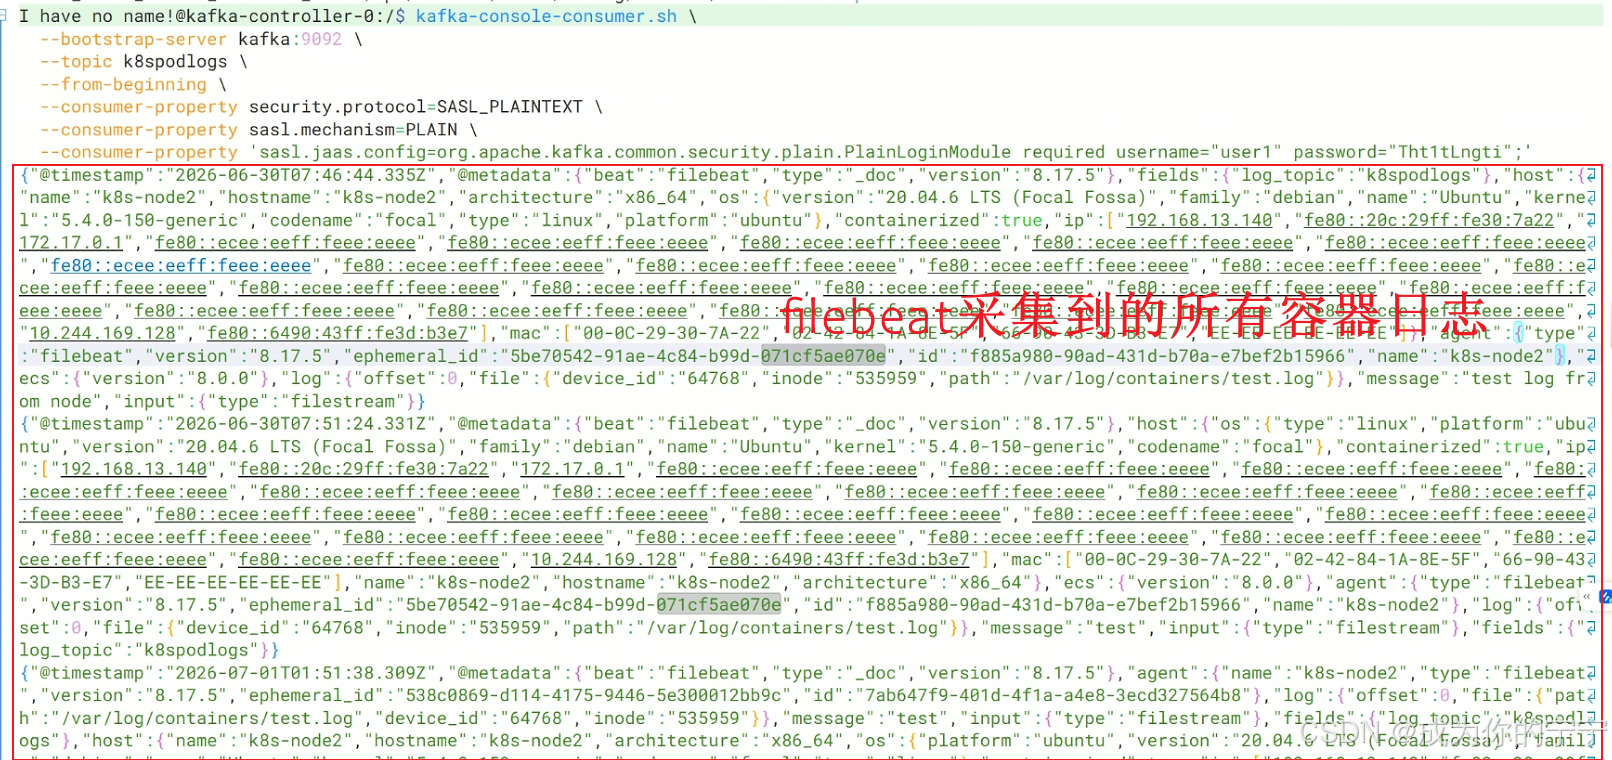
7.3 es验证
查看es中有没有生成对应的索引
yaml
root@k8s-master1:/k8s/log# kubectl exec -it eck-ha-cluster-es-master-nodes-0 /bin/bash -n eck-cloud
elasticsearch@eck-ha-cluster-es-master-nodes-0:~$ curl -u "elastic:IZzs45xl48Xiie1DaG33n097" -k https://localhost:9200/_cat/indices?v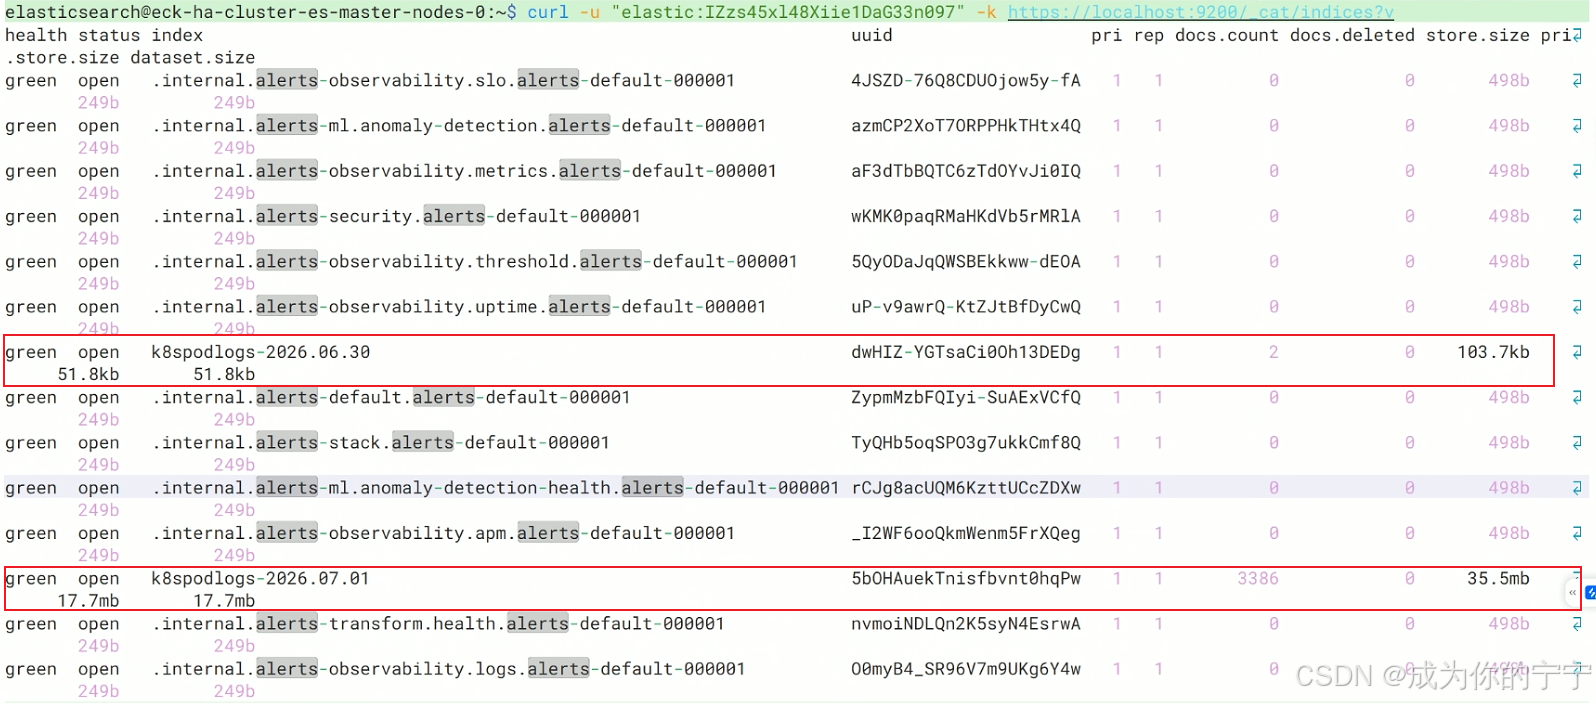
八、查看日志
yaml
root@k8s-master1:/k8s/log# kubectl get svc -n eck-cloud | grep kibana
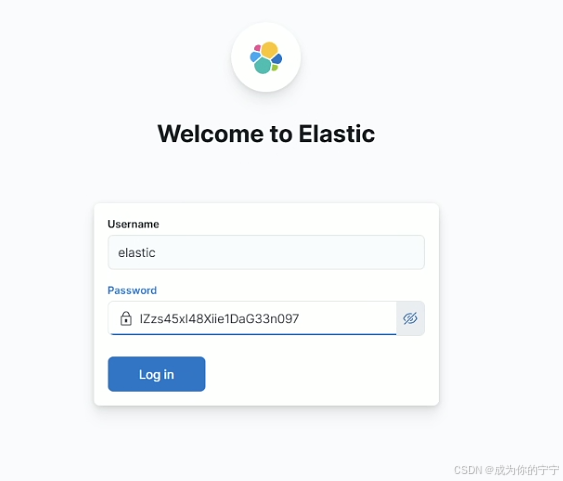
kibana-kb-http NodePort 10.99.55.44 <none> 5601:32555/TCP 124m浏览器访问:http://192.168.13.136:32555,账号默认elastic,密码是es集群密码
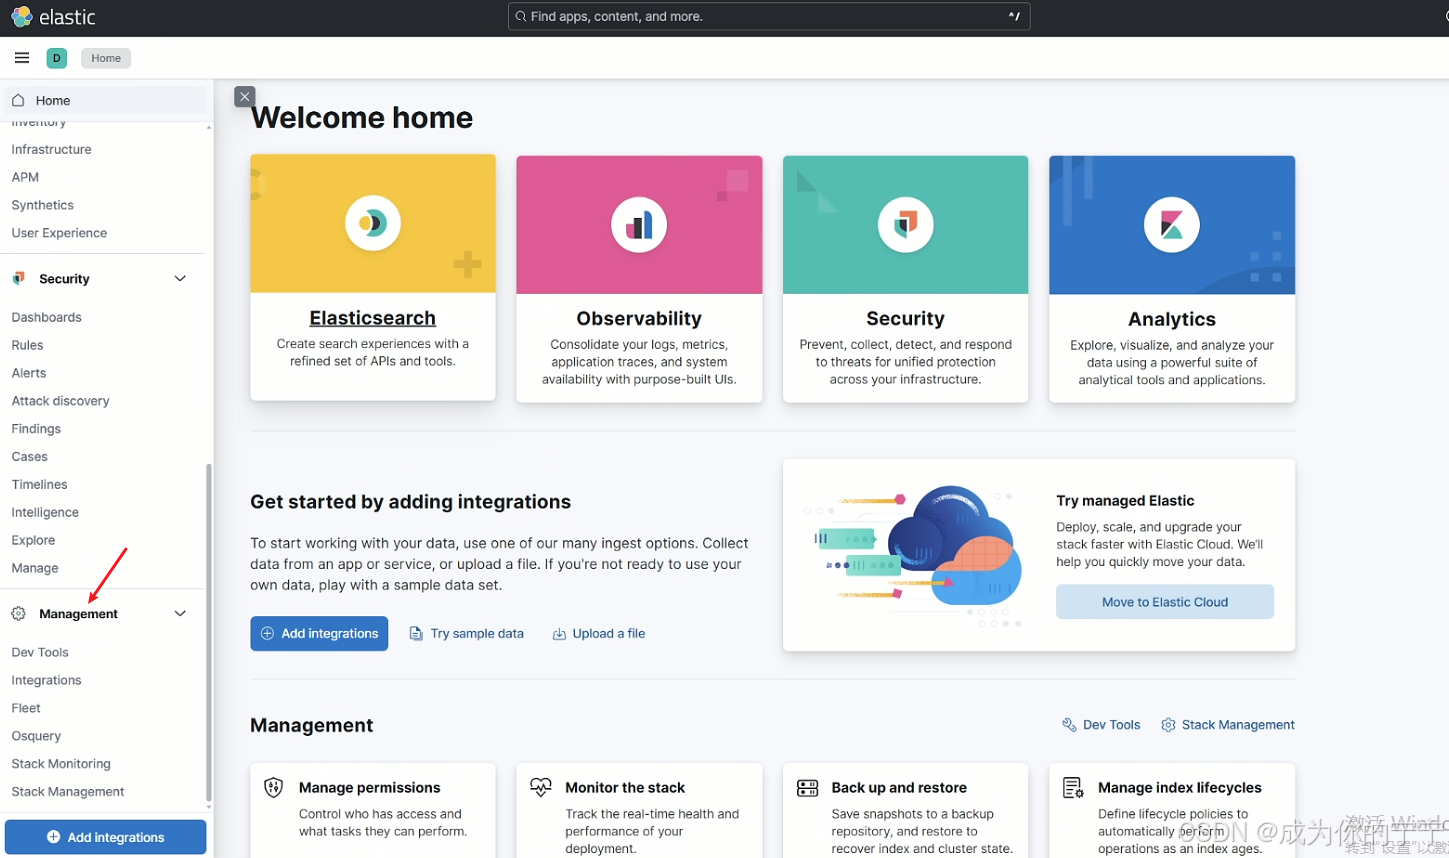
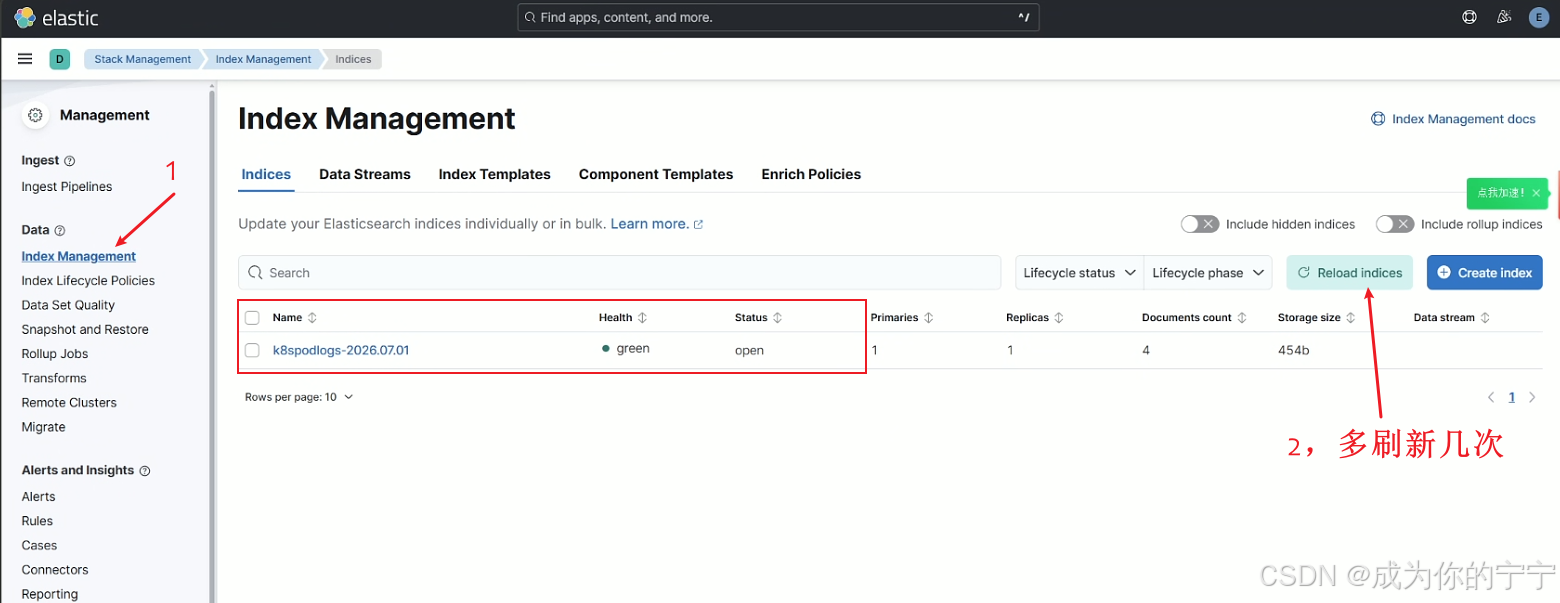
索引会自动刷新出来
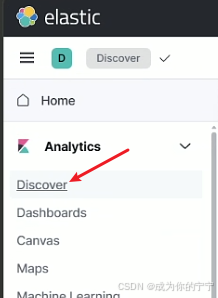
添加看板
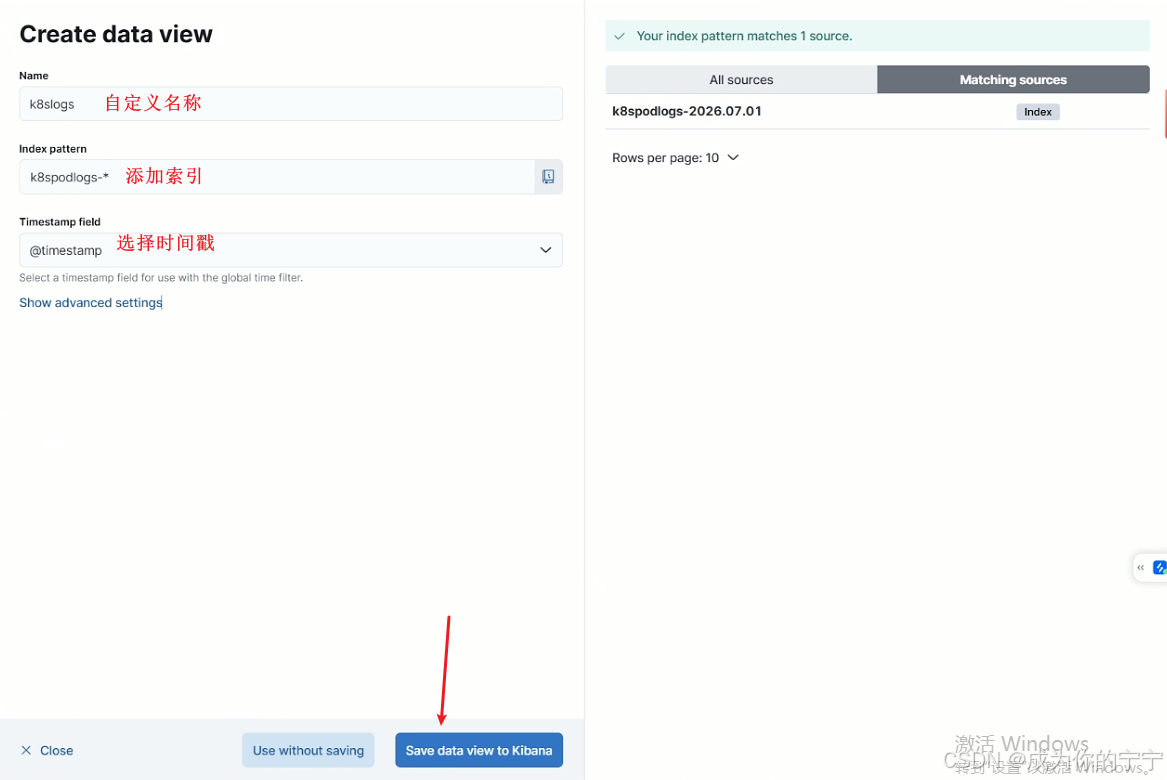
最终效果
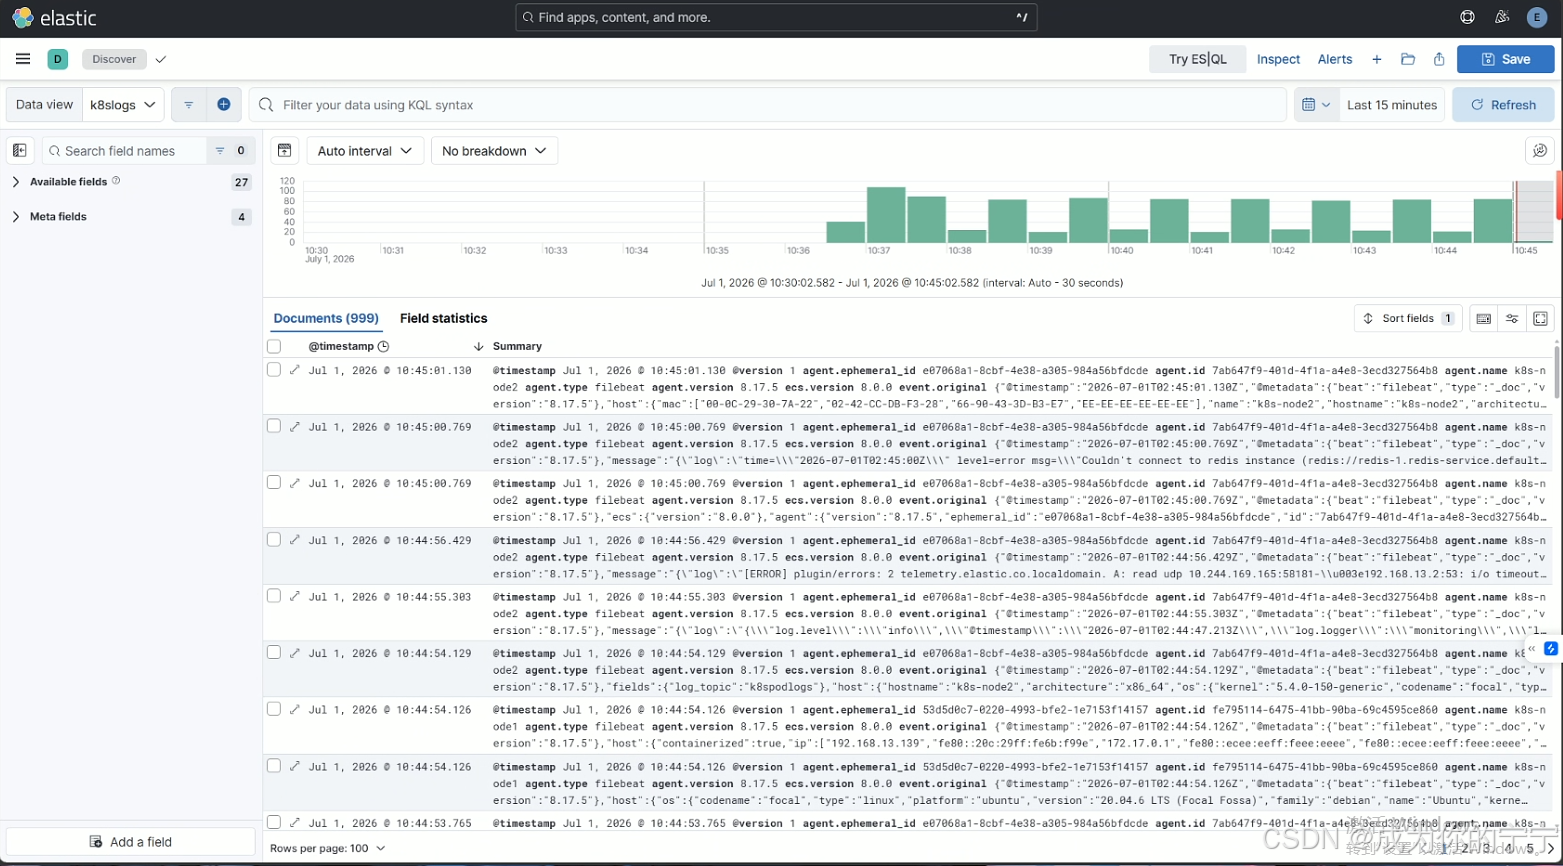
到此,K8S日志收集就完成了!
注:
文中若有疏漏,欢迎大家指正赐教。
本文为100%原创,转载请务必标注原创作者,尊重劳动成果。
求赞、求关注、求评论!你的支持是我更新的最大动力,评论区等你~