一、为什么需要单独监控 Nginx?
Nginx 跑着跑着连接数飙了、请求延迟涨了,等发现的时候用户已经在骂了。Prometheus + Grafana 能提前看到趋势,而不是等告警响了才冲进去救火。
但 Prometheus 不会直接扒 Nginx 的状态------中间需要一个"翻译官",把 Nginx 的内部指标转成 Prometheus 能懂的格式。这就是 nginx-prometheus-exporter。
整个链路长这样:
Nginx stub_status → nginx-prometheus-exporter → Prometheus 采集 → Grafana 展示三步走:开 stub_status → 部署 exporter → 接 Prometheus + Grafana。
二、开启 Nginx stub_status
stub_status 由 ngx_http_stub_status_module 模块提供,官方源码默认不编译 ,需在编译时加 --with-http_stub_status_module。但主流 Linux 发行版(CentOS/Ubuntu 的官方源、EPEL)预编译的 Nginx 包通常已包含。
1. stub_status 是干什么的?
开启后 Nginx 会暴露一个简单的状态页面,只输出一行纯文本,包含 7 个实时指标:
Active connections: 291
server accepts handled requests
 16630948 16630948 31070465
Reading: 6 Writing: 179 Waiting: 106| 指标 | 含义 | 用途 |
|---|---|---|
| Active connections | 当前活跃连接总数 | 判断 Nginx 负载水位 |
| accepts | 累计接收的连接数 | 配合 handled 看丢了多少连接(accepts ≠ handled 说明连接被拒绝) |
| handled | 累计处理完成的连接数 | 同上 |
| requests | 累计收到的请求数 | 计算 QPS(一个连接可能发多个请求) |
| Reading | 正在读请求头的连接数 | 过高说明客户端发请求慢或有攻击 |
| Writing | 正在写响应的连接数 | 过高说明后端处理慢,Nginx 在等 |
| Waiting | Keep-Alive 空闲连接数 | 正常水位,太高可调 keepalive_requests |
为什么需要它? Prometheus 不会直接读 Nginx 内部状态,stub_status 就是 Nginx 向外暴露指标的"窗口"。后面部署的 nginx-prometheus-exporter 会定期访问这个页面,把文本指标转成 Prometheus 能懂的格式,再由 Grafana 画图------没有这扇窗口,整个监控链路的起点就没有了。
2. 检查模块是否已编译
bash
nginx -V 2>&1 | grep -o with-http_stub_status_module有输出说明已编译进去,直接改配置即可。如果没输出,需要重新编译 Nginx 并加上 --with-http_stub_status_module。
3. 配置 stub_status
确认模块存在后,在 nginx.conf 加一个 location:
nginx
server {
    listen 127.0.0.1:18081;
    server_name localhost;

    location /nginx_status {
        stub_status on;
        allow 127.0.0.1;
        deny all;
    }
}
4. 重载并验证
重载 Nginx:
bash
nginx -t && nginx -s reload验证:
bash
curl http://127.0.0.1:18081/nginx_status输出示例:

如果看到这个,说明 stub_status 已成功开启。注意:只开了 127.0.0.1 白名单,exporter 要部署在同一台机器上才能读到。
三、部署 nginx-prometheus-exporter
1. 下载 exporter
bash
# 最新版 v1.5.1
wget https://github.com/nginx/nginx-prometheus-exporter/releases/download/v1.5.1/nginx-prometheus-exporter_1.5.1_linux_arm64.tar.gz

tar xzf nginx-prometheus-exporter_1.5.1_linux_arm64.tar.gz
mv nginx-prometheus-exporter /usr/local/bin/
2. 创建 systemd 服务
bash
cat > /etc/systemd/system/nginx-prometheus-exporter.service <<EOF
[Unit]
Description=Nginx Prometheus Exporter
After=network.target

[Service]
Type=simple
User=root
ExecStart=/usr/local/bin/nginx-prometheus-exporter \
  -nginx.scrape-uri=http://127.0.0.1:18081/nginx_status
Restart=always

[Install]
WantedBy=multi-user.target
EOF
3. 启动并验证
bash
systemctl daemon-reload
systemctl enable nginx-prometheus-exporter --now
systemctl status nginx-prometheus-exporter
验证指标输出:
bash
curl -s http://localhost:9113/metrics | head -20看到类似输出说明 exporter 正常工作:

四、接入 Prometheus
1. 添加 scrape 配置
在 Prometheus 配置文件的 scrape_configs 下新增一个 job,一般在/etc/prometheus/prometheus.yml:
yaml
- job_name: 'nginx'
    static_configs:
    - targets:
        - 172.16.130.2:9113
      labels:
        instance: 'nginx-prod-01'
    - targets:
        - 172.16.130.58:9113
      labels:
        instance: 'nginx-prod-02'
参数说明:
| 字段 | 值 | 说明 |
|---|---|---|
targets |
IP:9113 |
exporter 默认监听 9113 端口 |
scrape_interval |
省略 | 用 Prometheus 全局默认(一般 15s) |
labels.instance |
自定义 | Grafana 里用来区分不同 Nginx 实例 |
2. 加载 Prometheus
bash
#systemd 重启
systemctl restart prometheus
3. 验证采集状态
打开 Prometheus Web UI(http://<IP>:9090/targets),确认 nginx job 的 State 为 UP。
或者直接查指标:
promql
# Prometheus 表达式输入框
nginx_connections_active 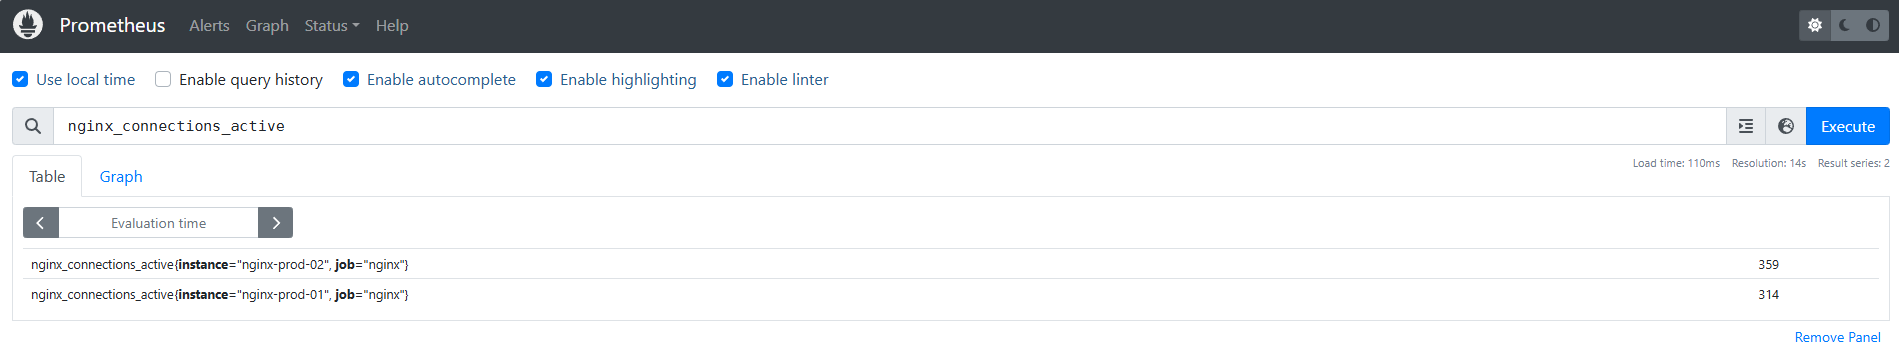
有数据返回就说明采集正常。
五、Grafana 可视化
1. 下载官方 Dashboard(内网环境)
内网 Grafana 无法直接从 grafana.com 在线导入,需要先下载 JSON 文件:
- 官方 GitHub:https://raw.githubusercontent.com/nginxinc/nginx-prometheus-exporter/main/grafana/dashboard.json
把 JSON 文件传到能访问内网 Grafana 的机器上,然后导入。
2. 导入步骤
- Grafana 左侧菜单 → Dashboards → New → Import
- 点击 Upload JSON file ,选择下载的
dashboard.json - 在 Prometheus 下拉框选择配置的数据源 → 点击 Import
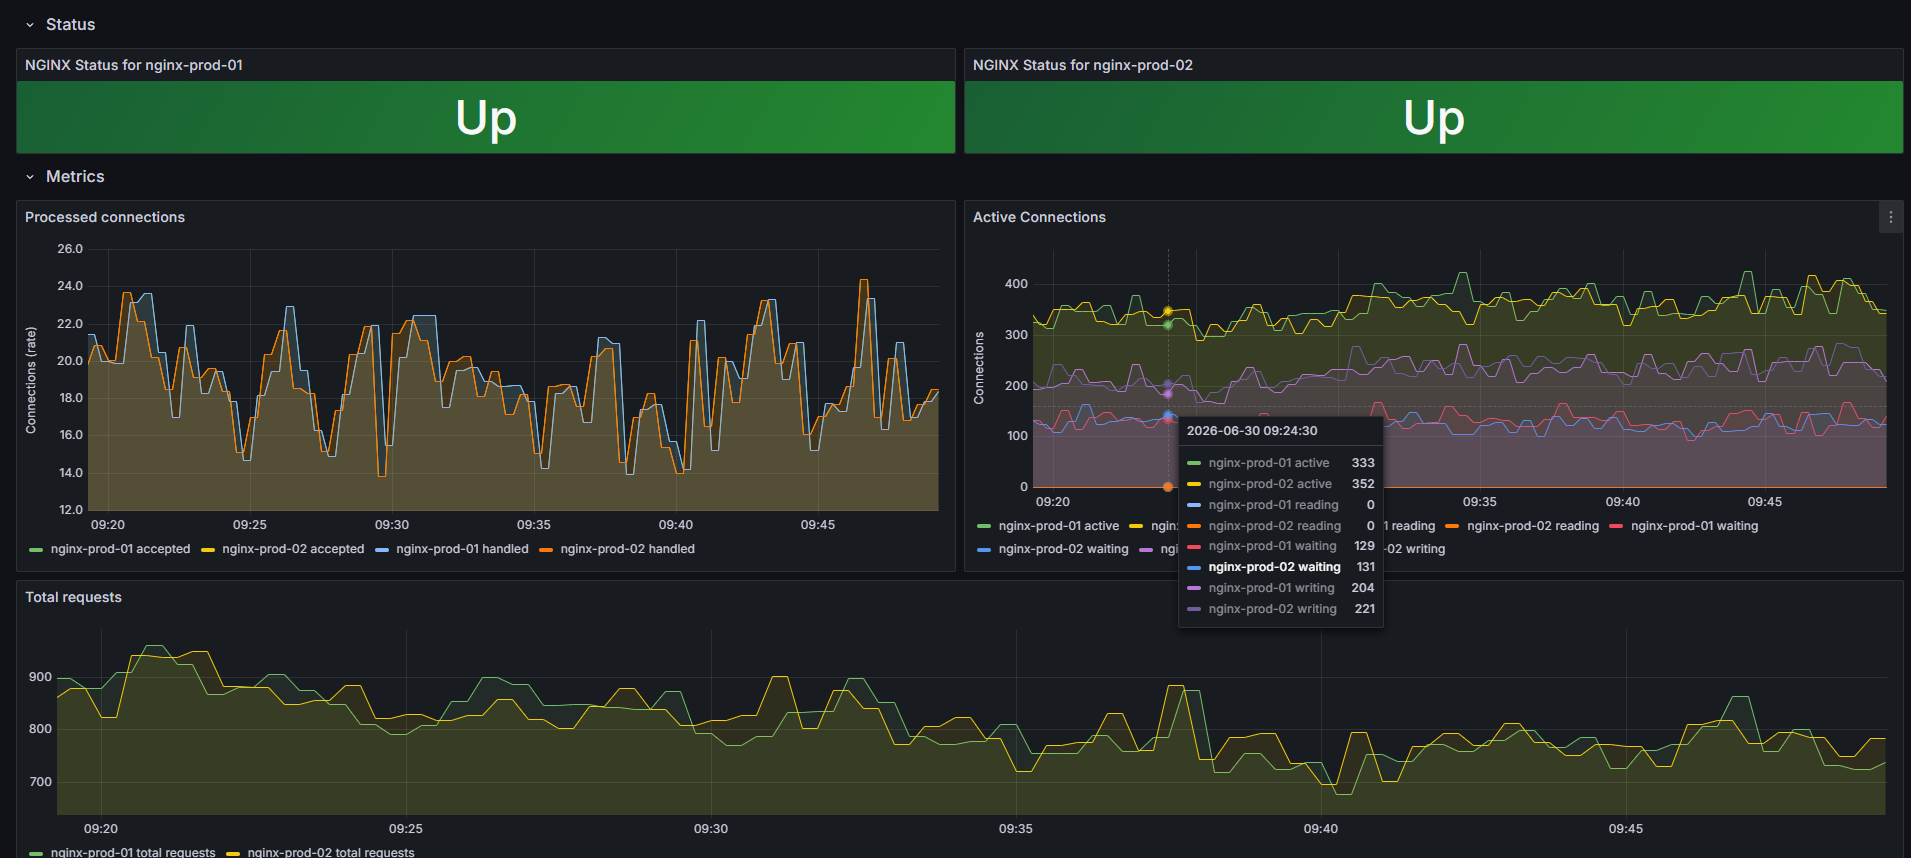
3. 面板概览
官方 Dashboard 包含以下核心面板:
| 面板 | 指标 | 说明 |
|---|---|---|
| NGINX Status | nginx_up |
绿=正常,红=挂了 |
| Processed connections | nginx_connections_accepted/handled |
连接处理速率曲线 |
| Active Connections | reading/writing/waiting/active | 四类连接实时分拆 |
| Total requests | nginx_http_requests_total |
请求 QPS 折线图 |
3. 告警规则
yaml
# prometheus rules
groups:
- name: nginx
  rules:
  # ===== 存活告警 =====
  - alert: NginxDown
    expr: nginx_up{job="nginx"} == 0
    for: 1m
    labels:
      severity: critical
    annotations:
      summary: "Nginx 不可达"
      description: "{{ $labels.instance }} 的 nginx 进程可能已停止,请立即检查"

  - alert: NginxExporterDown
    expr: up{job="nginx"} == 0
    for: 1m
    labels:
      severity: critical
    annotations:
      summary: "Nginx Exporter 已停止"
      description: "{{ $labels.instance }} 的 exporter 进程挂了,nginx 状态未知"

  # ===== 连接数告警 =====
  - alert: NginxHighConnections
    expr: nginx_connections_active{job="nginx"} > 10000
    for: 2m
    labels:
      severity: warning
    annotations:
      summary: "Nginx 活跃连接数过高"
      description: "{{ $labels.instance }} 当前活跃连接 {{ $value }},超过 10000 阈值"

  # ===== 错误率告警 =====
  - alert: NginxRequestRateHigh
    expr: rate(nginx_http_requests_total{job="nginx"}[5m]) > 5000
    for: 5m
    labels:
      severity: warning
    annotations:
      summary: "Nginx QPS 异常升高"
description: "{{ $labels.instance }} 当前 QPS {{ $value }},请确认是否有流量冲击"告警说明:
| 规则 | 表达式 | 含义 |
|---|---|---|
NginxDown |
nginx_up == 0 |
exporter 正常但连不上 nginx(进程挂了或端口不通) |
NginxExporterDown |
up == 0 |
exporter 自身已停止,nginx 状态未知 |
NginxHighConnections |
nginx_connections_active > 10000 |
活跃连接超阈值,可能后端处理慢 |
NginxRequestRateHigh |
rate(nginx_http_requests_total[5m]) > 5000 |
QPS 异常飙升,需确认是否受攻击 |
关键区分 :nginx_up 是 exporter 上报的(能区分 nginx 挂了 vs exporter 挂了),up 是 Prometheus 自己加的(scrape 是否成功)。挂了 up={job="nginx"} == 0 只能说明 scrape 失败,分不清是 exporter 崩了还是 nginx 崩了,所以两条都要配。
六、关键指标速查
| 指标名 | 类型 | 含义 | 告警参考 |
|---|---|---|---|
nginx_connections_active |
Gauge | 当前活跃连接数 | > 10000 |
nginx_connections_reading |
Gauge | 正在读请求头的连接 | 持续增长说明请求慢 |
nginx_connections_writing |
Gauge | 正在写响应的连接 | 过高说明后端慢 |
nginx_connections_waiting |
Gauge | Keep-Alive 空闲连接 | 结合 reading+writing 看吞吐 |
nginx_http_requests_total |
Counter | 累计请求数(按状态码分) | 用 rate() 算 QPS |
nginx_up |
Gauge | exporter 能否连上 Nginx | = 0 时告警 |
最常用的 PromQL:
promql
# QPS
rate(nginx_http_requests_total[1m])

# 5xx 错误率
rate(nginx_http_requests_total{status=~"5.."}[5m]) / rate(nginx_http_requests_total[5m])

# 连接数趋势
nginx_connections_active
七、总结
整个部署链路一句话:Nginx 开 stub_status → 装 exporter → Prometheus 加 job → Grafana 导面板。
落地清单:
- nginx.conf 中启用
stub_status,限制 127.0.0.1 访问 - 部署 nginx-prometheus-exporter v1.5.1,systemd 管理
curl localhost:9113/metrics验证 exporter 输出正常- Prometheus
scrape_configs添加nginxjob - Prometheus Targets 确认 State = UP
- Grafana 导入 Dashboard 17452
- 加上 5xx 错误率 + 高连接数告警
注意:exporter 不挑 Nginx 版本(1.18 ~ 1.30 全兼容),只要 stub_status 开着就行。