一、添加阿里云 Grafana YUM 源
bash
sudo tee /etc/yum.repos.d/grafana.repo > /dev/null << 'EOF'
[grafana]
name=Grafana
baseurl=https://mirrors.aliyun.com/grafana/yum/rpm
enabled=1
gpgcheck=0
repo_gpgcheck=0
EOF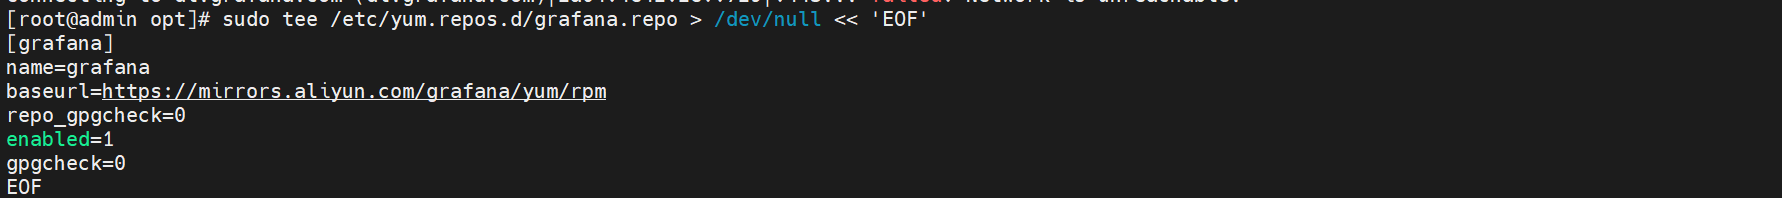
二、安装 Grafana
bash
sudo dnf makecache
sudo dnf install -y grafana
三、启动并设置开机自启
bash
sudo systemctl enable --now grafana-server
sudo systemctl status grafana-server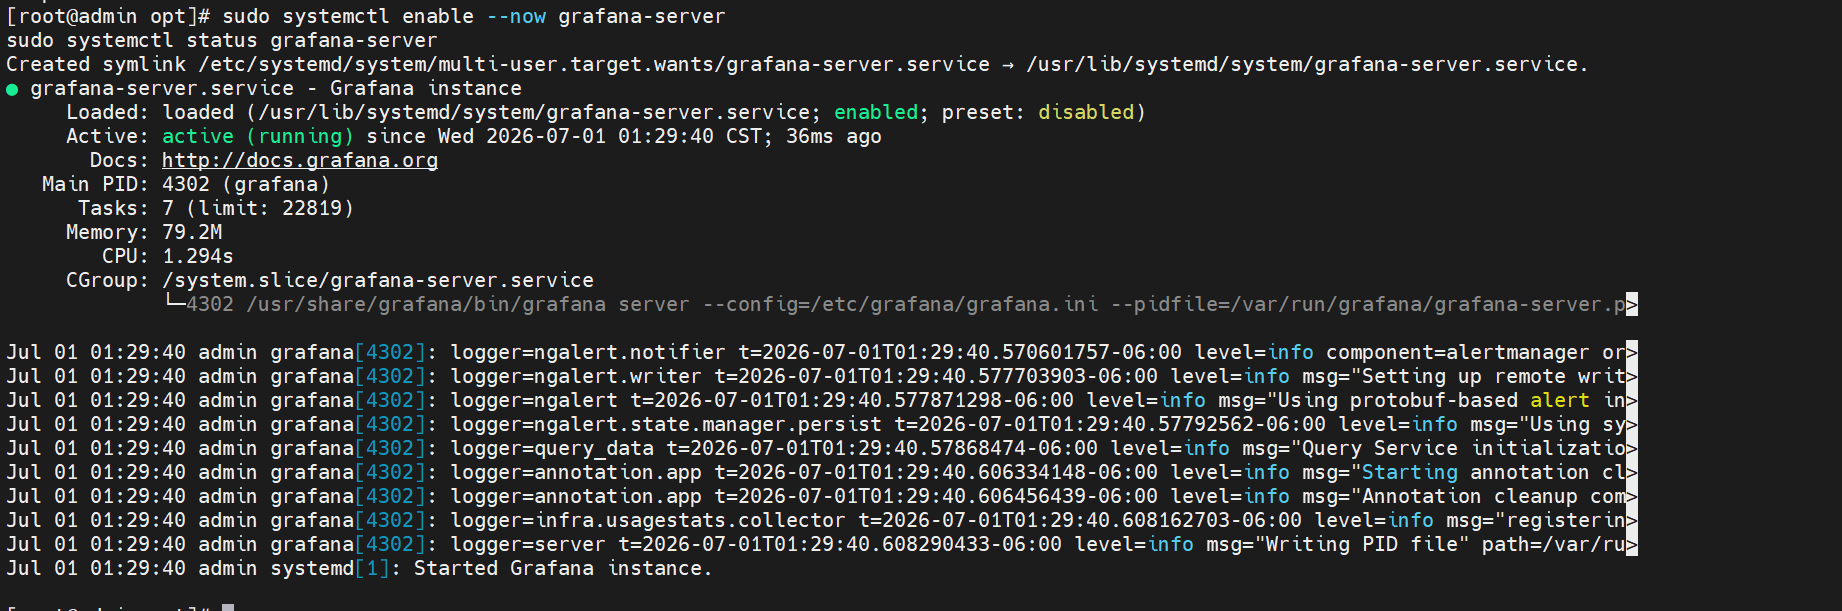
四、登录 Grafana
bash
浏览器访问:
http://服务器IP:3000
默认账号 / 密码:
admin
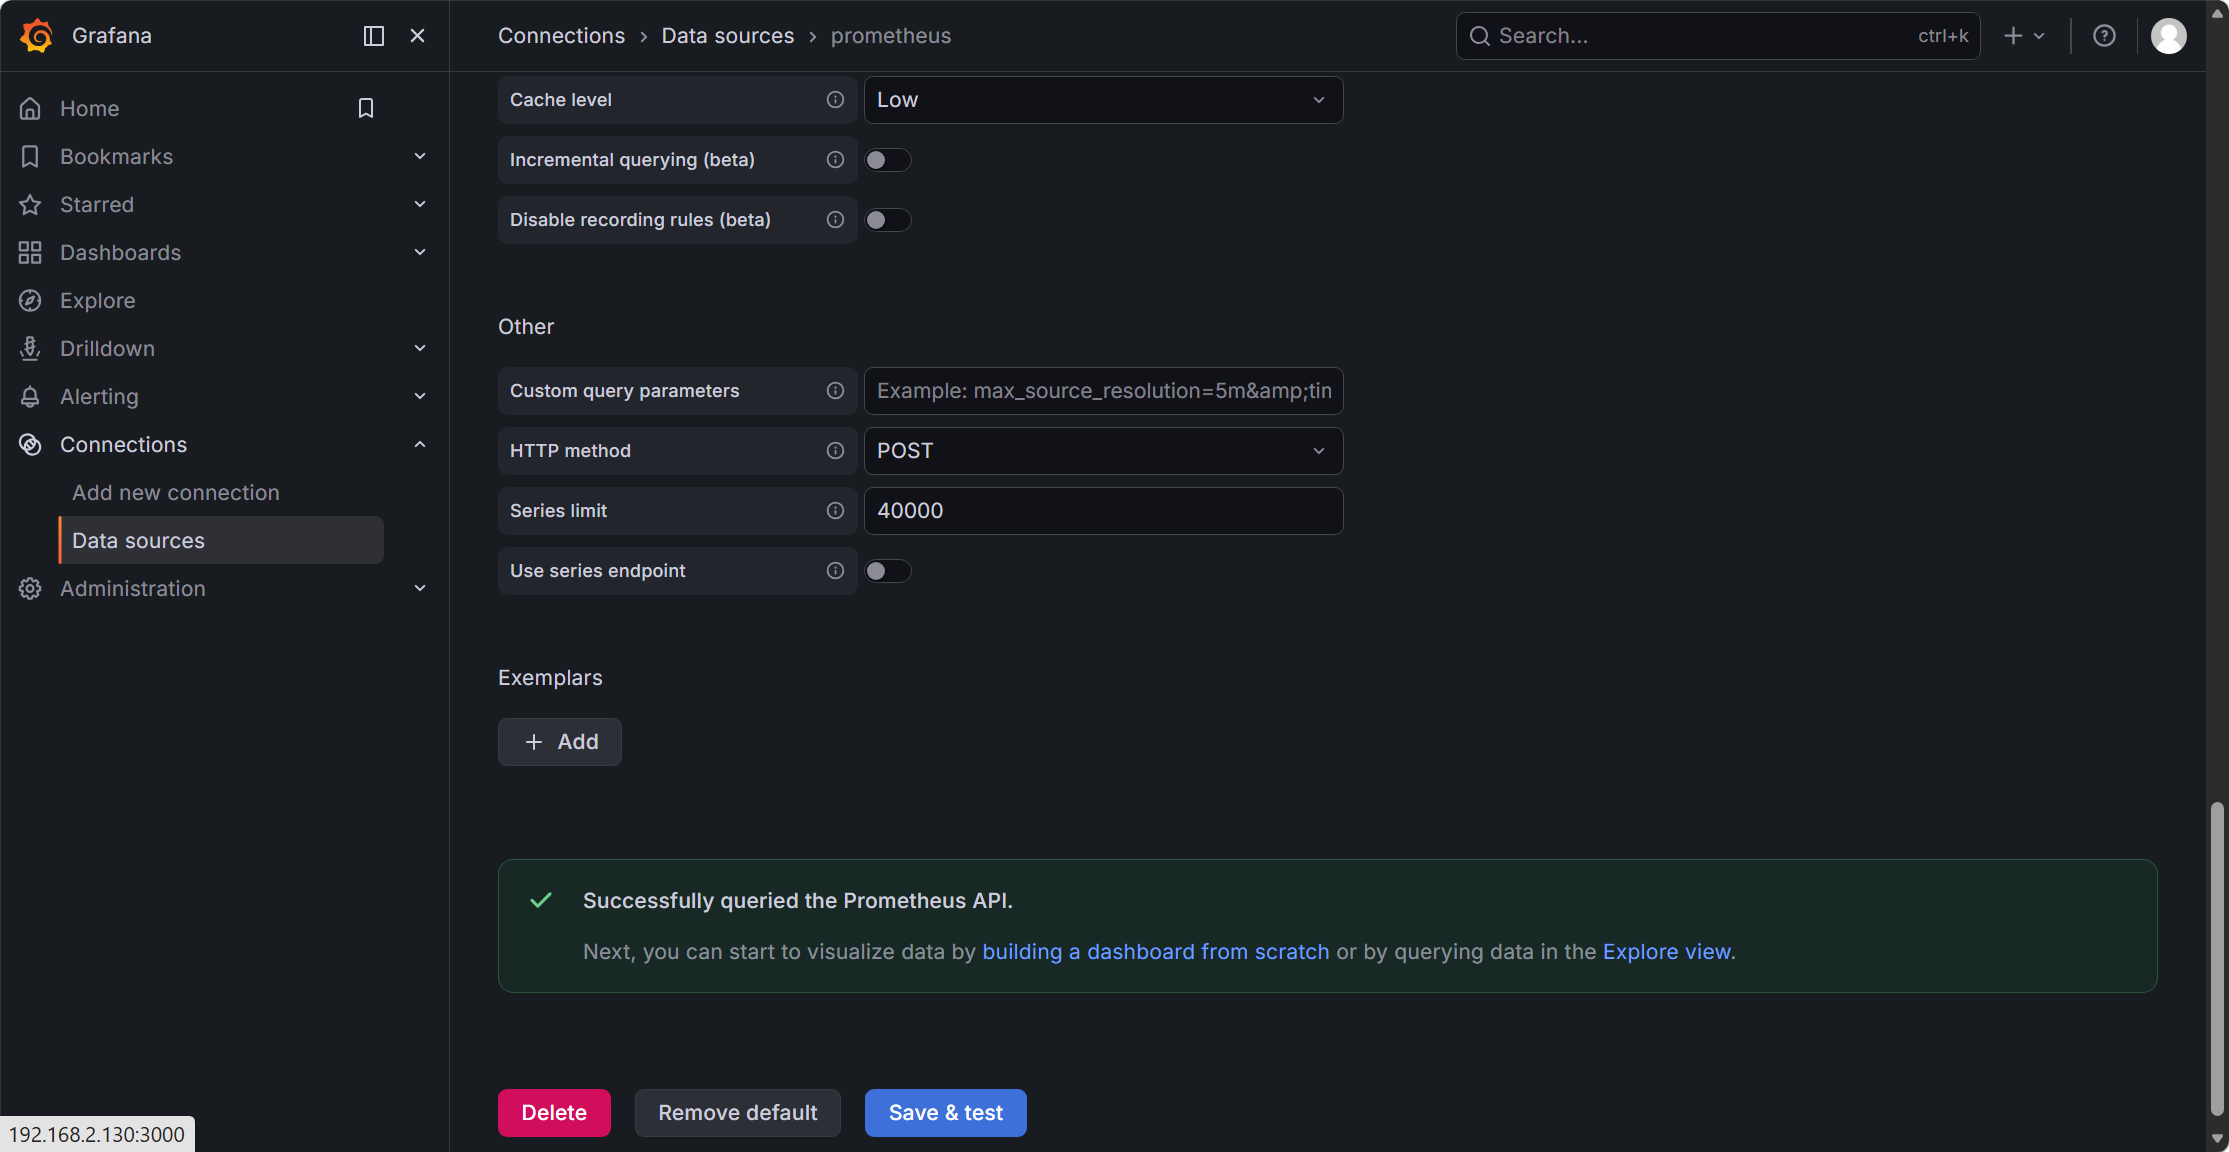
admin五、添加 Prometheus 数据源
- 左侧 ☰ → Connections → Data Source
- 点击 Add data source
- 选择 Prometheus
- URL 填写:
http://localhost:9090 - 点击 Save & Test
- ✅ 提示Successfully queried the Prometheus API.
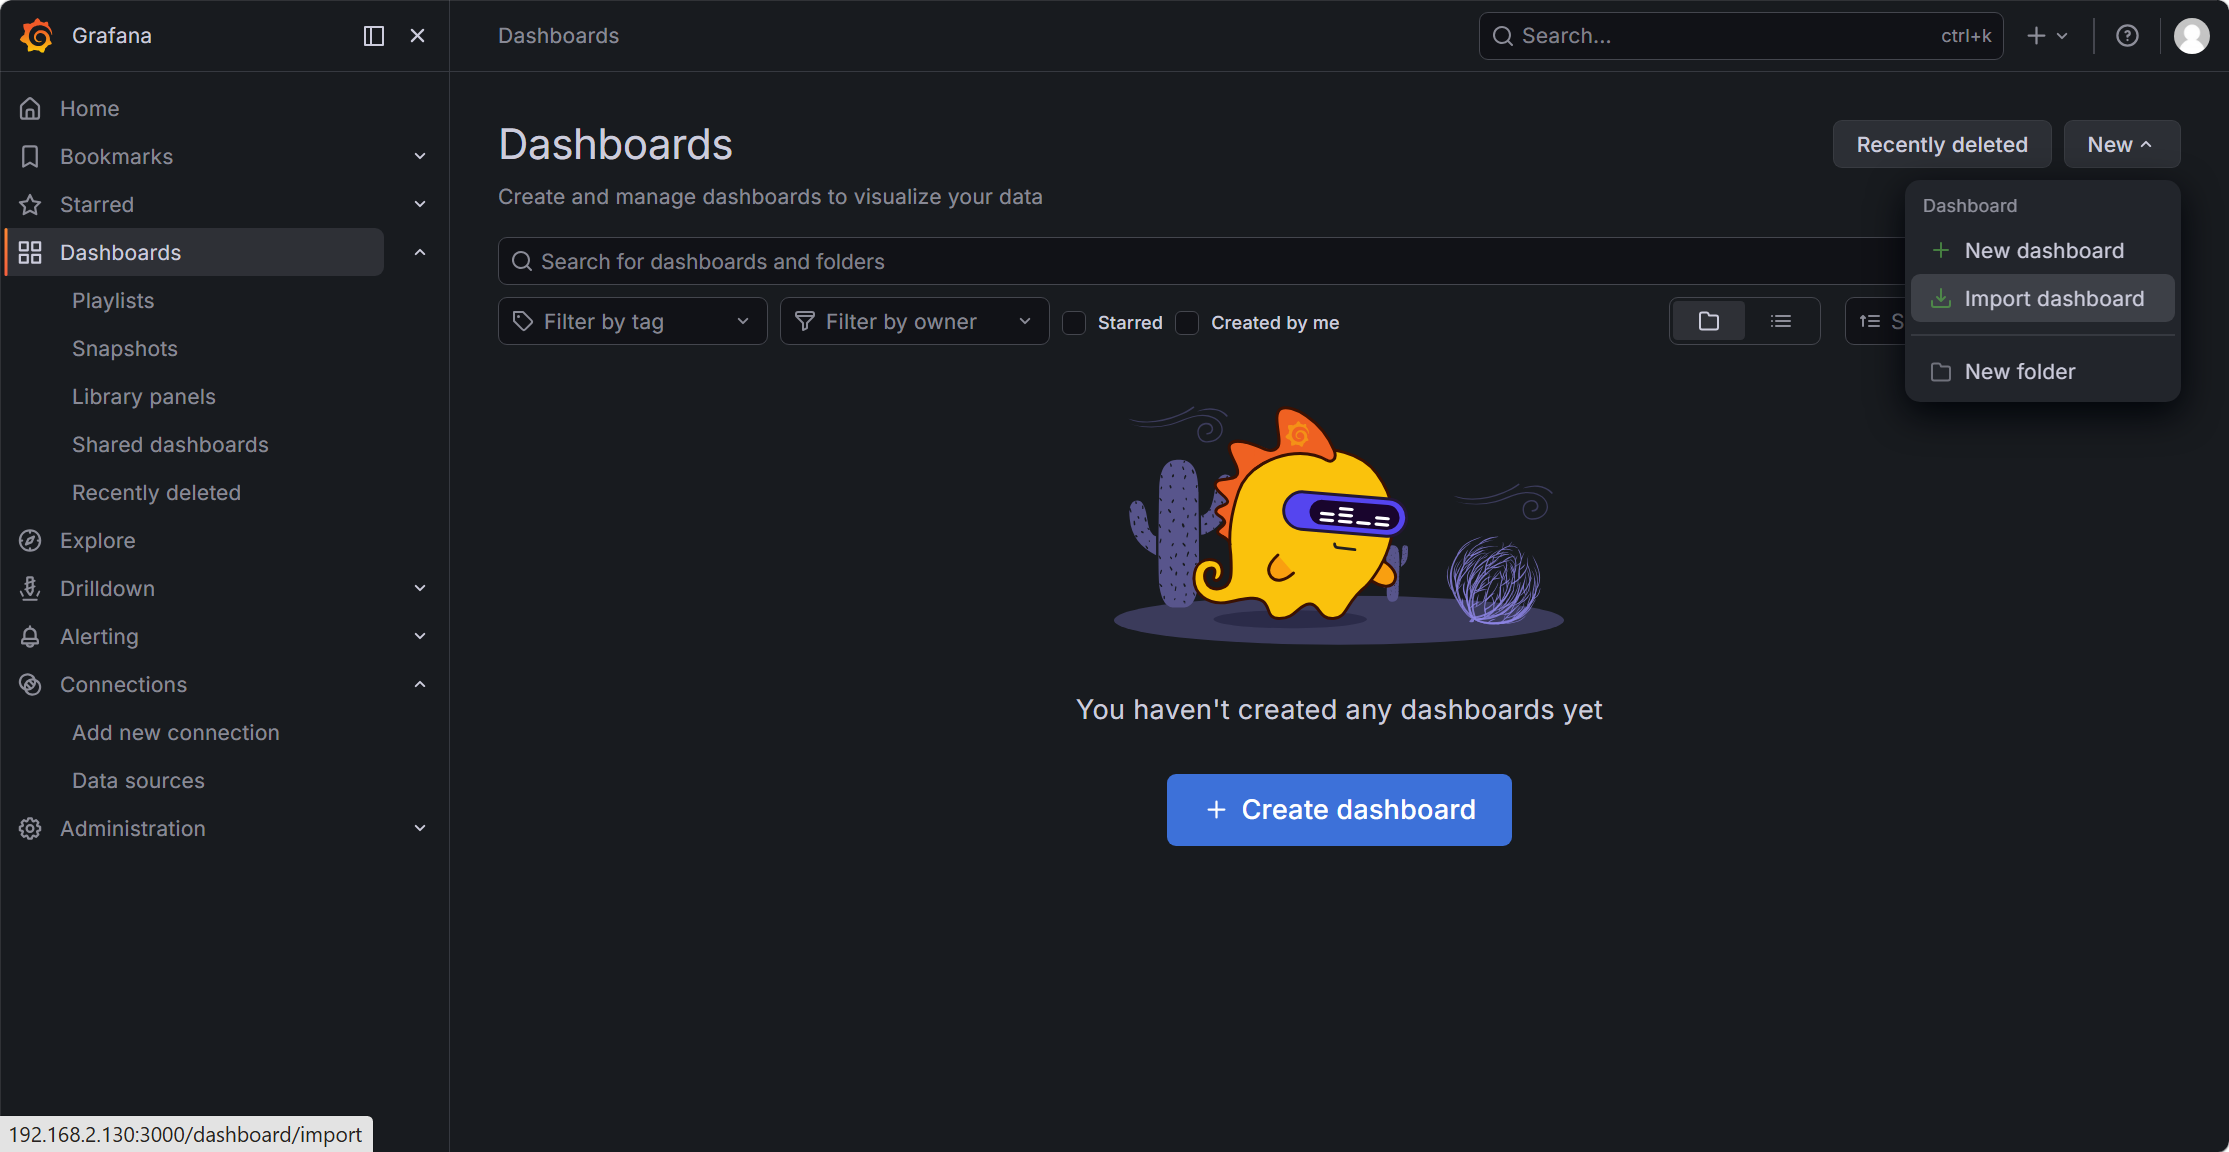
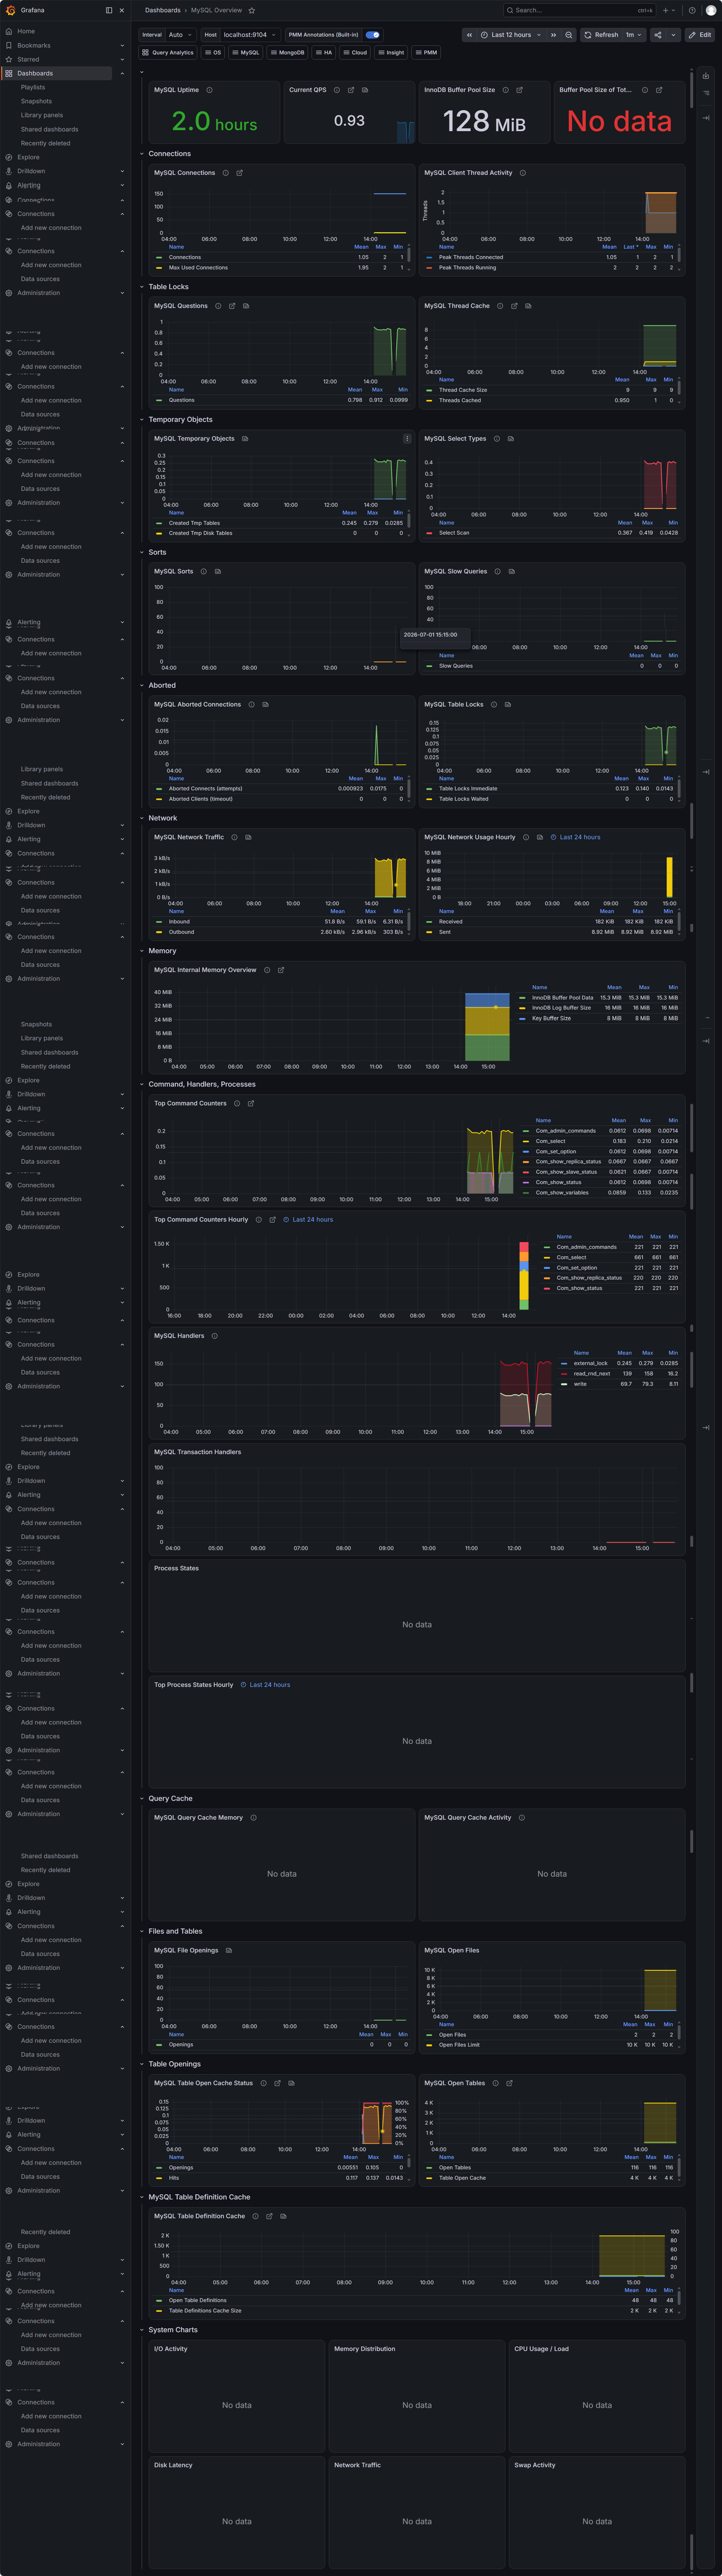
六、导入 MySQL 官方仪表盘
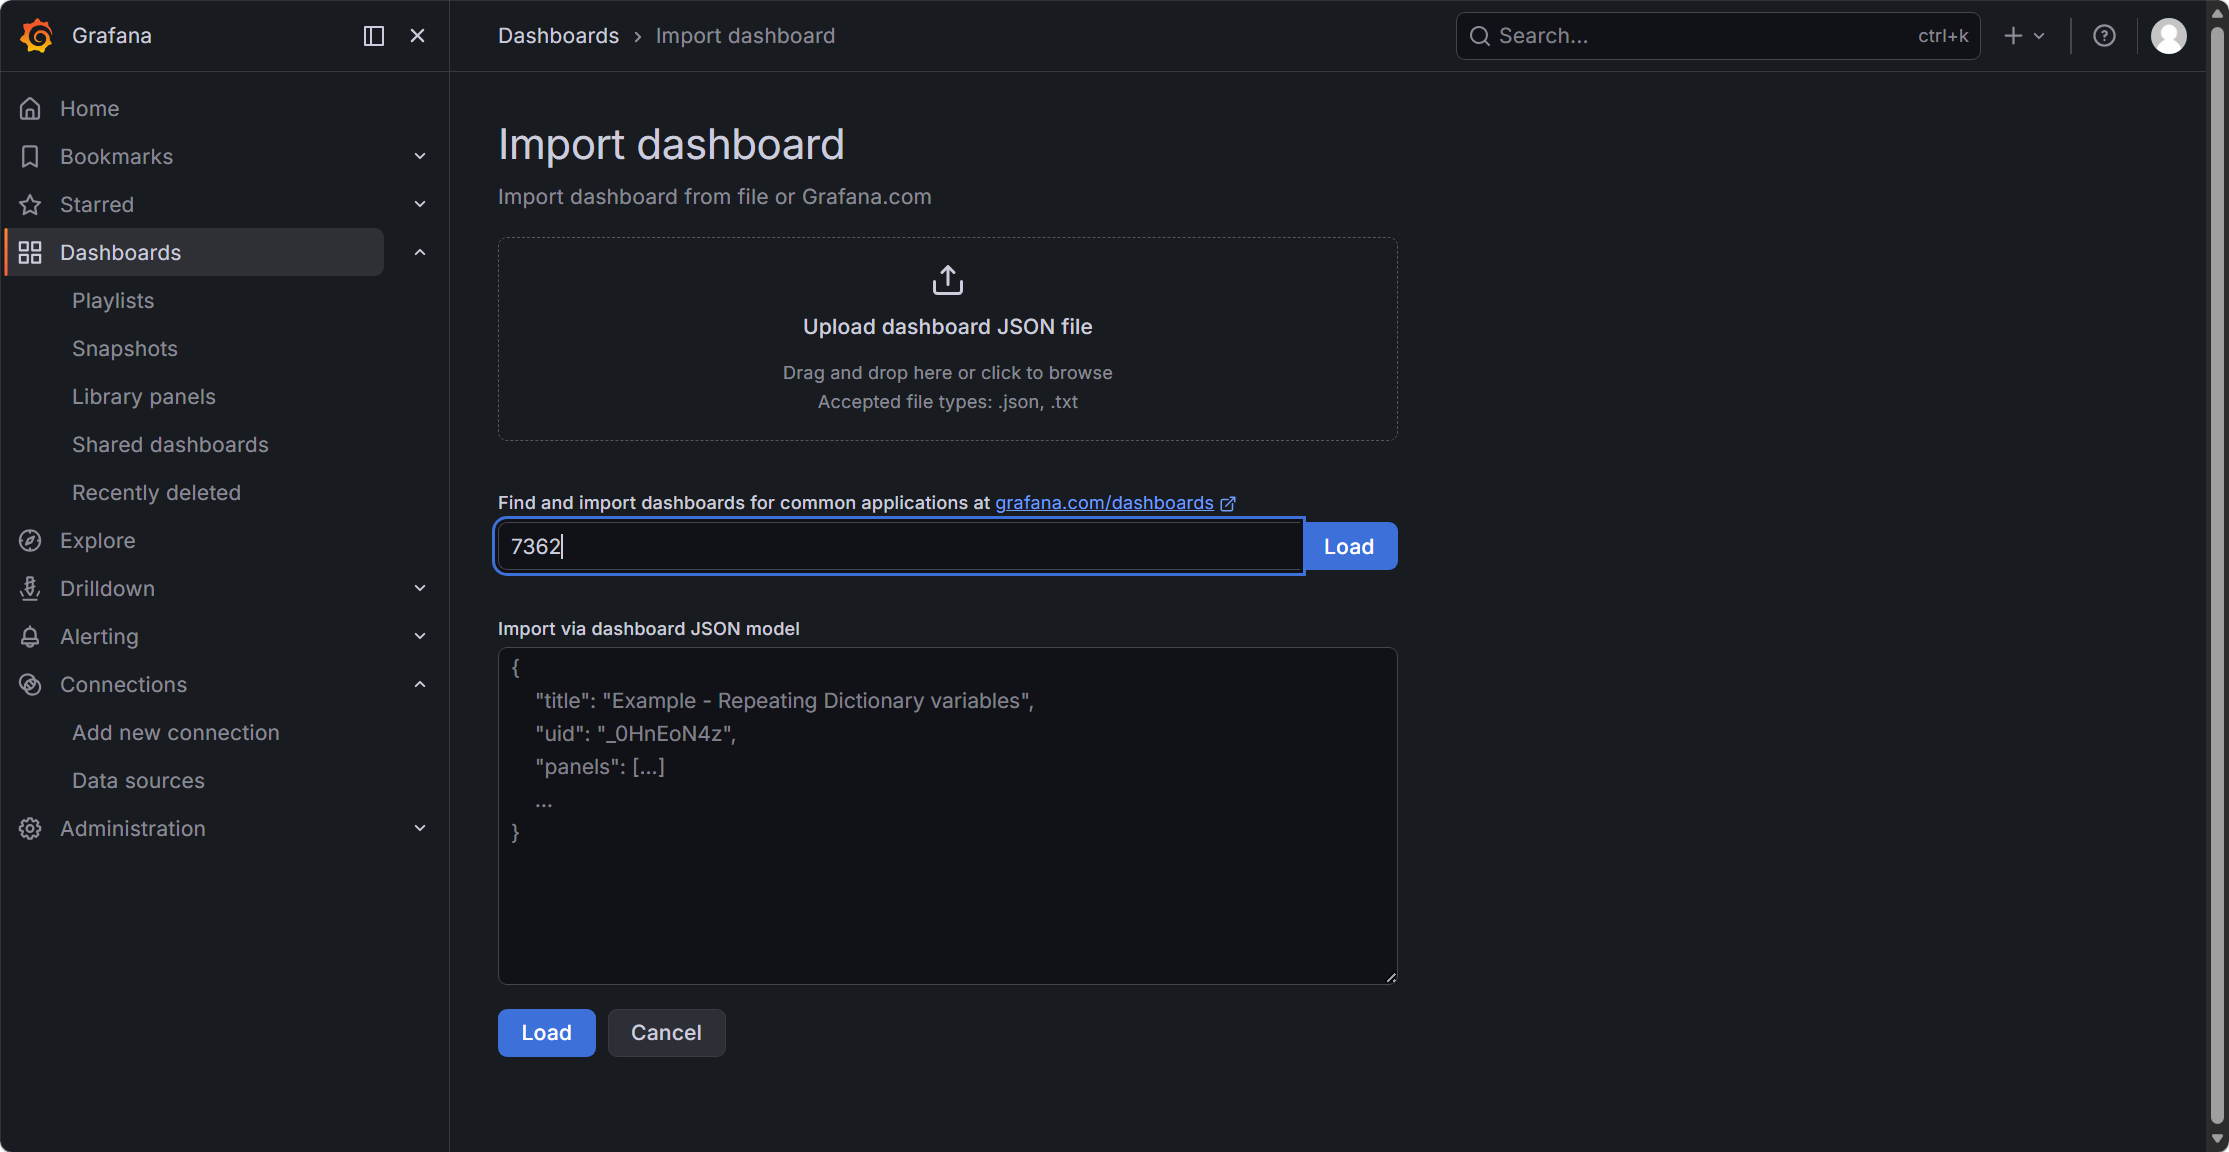
- 左侧 ☰ → Dashboards → New → Import
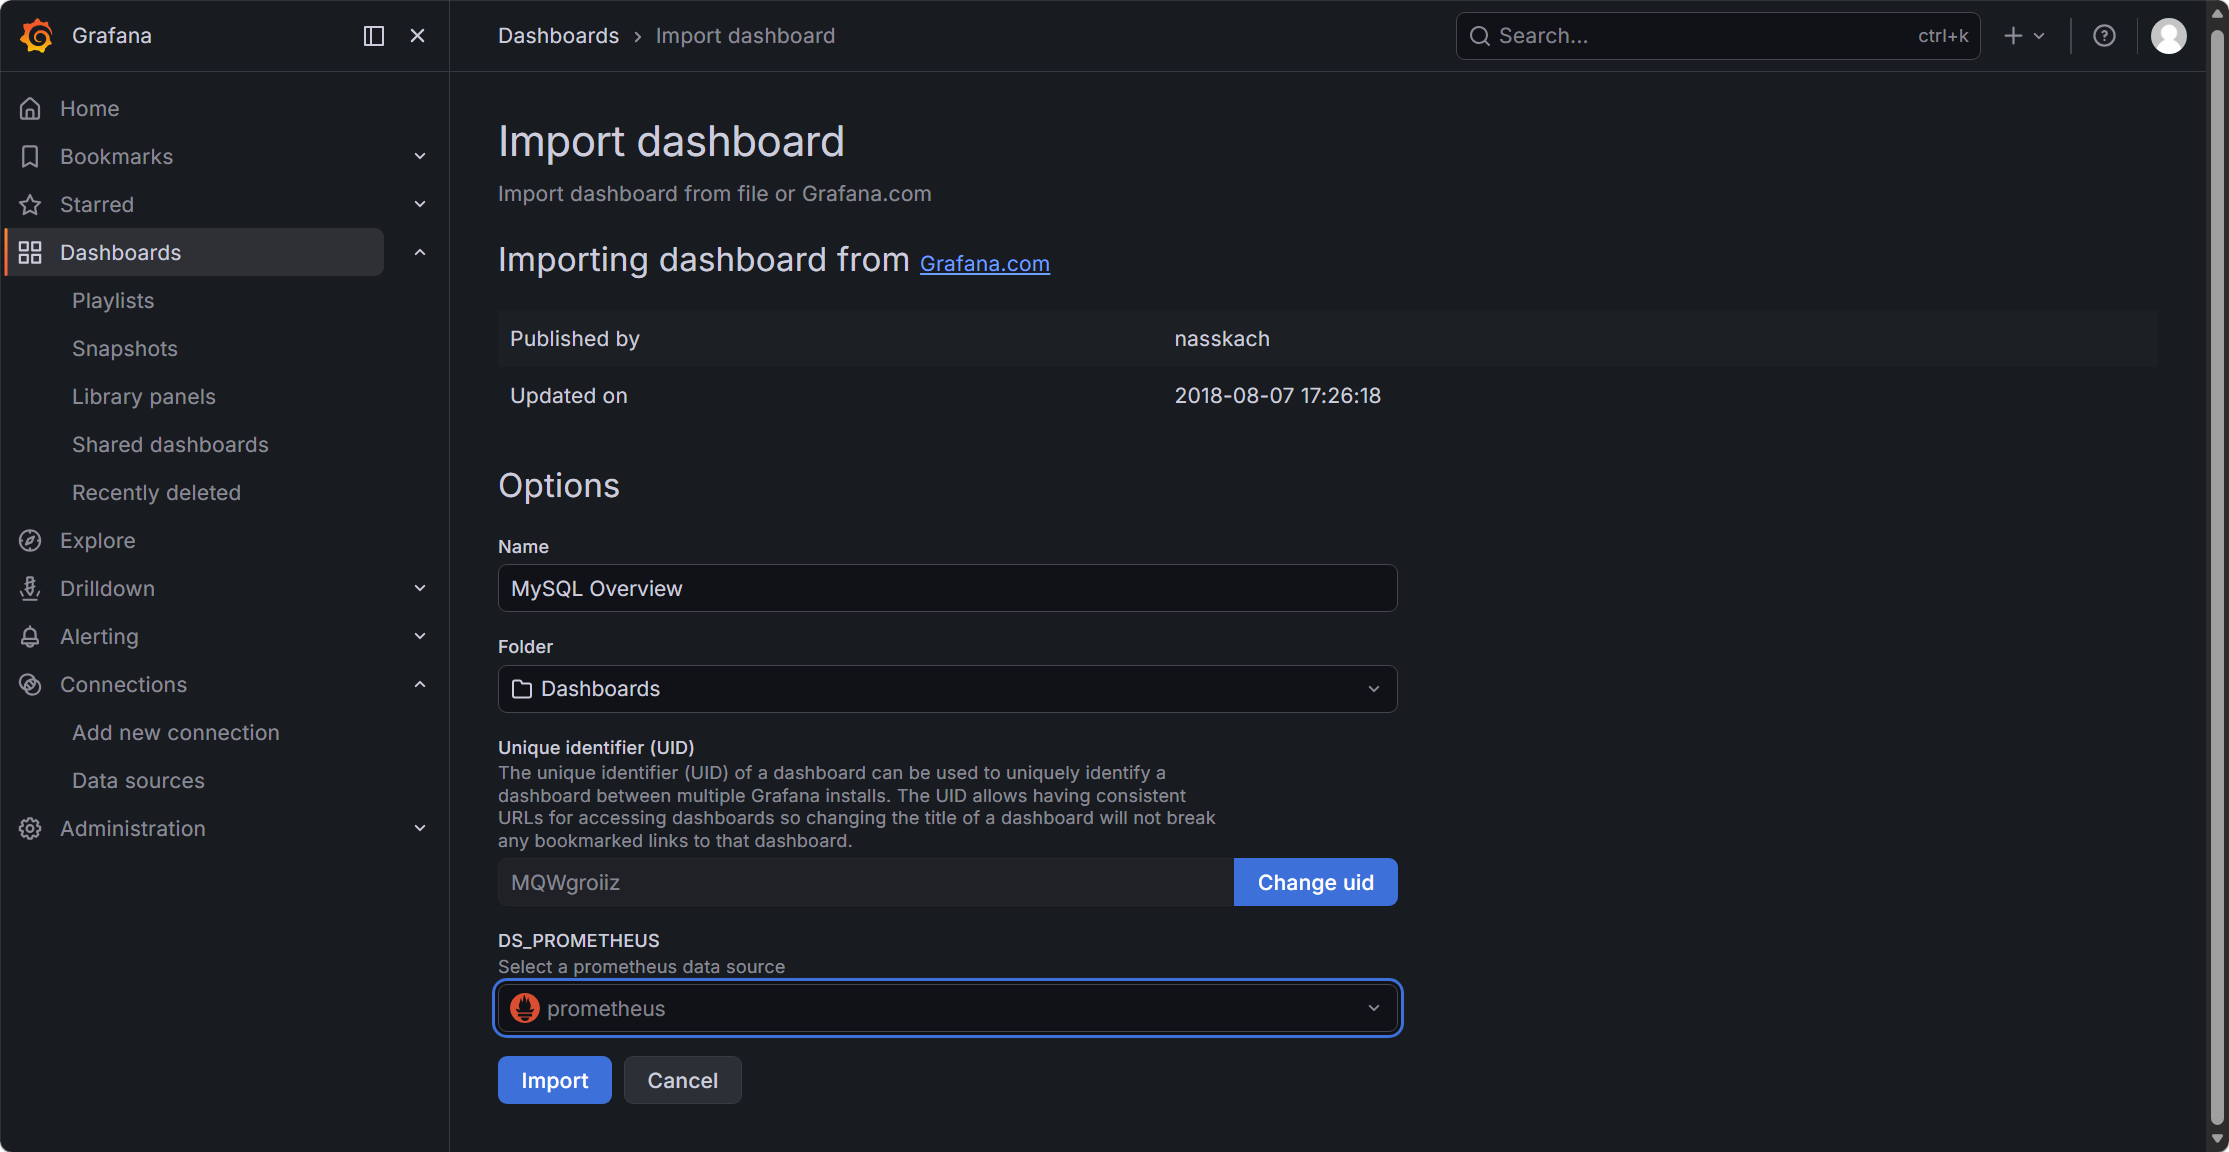
- Dashboard ID 输入:7362(Percona MySQL Overview)
- 点击 Load
- Prometheus 数据源选择你刚添加的 Prometheus
- 点击 Import
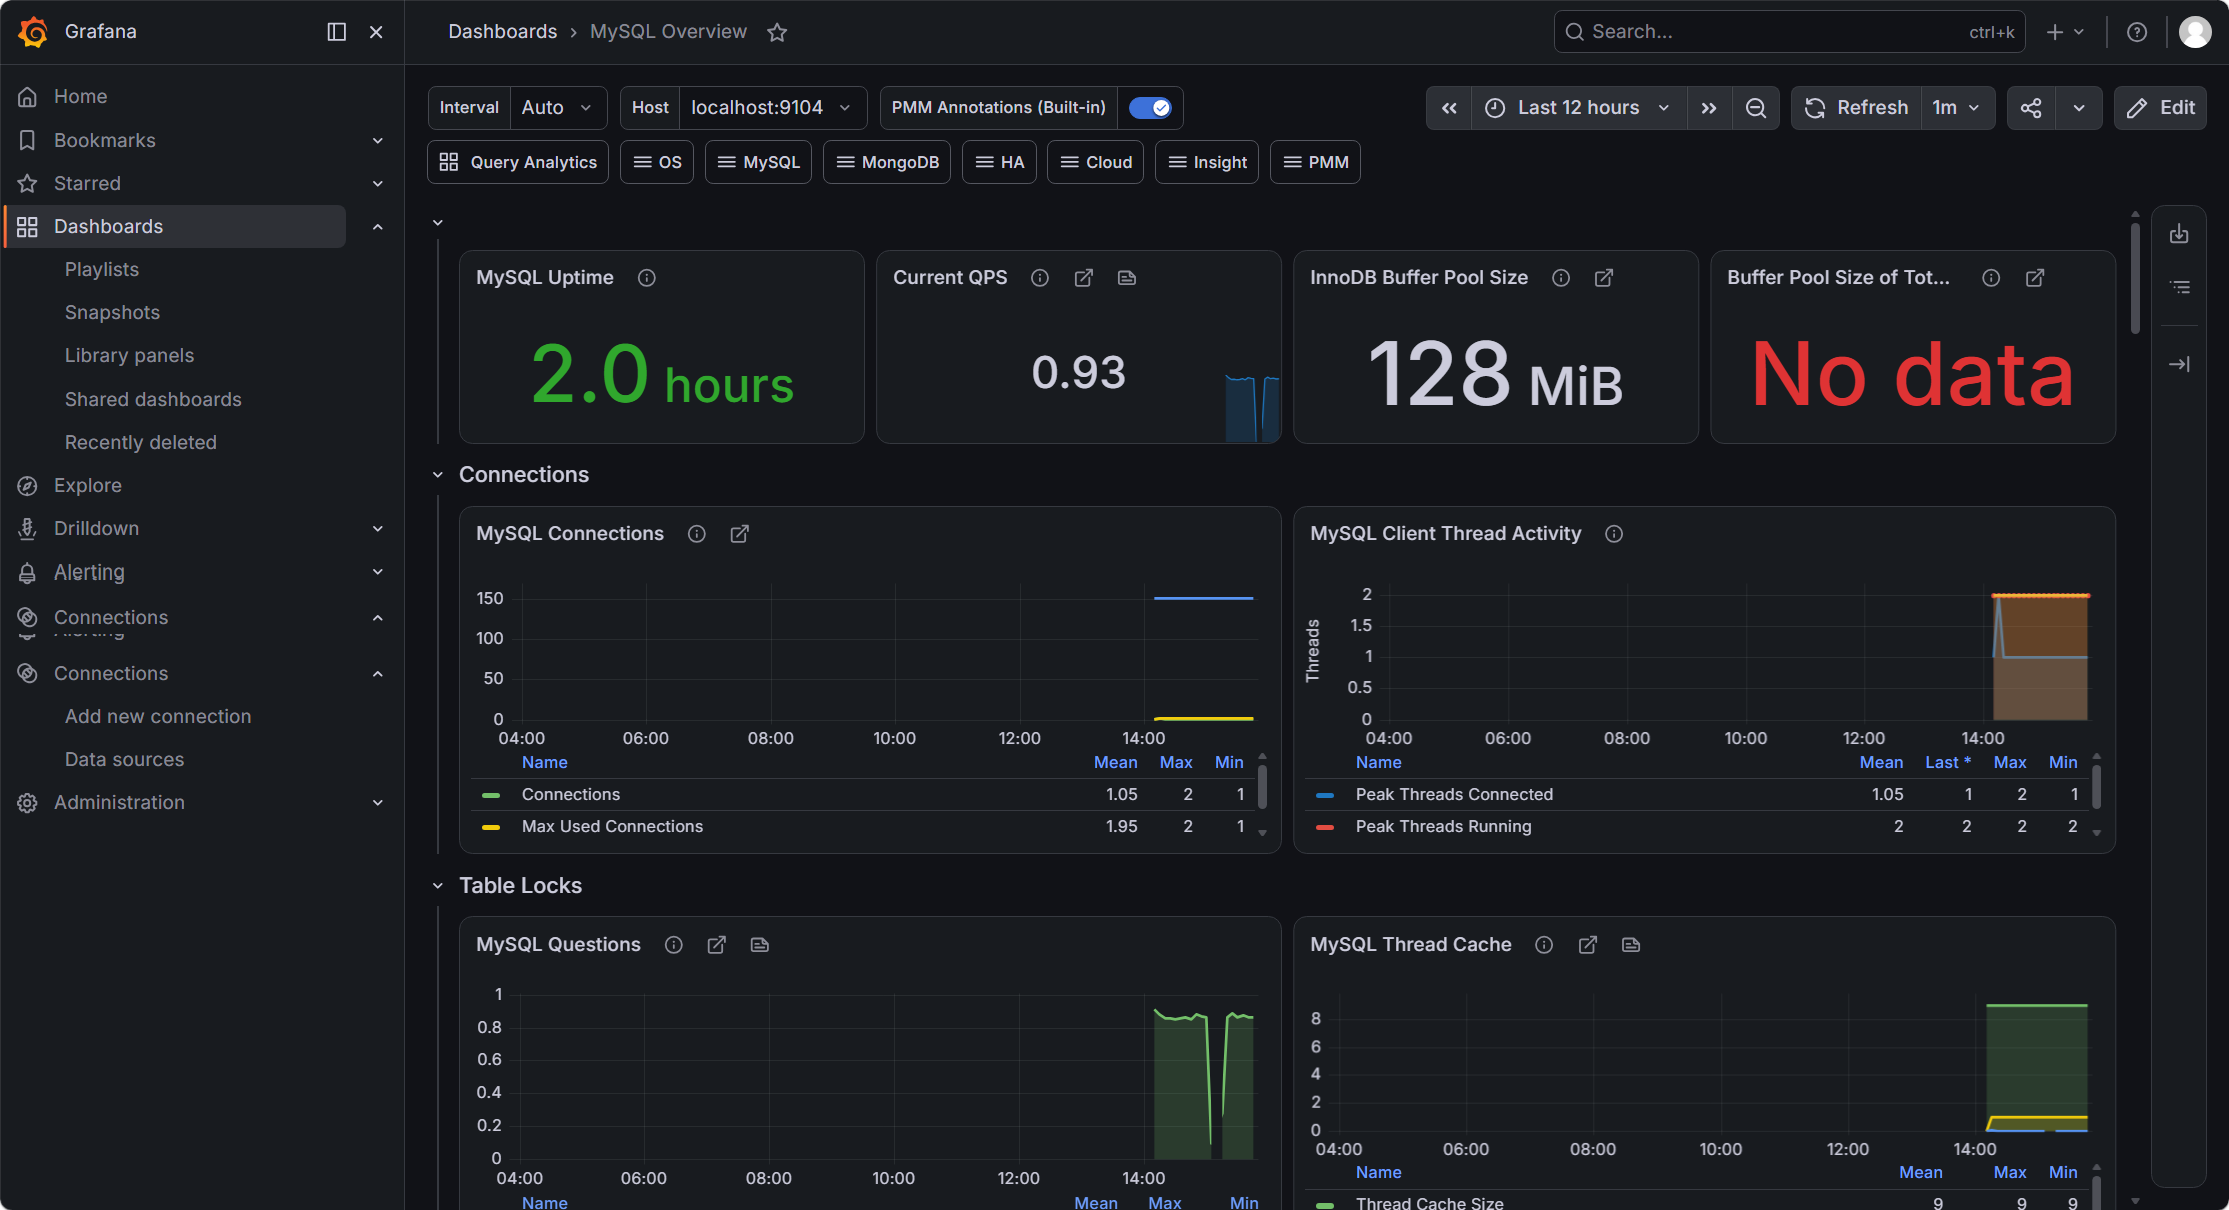
✅ 几秒后即可看到 MySQL QPS / 连接数 / InnoDB / 锁等待等图表