《乌兰察布市实时气象数据可视化大屏》------ 教师视角完整教程
面向对象 :本科 / 高职《大数据可视化》《前端工程化》课程教师与学生
预计课时 :12 学时(理论 4 + 实操 8)
技术栈 :React 19 + TypeScript 6 + Vite 8 + ECharts 6 + TailwindCSS 4 + Express 5
学完能做什么:从 0 搭建一个「真实数据接入 + 服务端定时推送 + 大屏可视化」的完整全栈项目,并理解其分层与数据流。
 ## 目录
## 目录
- [第 0 章 课程导读与项目全景](#第 0 章 课程导读与项目全景)
- [第 1 章 环境与工程脚手架](#第 1 章 环境与工程脚手架)
- [第 2 章 项目目录与配置](#第 2 章 项目目录与配置)
- [第 3 章 后端:Express 5 + 定时任务 + Open-Meteo 数据接入](#第 3 章 后端:Express 5 + 定时任务 + Open-Meteo 数据接入)
- [第 4 章 后端:SSE 实时推送总线](#第 4 章 后端:SSE 实时推送总线)
- [第 5 章 前端:React 19 + Vite 8 + TailwindCSS 4 骨架](#第 5 章 前端:React 19 + Vite 8 + TailwindCSS 4 骨架)
- [第 6 章 前端:主题样式与深色科技设计系统](#第 6 章 前端:主题样式与深色科技设计系统)
- [第 7 章 前端:React 19 Context + SSE 数据订阅](#第 7 章 前端:React 19 Context + SSE 数据订阅)
- [第 8 章 前端:ECharts 6 可视化组件开发](#第 8 章 前端:ECharts 6 可视化组件开发)
- [第 9 章 前端:页面拼装与三栏布局](#第 9 章 前端:页面拼装与三栏布局)
- [第 10 章 启动、调试与常见问题](#第 10 章 启动、调试与常见问题)
- [附录 A:完整文件清单](#附录 A:完整文件清单)
第 0 章 课程导读与项目全景
0.1 我们要做什么
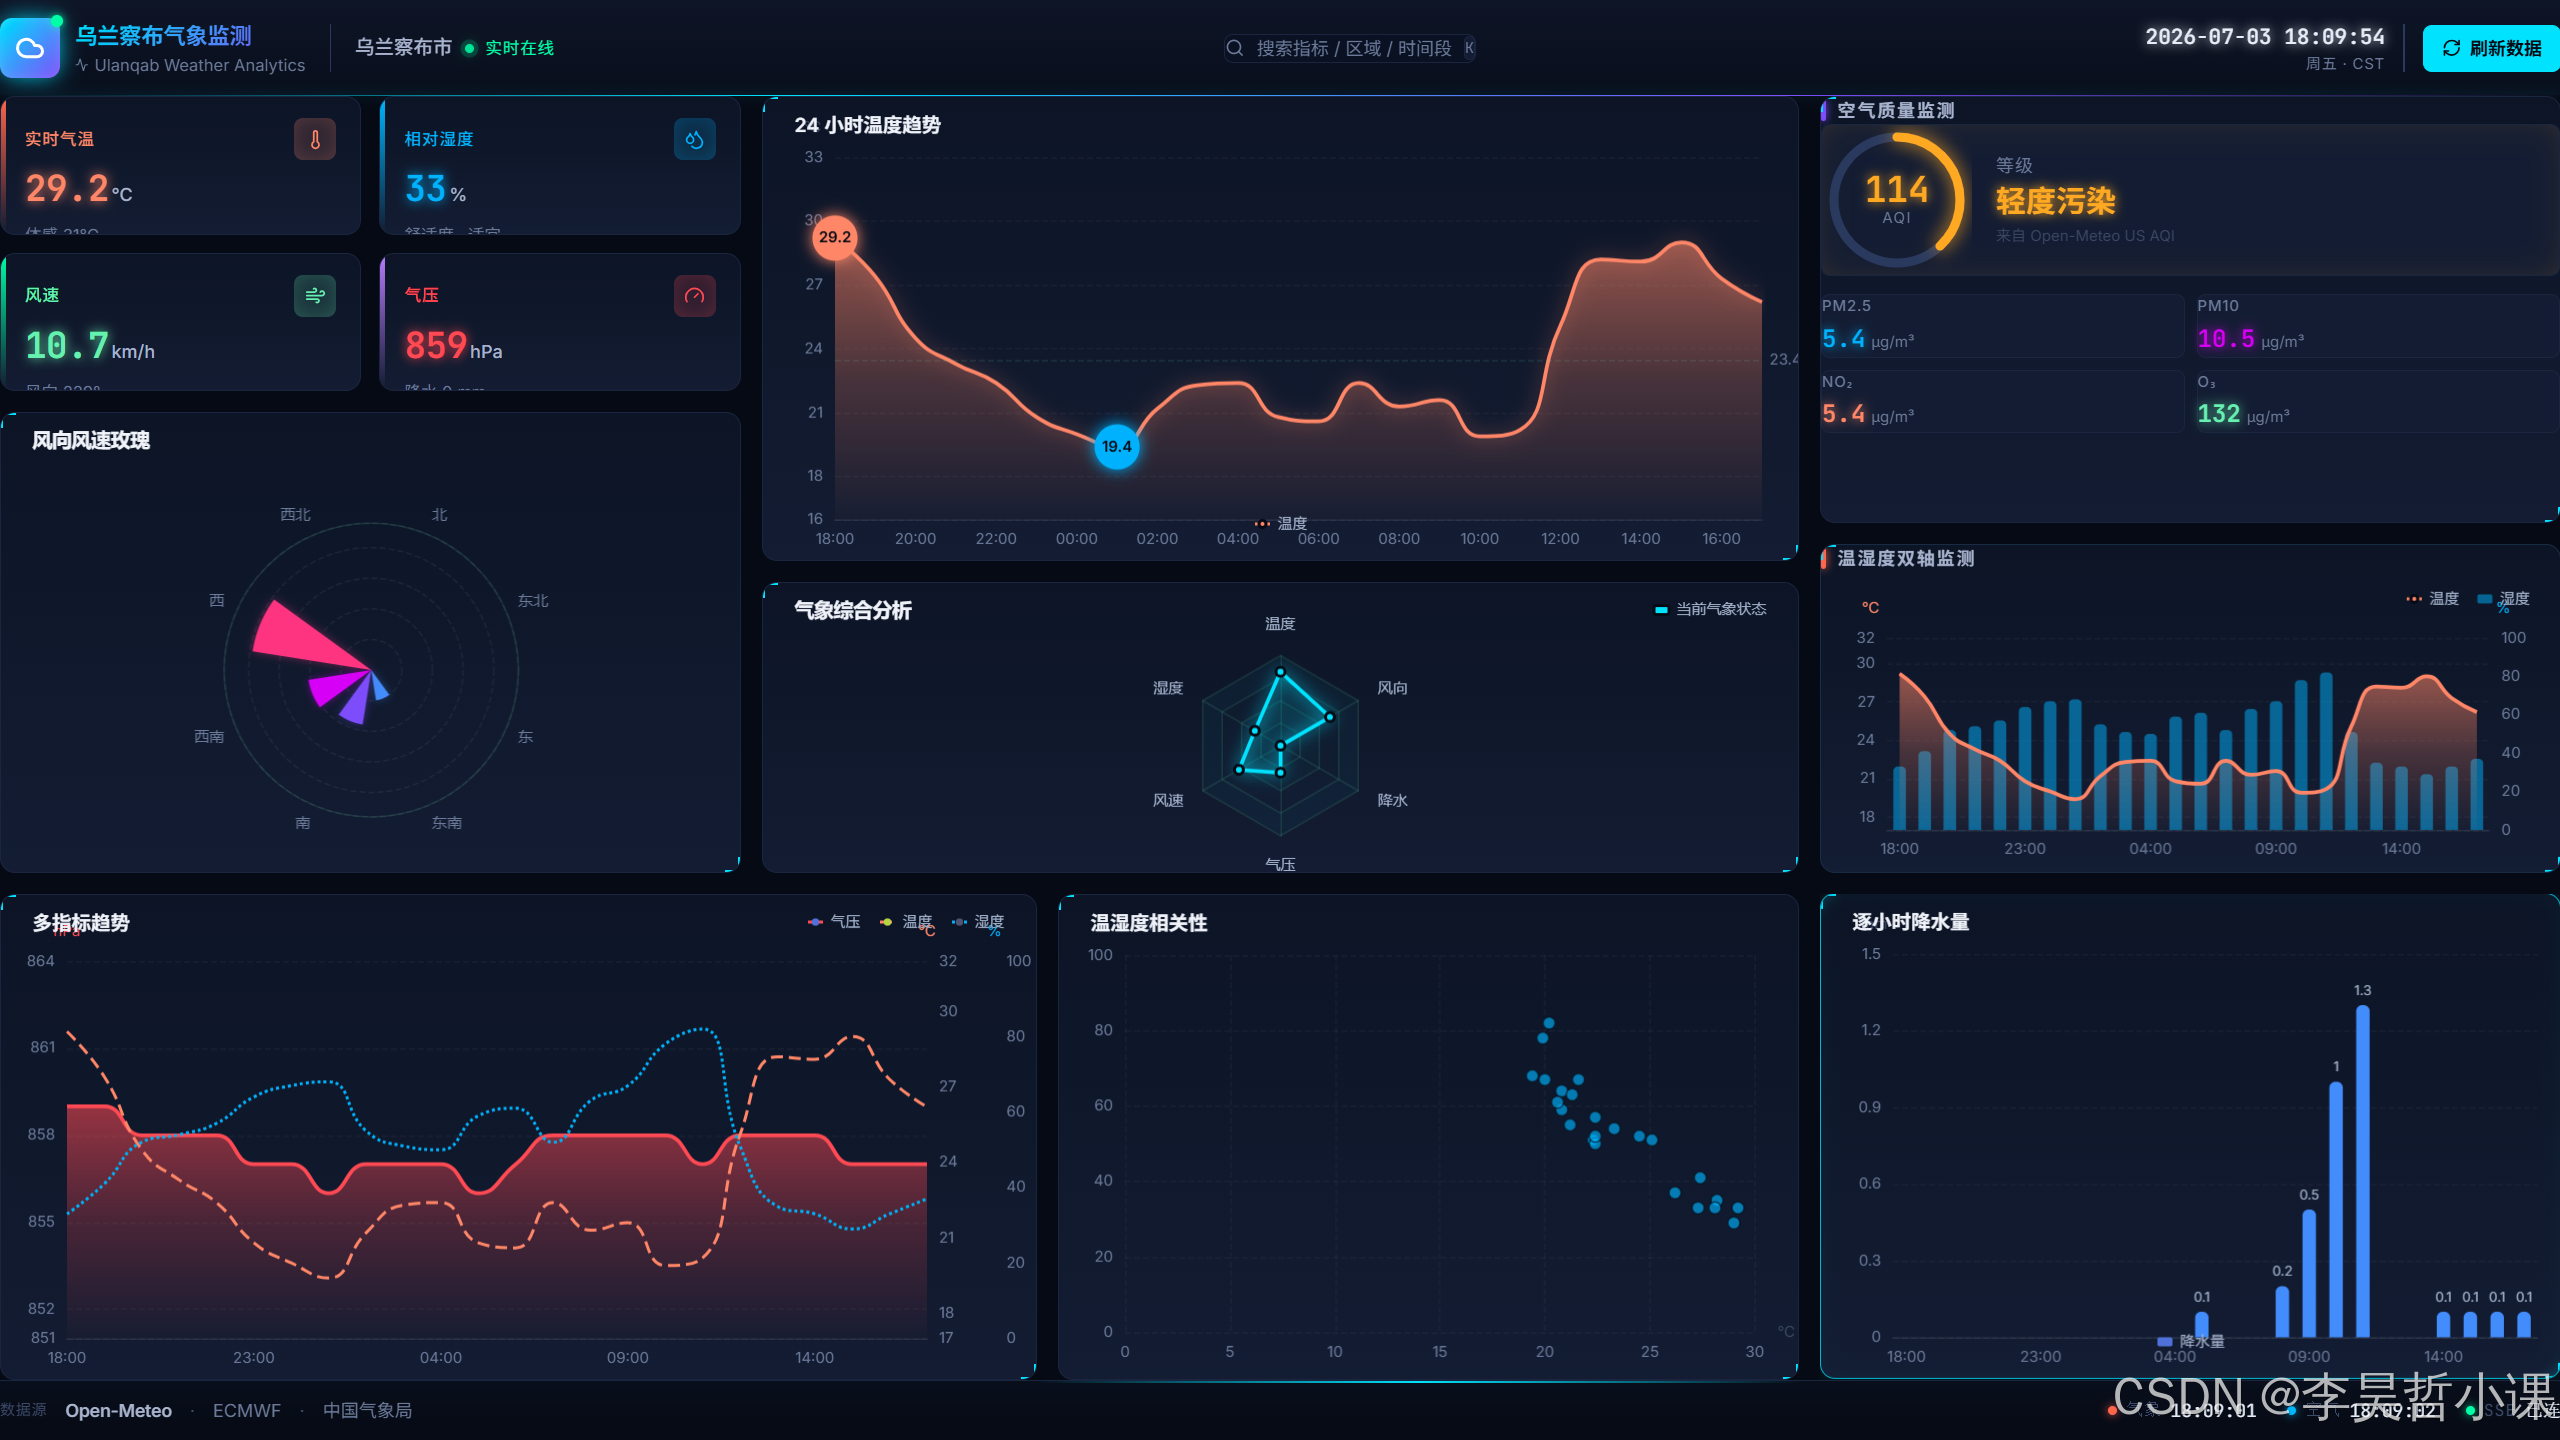
为乌兰察布市(坐标 N 40.9945° / E 113.1322° )做一个 实时气象数据可视化大屏,运行后效果类似「指挥中心监控屏」:
- 顶部居中标题 + 实时时钟,左右两侧状态指示;
- 左栏:实时指标卡片(气温 / 湿度 / 风速 / 气压)+ 风向玫瑰图;
- 中栏:温度趋势线(上)+ 气象综合雷达图(下);
- 右栏:空气质量监测面板(上)+ 温湿度双轴图(下);
- 底部通栏:气压多指标趋势(左)+ 温湿度散点图(中)+ 逐小时降水量(右);
- 底部信息栏:地理位置、数据来源、各数据源更新时间。
0.2 数据从哪里来
完全使用 Open-Meteo 的两个免费、无需 Key 的开放 REST 接口:
| 用途 | 地址 |
|---|---|
| 气象(实时 + 24h 预报) | https://api.open-meteo.com/v1/forecast |
| 空气质量 | https://air-quality-api.open-meteo.com/v1/air-quality |
Open-Meteo 数据聚合自 ECMWF、NOAA、中国气象局等机构,可直接用于教学。
0.3 整体架构
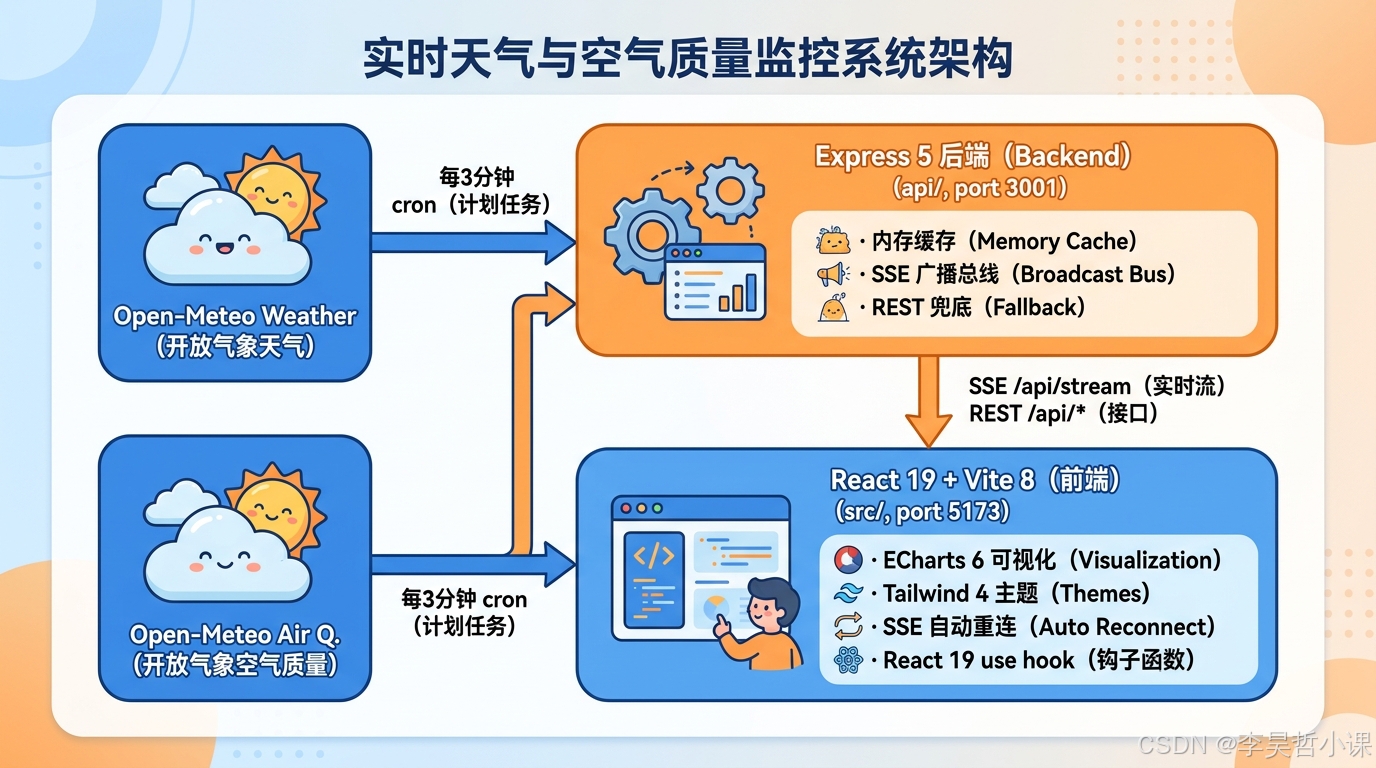
0.4 关键技术点(一句话版)
- Express 5 + node-cron:后端定时拉数据(Express 5 支持 async handler)。
- SSE (Server-Sent Events):服务端主动推送,比轮询省延迟。
- React 19 + Vite 8 :组件化前端 + 极速 HMR +
use()hook。 - ECharts 6 + 自定义 ChartCanvas:数据可视化(不依赖 echarts-for-react)。
- TailwindCSS 4 + CSS 变量:深色科技风设计系统。
- React 19 Context + use():统一数据管理(替代多个独立 hooks)。
第 1 章 环境与工程脚手架
1.1 环境要求
| 工具 | 最低版本 | 验证命令 |
|---|---|---|
| Node.js | ≥ 20 | node -v |
| npm | ≥ 10 | npm -v |
| 浏览器 | Chrome / Edge / Firefox 最新版 | --- |
1.2 创建项目目录
bash
mkdir wulanchabu-weather-dashboard
cd wulanchabu-weather-dashboard
1.3 用 Vite 初始化前端(React + TypeScript)
教学提示:执行命令时全部用
-- --template react-ts,避免交互卡住。
bash
npm create vite@latest . -- --template react-ts按提示确认覆盖当前目录即可。生成结构里我们只需要保留 index.html 与 src/,其余脚手架自带文件可保留作为参考。
1.4 安装后端依赖
bash
npm install express cors dotenv node-cron axios
npm install -D nodemon tsx concurrently @types/node @types/express @types/cors
1.5 安装前端可视化与样式依赖
bash
npm install echarts axios lucide-react clsx tailwind-merge
npm install -D tailwindcss@^4 @tailwindcss/vite vite-tsconfig-paths
课堂提问:为什么不用
echarts-for-react?答:
echarts-for-react与 ECharts 6 不兼容(ECharts 6 重构了模块导出)。我们手写一个更轻量的ChartCanvas组件,还能学习 ResizeObserver 和 ECharts 6 的 tree-shaking 机制。
1.6 最终 package.json 关键片段
json
{
  "name": "wulanchabu-weather-dashboard",
  "private": true,
  "version": "0.0.0",
  "type": "module",
  "scripts": {
    "client:dev": "vite --port 5173 --strictPort --host 127.0.0.1",
    "build": "tsc -b && vite build",
    "lint": "eslint .",
    "preview": "vite preview",
    "check": "tsc --noEmit",
    "server:dev": "nodemon",
    "dev": "concurrently \"npm run client:dev\" \"npm run server:dev\""
  },
  "dependencies": {
    "@tailwindcss/vite": "^4.3.2",
    "axios": "^1.18.1",
    "clsx": "^2.1.1",
    "cors": "^2.8.6",
    "dotenv": "^17.4.2",
    "echarts": "^6.1.0",
    "express": "^5.2.1",
    "lucide-react": "^1.23.0",
    "node-cron": "^4.5.0",
    "react": "^19.2.7",
    "react-dom": "^19.2.7",
    "tailwind-merge": "^3.6.0"
  },
  "devDependencies": {
    "@eslint/js": "^10.0.1",
    "@types/cors": "^2.8.19",
    "@types/express": "^5.0.6",
    "@types/node": "^26.1.0",
    "@types/node-cron": "^3.0.11",
    "@types/react": "^19.2.17",
    "@types/react-dom": "^19.2.3",
    "@vercel/node": "^5.8.22",
    "@vitejs/plugin-react": "^6.0.3",
    "concurrently": "^10.0.3",
    "eslint": "^10.6.0",
    "eslint-plugin-react-hooks": "^7.1.1",
    "eslint-plugin-react-refresh": "^0.5.3",
    "nodemon": "^3.1.14",
    "tsx": "^4.22.5",
    "typescript": "~6.0.3",
    "typescript-eslint": "^8.62.1",
    "vite": "^8.1.3"
  }
}
课堂提问:为什么用
concurrently?答:让前端 Vite(5173)和后端 nodemon(3001)在同一条命令里并行启动,避免开两个终端。
1.7 安装并验证
bash
npm install
npm run dev
如果浏览器弹出 5173 端口和 Node 3001 端口均就绪,说明脚手架完成。
第 2 章 项目目录与配置
2.1 目录约定
.
├── api/                       # 后端(Node + Express 5 + TS)
│   ├── server.ts              # 本地启动入口
│   ├── app.ts                 # Express 应用工厂
│   ├── index.ts               # Vercel Serverless 入口
│   ├── routes/
│   │   ├── weather.ts
│   │   ├── airQuality.ts
│   │   └── auth.ts            # 教学扩展用
│   ├── services/
│   │   ├── weatherService.ts
│   │   └── airQualityService.ts
│   └── sse/
│       └── broadcaster.ts
├── src/                       # 前端(React 19 + TS)
│   ├── main.tsx
│   ├── App.tsx
│   ├── index.css
│   ├── components/
│   │   ├── Header/
│   │   ├── Footer/
│   │   ├── WeatherCards/
│   │   ├── AirQualityPanel/   # 新增:空气质量面板
│   │   ├── EChartsWrapper/    # 新增:自定义 ECharts 6 包装
│   │   │   └── ChartCanvas.tsx
│   │   ├── TemperatureChart/
│   │   ├── PrecipitationChart/
│   │   ├── TempHumidCombo/
│   │   ├── PressureChart/
│   │   ├── ScatterChart/
│   │   ├── RadarChart/
│   │   └── WindRoseChart/
│   ├── context/               # 新增:统一数据管理
│   │   └── DataContext.tsx
│   ├── lib/
│   │   ├── useSse.ts          # 保留:通用 SSE hook(备用)
│   │   ├── chartTheme.ts      # 新增:ECharts 6 主题
│   │   └── utils.ts
│   └── pages/
│       └── Home.tsx
├── index.html
├── package.json
├── vite.config.ts
├── tsconfig.json
├── eslint.config.js           # ESLint 9 flat config
└── nodemon.json
教学说明:相比旧教程,我们移除了
hooks/目录(改用 Context),新增了context/和EChartsWrapper/。
2.2 tsconfig.json
要点:
module: ESNext、moduleResolution: bundler:让 TS 与 Vite 兼容;paths: { "@/*": ["./src/*"] }:让前端用@/...简化导入;include: ["src", "api"]:后端 TS 与前端共用同一 tsconfig。
json
{
  "compilerOptions": {
    "target": "ES2022",
    "useDefineForClassFields": true,
    "lib": ["ES2022", "DOM", "DOM.Iterable"],
    "module": "ESNext",
    "skipLibCheck": true,
    "moduleResolution": "bundler",
    "allowImportingTsExtensions": true,
    "moduleDetection": "force",
    "noEmit": true,
    "jsx": "react-jsx",
    "strict": true,
    "noUnusedLocals": true,
    "noUnusedParameters": true,
    "noFallthroughCasesInSwitch": true,
    "baseUrl": "./",
    "paths": { "@/*": ["./src/*"] },
    "types": ["node", "express"]
  },
  "include": ["src", "api"]
}
2.3 nodemon.json
json
{
  "watch": ["api"],
  "ext": "ts,mts,js,json",
  "ignore": ["api/dist/*"],
  "exec": "tsx api/server.ts",
  "env": { "NODE_ENV": "development" },
  "delay": 1000
}
课堂提问:为什么是
tsx而不是ts-node?答:
tsx基于 esbuild,启动速度比 ts-node 快一个数量级,适合教学演示。
2.4 vite.config.ts
把 /api 反向代理到后端 3001,前端就只需要写 /api/...:
ts
import { defineConfig } from 'vite'
import react from '@vitejs/plugin-react'
import tailwindcss from '@tailwindcss/vite'
import tsconfigPaths from "vite-tsconfig-paths"

export default defineConfig({
  plugins: [react(), tailwindcss(), tsconfigPaths()],
  server: {
    proxy: {
      '/api': {
        target: 'http://localhost:3001',
        changeOrigin: true,
        secure: false,
      }
    }
  }
})
教学说明:TailwindCSS 4 使用
@tailwindcss/vite插件,不再需要tailwind.config.js和postcss.config.js。
2.5 eslint.config.js(ESLint 9 flat config)
js
import js from '@eslint/js'
import globals from 'globals'
import reactHooks from 'eslint-plugin-react-hooks'
import reactRefresh from 'eslint-plugin-react-refresh'
import tseslint from 'typescript-eslint'

export default tseslint.config(
  { ignores: ['dist', 'node_modules'] },
  {
    extends: [js.configs.recommended, ...tseslint.configs.recommended],
    files: ['**/*.{ts,tsx}'],
    languageOptions: {
      ecmaVersion: 2022,
      parser: tseslint.parser,
      parserOptions: {
        projectService: true,
        tsconfigRootDir: import.meta.dirname,
      },
    },
    plugins: {
      'react-hooks': reactHooks,
      'react-refresh': reactRefresh,
    },
    rules: {
      ...reactHooks.configs.recommended.rules,
      'react-refresh/only-export-components': ['warn', { allowConstantExport: true }],
      '@typescript-eslint/no-unused-vars': ['error', { argsIgnorePattern: '^_', varsIgnorePattern: '^_' }],
      '@typescript-eslint/no-explicit-any': 'warn',
    },
  },
)
第 3 章 后端:Express 5 + 定时任务 + Open-Meteo 数据接入
3.1 入口文件 api/server.ts(本地启动用)
ts
/**
 * local server entry file, for local development
 */
import app from './app.js';

const PORT = process.env.PORT || 3001;

const server = app.listen(PORT, () => {
  console.log(`Server ready on port ${PORT}`);
});

process.on('SIGTERM', () => {
  server.close(() => process.exit(0));
});
process.on('SIGINT', () => {
  server.close(() => process.exit(0));
});

export default app;
3.2 应用工厂 api/app.ts
这是整个后端的核心:装配中间件、注册路由、注册 SSE、配置定时任务。
ts
/**
 * 乌兰察布市实时气象数据可视化大屏 - API服务器
 * 数据源: Open-Meteo 官方开放REST接口
 * 定时任务: 每3分钟轮询一次数据
 */

import express, { type Request, type Response, type NextFunction } from 'express'
import cors from 'cors'
import path from 'path'
import dotenv from 'dotenv'
import { fileURLToPath } from 'url'
import cron from 'node-cron'

import createWeatherRouter from './routes/weather.js'
import createAirQualityRouter from './routes/airQuality.js'

import { refreshWeatherData, getWeatherData } from './services/weatherService.js'
import { refreshAirQualityData, getAirQualityData } from './services/airQualityService.js'

import { addClient, broadcast } from './sse/broadcaster.js'

const __filename = fileURLToPath(import.meta.url)
const __dirname = path.dirname(__filename)

dotenv.config()

const app: express.Application = express()

app.use(cors())
app.use(express.json({ limit: '10mb' }))
app.use(express.urlencoded({ extended: true, limit: '10mb' }))

// REST 路由
app.use('/api/weather', createWeatherRouter())
app.use('/api/air-quality', createAirQualityRouter())

// 健康检查
app.use('/api/health', (_req, res) => {
  res.status(200).json({ success: true, message: 'ok', timestamp: new Date().toISOString() })
})

// SSE 实时流
app.get('/api/stream', (req, res) => {
  addClient(res)
  // 连接后立刻把当前缓存推一份给前端
  Promise.allSettled([getWeatherData(), getAirQualityData()]).then(([w, a]) => {
    if (w.status === 'fulfilled') broadcast('weather', w.value)
    if (a.status === 'fulfilled') broadcast('air-quality', a.value)
  })
})

// 全局错误处理(Express 5 支持 async handler)
app.use((error: Error, _req: Request, res: Response, _next: NextFunction) => {
  console.error('Server error:', error)
  res.status(500).json({ success: false, error: 'Server internal error' })
})

// 404
app.use((_req, res) => {
  res.status(404).json({ success: false, error: 'API not found' })
})

/** 启动时立即抓一次 */
async function initializeData() {
  console.log('正在初始化数据...')
  await Promise.all([refreshWeatherData(), refreshAirQualityData()])
  console.log('数据初始化完成')
}

/** 每 3 分钟刷新一次 + 推送给所有 SSE 客户端 */
function setupScheduledTasks() {
  cron.schedule('*/3 * * * *', async () => {
    await refreshWeatherData()
    await refreshAirQualityData()
    const [w, a] = await Promise.allSettled([getWeatherData(), getAirQualityData()])
    if (w.status === 'fulfilled') broadcast('weather', w.value)
    if (a.status === 'fulfilled') broadcast('air-quality', a.value)
  })
  console.log('定时任务已配置: 每3分钟刷新数据')
}

initializeData()
setupScheduledTasks()

export default app
课堂提问:Express 5 与 Express 4 的主要区别?
答:Express 5 原生支持 async handler(自动捕获 Promise rejection),路由参数类型更安全,性能更好。
3.3 数据服务:气象 api/services/weatherService.ts
ts
import axios from 'axios';
const LATITUDE = 40.9945;
const LONGITUDE = 113.1322;
const TIMEZONE = 'Asia/Shanghai';
const WEATHER_API_URL = 'https://api.open-meteo.com/v1/forecast';
let weatherCache: WeatherData | null = null;
export interface WeatherData {
location: { name: string; latitude: number; longitude: number; timezone: string };
current: {
temperature: number; humidity: number; windSpeed: number;
windDirection: number; pressure: number; precipitation: number; time: string;
};
hourly: {
time: string[]; temperature: number[]; precipitation: number[];
humidity: number[]; pressure: number[]; windSpeed: number[]; windDirection: number[];
};
updatedAt: string;
}
/** 从 Open-Meteo 获取 + 清洗 */
async function fetchWeatherFromAPI(): Promise<WeatherData> {
const url =
`${WEATHER_API_URL}?latitude=${LATITUDE}&longitude=${LONGITUDE}` +
`¤t=temperature_2m,relative_humidity_2m,wind_speed_10m,wind_direction_10m,surface_pressure,precipitation` +
`&hourly=temperature_2m,precipitation,relative_humidity_2m,surface_pressure,wind_speed_10m,wind_direction_10m` +
`&forecast_hours=24&timezone=${encodeURIComponent(TIMEZONE)}`;
const { data } = await axios.get(url);
return {
location: { name: '乌兰察布市', latitude: LATITUDE, longitude: LONGITUDE, timezone: TIMEZONE },
current: {
temperature: Math.round(data.current.temperature_2m * 10) / 10,
humidity: Math.round(data.current.relative_humidity_2m),
windSpeed: Math.round(data.current.wind_speed_10m * 10) / 10,
windDirection: data.current.wind_direction_10m,
pressure: Math.round(data.current.surface_pressure),
precipitation: Math.round(data.current.precipitation * 100) / 100,
time: data.current.time,
},
hourly: {
time: data.hourly.time,
temperature: data.hourly.temperature_2m.map((v: number) => Math.round(v * 10) / 10),
precipitation: data.hourly.precipitation.map((v: number) => Math.round(v * 100) / 100),
humidity: (data.hourly.relative_humidity_2m as number[]).map((v: number) => Math.round(v)),
pressure: (data.hourly.surface_pressure as number[]).map((v: number) => Math.round(v)),
windSpeed: (data.hourly.wind_speed_10m as number[]).map((v: number) => Math.round(v * 10) / 10),
windDirection: (data.hourly.wind_direction_10m as number[]).map((v: number) => Math.round(v)),
},
updatedAt: new Date().toISOString(),
};
}
export async function getWeatherData(): Promise<WeatherData> {
if (!weatherCache) weatherCache = await fetchWeatherFromAPI();
return weatherCache;
}
export async function refreshWeatherData(): Promise<void> {
try {
console.log(`[${new Date().toLocaleString('zh-CN', { timeZone: TIMEZONE })}] 正在刷新气象数据...`);
weatherCache = await fetchWeatherFromAPI();
console.log(`[${new Date().toLocaleString('zh-CN', { timeZone: TIMEZONE })}] 气象数据刷新成功`);
} catch (error) {
console.error('气象数据刷新失败:', error instanceof Error ? error.message : error);
// 失败时保留旧缓存,避免页面空白
}
}3.4 数据服务:空气质量 api/services/airQualityService.ts
ts
import axios from 'axios';
const LATITUDE = 40.9945;
const LONGITUDE = 113.1322;
const TIMEZONE = 'Asia/Shanghai';
const AIR_QUALITY_API_URL = 'https://air-quality-api.open-meteo.com/v1/air-quality';
let airQualityCache: AirQualityData | null = null;
export interface AirQualityData {
location: { latitude: number; longitude: number };
current: { aqi: number; pm25: number; pm10: number; no2: number; o3: number };
updatedAt: string;
}
function getFallbackData(): AirQualityData {
return {
location: { latitude: LATITUDE, longitude: LONGITUDE },
current: { aqi: 0, pm25: 0, pm10: 0, no2: 0, o3: 0 },
updatedAt: new Date().toISOString(),
};
}
async function fetchAirQualityFromAPI(): Promise<AirQualityData> {
try {
const url =
`${AIR_QUALITY_API_URL}?latitude=${LATITUDE}&longitude=${LONGITUDE}` +
`¤t=pm2_5,pm10,nitrogen_dioxide,ozone,us_aqi&timezone=${encodeURIComponent(TIMEZONE)}`;
const { data } = await axios.get(url, { timeout: 10000 });
if (data.error) throw new Error(`API错误: ${data.reason || '未知错误'}`);
return {
location: { latitude: LATITUDE, longitude: LONGITUDE },
current: {
aqi: Math.round(data.current.us_aqi ?? 0),
pm25: Math.round((data.current.pm2_5 || 0) * 10) / 10,
pm10: Math.round((data.current.pm10 || 0) * 10) / 10,
no2: Math.round((data.current.nitrogen_dioxide || 0) * 10) / 10,
o3: Math.round(data.current.ozone || 0),
},
updatedAt: new Date().toISOString(),
};
} catch (error) {
console.warn('Open-Meteo 空气质量API调用失败,使用降级数据:',
error instanceof Error ? error.message : error);
return getFallbackData();
}
}
export async function getAirQualityData(): Promise<AirQualityData> {
if (!airQualityCache) airQualityCache = await fetchAirQualityFromAPI();
return airQualityCache;
}
export async function refreshAirQualityData(): Promise<void> {
try {
console.log(`[${new Date().toLocaleString('zh-CN', { timeZone: TIMEZONE })}] 正在刷新空气质量数据...`);
airQualityCache = await fetchAirQualityFromAPI();
if (airQualityCache.current.aqi === 0 && airQualityCache.current.pm25 === 0) {
console.log(`[${new Date().toLocaleString('zh-CN', { timeZone: TIMEZONE })}] 空气质量数据: 当前为降级模式(API可能暂时不可用)`);
} else {
console.log(`[${new Date().toLocaleString('zh-CN', { timeZone: TIMEZONE })}] 空气质量数据刷新成功`);
}
} catch (error) {
console.error('空气质量数据刷新失败:', error instanceof Error ? error.message : error);
}
}3.5 路由 api/routes/weather.ts
ts
import Router, { type Request, type Response, type Router as RouterType } from 'express';
import { getWeatherData } from '../services/weatherService.js';

function createWeatherRouter(): RouterType {
  const router = Router();
  router.get('/', async (_req: Request, res: Response): Promise<void> => {
    try {
      const data = await getWeatherData();
      res.json({ success: true, data });
    } catch (error) {
      console.error('获取气象数据失败:', error);
      res.status(500).json({ success: false, error: '获取气象数据失败,请稍后重试' });
    }
  });
  return router;
}

export default createWeatherRouter;
3.6 路由 api/routes/airQuality.ts
ts
import Router, { type Request, type Response, type Router as RouterType } from 'express';
import { getAirQualityData } from '../services/airQualityService.js';

function createAirQualityRouter(): RouterType {
  const router = Router();
  router.get('/', async (_req: Request, res: Response): Promise<void> => {
    try {
      const data = await getAirQualityData();
      res.json({ success: true, data });
    } catch (error) {
      console.error('获取空气质量数据失败:', error);
      res.status(500).json({ success: false, error: '获取空气质量数据失败,请稍后重试' });
    }
  });
  return router;
}

export default createAirQualityRouter;
3.7 Vercel 部署入口(可选)
ts
// api/index.ts
import type { VercelRequest, VercelResponse } from '@vercel/node';
import app from './app.js';

export default function handler(req: VercelRequest, res: VercelResponse) {
  return app(req, res);
}
3.8 验证后端
bash
curl http://localhost:3001/api/health
curl http://localhost:3001/api/weather | head -c 400
curl http://localhost:3001/api/air-quality | head -c 200
第 4 章 后端:SSE 实时推送总线
4.1 为什么用 SSE 而不是 WebSocket
| 维度 | SSE | WebSocket |
|---|---|---|
| 协议 | HTTP | 独立协议 |
| 方向 | 单向(服务端 → 浏览器) | 双向 |
| 浏览器内置 | EventSource |
需手写协议 |
| 重连 | 浏览器自动 | 需自己实现 |
| 适用 | 实时数据展示 | 聊天 / 协同编辑 |
本项目服务端主动推、客户端只收,SSE 刚好够用。
4.2 api/sse/broadcaster.ts
ts
import type { Response } from 'express';

const clients = new Set<Response>();

/** 设置 SSE 响应头并保持连接 */
export function addClient(res: Response): void {
  res.setHeader('Content-Type', 'text/event-stream; charset=utf-8');
  res.setHeader('Cache-Control', 'no-cache, no-transform');
  res.setHeader('Connection', 'keep-alive');
  res.setHeader('Access-Control-Allow-Origin', '*');
  res.setHeader('X-Accel-Buffering', 'no');
  res.flushHeaders?.();

  // 立刻发一行注释触发浏览器 onopen
  res.write(`: connected ${new Date().toISOString()}\n\n`);

  // 25s 心跳,防止中间代理切断
  const heartbeat = setInterval(() => {
    res.write(`: ping ${Date.now()}\n\n`);
  }, 25_000);

  const cleanup = () => {
    clearInterval(heartbeat);
    clients.delete(res);
    try { res.end(); } catch { /* ignore */ }
  };

  res.on('close', cleanup);
  res.on('error', cleanup);
  clients.add(res);
}

/** 广播事件 */
export function broadcast(event: string, payload: unknown): void {
  const data = `event: ${event}\ndata: ${JSON.stringify(payload)}\n\n`;
  for (const client of clients) {
    try { client.write(data); } catch { clients.delete(client); }
  }
}

export function clientCount(): number { return clients.size; }
4.3 用 curl 测试
bash
curl -N -H "Accept: text/event-stream" http://localhost:3001/api/stream你应该看到:
: connected 2026-...
event: weather
data: {"location":...,"current":{...},"hourly":{...}}

event: air-quality
data: {"location":...,"current":{...}}
课堂提问:
flushHeaders()有什么用?答:立刻把响应头冲刷给客户端,让浏览器尽早建立 SSE 连接;如果不调用,Node 会缓冲头部直到第一次
res.write()。
第 5 章 前端:React 19 + Vite 8 + TailwindCSS 4 骨架
5.1 index.html
html
<!doctype html>
<html lang="zh-CN">
  <head>
    <meta charset="UTF-8" />
    <link rel="icon" type="image/svg+xml" href="/favicon.svg" />
    <meta name="viewport" content="width=device-width, initial-scale=1.0" />
    <title>乌兰察布市实时气象监测大屏</title>
  </head>
  <body>
    <div id="root"></div>
    <script type="module" src="/src/main.tsx"></script>
  </body>
</html>
5.2 src/main.tsx
tsx
import { StrictMode } from 'react'
import { createRoot } from 'react-dom/client'
import App from './App'
import './index.css'

createRoot(document.getElementById('root')!).render(
  <StrictMode>
    <App />
  </StrictMode>,
)
5.3 src/lib/utils.ts:className 合并
ts
import { clsx, type ClassValue } from "clsx"
import { twMerge } from "tailwind-merge"

export function cn(...inputs: ClassValue[]) {
  return twMerge(clsx(inputs))
}
第 6 章 前端:主题样式与深色科技设计系统
6.1 设计目标
- 深空科技风:背景
#060a14,品牌色青色#00e0ff; - 深色卡片:渐变背景 + 科技感边角装饰 + 悬浮发光;
- 数字字体:Inter(标题)+ JetBrains Mono(数据);
- 网格点背景营造纵深感。
6.2 完整 src/index.css
教学说明:TailwindCSS 4 使用
@import "tailwindcss"语法,不再需要@tailwind指令。
css
@import url('https://fonts.googleapis.com/css2?family=Inter:wght@300;400;500;600;700;800&family=JetBrains+Mono:wght@400;500;600&family=Noto+Sans+SC:wght@300;400;500;700&display=swap');
@import "tailwindcss";

:root {
  /* ====== 深色科技主题 ====== */

  /* 背景层 (深空蓝) */
  --bg-page: #060a14;
  --bg-card: #0c1426;
  --bg-card-2: #131c33;
  --bg-subtle: #0a1122;
  --bg-hover: #1a2540;

  /* 边框 */
  --border-light: #1a2540;
  --border-medium: #2a3a60;
  --border-strong: #3d4f7c;

  /* 文字 */
  --text-primary: #e8eef8;
  --text-secondary: #a8b3cf;
  --text-muted: #6b7a9a;
  --text-faint: #3d4b6b;

  /* 品牌色 (霓虹科技) */
  --brand-1: #00e0ff;   /* 主青 */
  --brand-2: #7d4dff;   /* 电紫 */
  --brand-3: #ff6b4a;   /* 暖橘红 */
  --brand-4: #00ffa3;   /* 霓虹绿 */
  --brand-5: #ffb347;   /* 琥珀 */

  /* 数据分类色 (语义保持) */
  --color-temp:    #ff6b4a;
  --color-humid:   #00b4ff;
  --color-wind:    #00ffa3;
  --color-press:   #b87dff;
  --color-rain:    #5cc4ff;
  --color-cloud:   #7a8aa8;
}

* {
  margin: 0;
  padding: 0;
  box-sizing: border-box;
}

html, body, #root {
  width: 100%;
  height: 100%;
  overflow: hidden;
}

body {
  font-family: 'Inter', 'Noto Sans SC', -apple-system, BlinkMacSystemFont, 'Segoe UI', sans-serif;
  background: radial-gradient(ellipse at top, #0c1830 0%, var(--bg-page) 55%);
  color: var(--text-primary);
  -webkit-font-smoothing: antialiased;
  -moz-osx-font-smoothing: grayscale;
  font-feature-settings: 'cv02', 'cv03', 'cv04', 'cv11';
}

.font-display { font-family: 'Inter', sans-serif; font-weight: 600; letter-spacing: -0.02em; }
.font-data { font-family: 'JetBrains Mono', monospace; font-feature-settings: 'tnum'; }

/* ====== 卡片 (深色 + 科技感边角 + 悬浮发光) ====== */
.card {
  position: relative;
  background: linear-gradient(180deg, var(--bg-card) 0%, var(--bg-card-2) 100%);
  border: 1px solid var(--border-light);
  border-radius: 10px;
  transition: border-color .2s ease, box-shadow .25s ease, transform .2s ease;
  overflow: hidden;
}

/* 四角科技感括号装饰 (top-left + bottom-right) */
.card::before,
.card::after {
  content: '';
  position: absolute;
  width: 10px;
  height: 10px;
  pointer-events: none;
  transition: all .2s ease;
  z-index: 2;
}
.card::before {
  top: 0; left: 0;
  border-top: 1.5px solid var(--brand-1);
  border-left: 1.5px solid var(--brand-1);
}
.card::after {
  bottom: 0; right: 0;
  border-bottom: 1.5px solid var(--brand-1);
  border-right: 1.5px solid var(--brand-1);
}

.card:hover {
  border-color: var(--brand-1);
  box-shadow: 0 0 20px -4px rgba(0, 224, 255, 0.25),
              inset 0 0 24px -8px rgba(0, 224, 255, 0.08);
  transform: translateY(-1px);
}
.card:hover::before,
.card:hover::after {
  filter: drop-shadow(0 0 4px rgba(0, 224, 255, 0.6));
}

/* 指标卡 (KPI) */
.kpi {
  position: relative;
  background: linear-gradient(180deg, var(--bg-card) 0%, var(--bg-card-2) 100%);
  border: 1px solid var(--border-light);
  border-radius: 10px;
  padding: 14px 16px;
  display: flex;
  flex-direction: column;
  gap: 6px;
  transition: all .25s ease;
  overflow: hidden;
}
.kpi::before {
  content: '';
  position: absolute;
  top: 0; left: 0;
  width: 3px; height: 100%;
  background: linear-gradient(180deg, var(--accent, var(--brand-1)) 0%, transparent 100%);
}
.kpi:hover {
  border-color: var(--accent, var(--brand-1));
  box-shadow: 0 0 18px -6px var(--accent, var(--brand-1));
  transform: translateY(-2px);
}
.kpi-label {
  font-size: 11px;
  color: var(--text-muted);
  font-weight: 500;
  letter-spacing: 0.06em;
  text-transform: uppercase;
}
.kpi-value {
  font-family: 'JetBrains Mono', monospace;
  font-size: 24px;
  font-weight: 600;
  color: var(--text-primary);
  line-height: 1.1;
  letter-spacing: -0.02em;
}
.kpi-unit {
  font-size: 12px;
  color: var(--text-secondary);
  margin-left: 2px;
  font-weight: 500;
}

/* 数字滚动动画 */
@keyframes countUp {
  from { opacity: 0; transform: translateY(8px); }
  to { opacity: 1; transform: translateY(0); }
}
.animate-count-up { animation: countUp .5s cubic-bezier(.34, 1.56, .64, 1) forwards; }

/* 网格点背景 */
.bg-dots {
  background-image: radial-gradient(circle, var(--border-light) 1px, transparent 1px);
  background-size: 22px 22px;
}

/* 渐变文本 */
.gradient-text {
  background: linear-gradient(135deg, var(--brand-1) 0%, var(--brand-2) 100%);
  -webkit-background-clip: text;
  background-clip: text;
  -webkit-text-fill-color: transparent;
}

/* 扫描线动画 (Footer 用) */
@keyframes scan-x {
  0% { transform: translateX(-100%); }
  100% { transform: translateX(300%); }
}
.scan-line {
  position: relative;
  overflow: hidden;
}
.scan-line::before {
  content: '';
  position: absolute;
  top: 0; left: 0;
  width: 30%;
  height: 1px;
  background: linear-gradient(90deg, transparent, var(--brand-1), transparent);
  animation: scan-x 4s linear infinite;
  pointer-events: none;
}

/* 头部渐变描边 */
.header-glow {
  position: relative;
}
.header-glow::after {
  content: '';
  position: absolute;
  bottom: 0; left: 0; right: 0;
  height: 1px;
  background: linear-gradient(90deg,
    transparent 0%,
    var(--brand-1) 30%,
    var(--brand-2) 70%,
    transparent 100%);
  box-shadow: 0 0 8px rgba(0, 224, 255, 0.5);
}

/* 数字发光效果 */
.text-glow {
  text-shadow: 0 0 8px currentColor;
}
课堂提问:TailwindCSS 4 与 3 的主要区别?
答:Tailwind 4 使用 CSS-first 配置(不再需要
tailwind.config.js),性能提升 10 倍,支持@import "tailwindcss"语法。
第 7 章 前端:React 19 Context + SSE 数据订阅
7.1 src/context/DataContext.tsx:统一数据管理
教学说明:相比旧教程的独立 hooks,我们使用 React 19 的
use()hook + Context 统一管理数据。
tsx
/**
 * 全局数据 Context
 *
 * 负责:
 * 1. 维护气象 + 空气质量数据状态
 * 2. 订阅 SSE 实时推送
 * 3. 首屏 REST 兜底(避免空白)
 * 4. 提供手动刷新方法
 */

import {
  createContext,
  use,
  useState,
  useEffect,
  type ReactNode,
} from 'react'
import axios from 'axios'
import type { WeatherData } from '../../api/services/weatherService'
import type { AirQualityData } from '../../api/services/airQualityService'

const API_BASE =
  (import.meta.env.VITE_API_BASE as string | undefined) || 'http://localhost:3001'

/* ================================================================
 *  Context 类型定义
 * ================================================================ */

interface DataContextValue {
  weather: WeatherData | null
  airQuality: AirQualityData | null
  loading: boolean
  /** 刷新数据的异步函数 */
  refreshData: () => Promise<void>
}

/* ================================================================
 *  创建 Context(初始值由 use() 读取时决定)
 * ================================================================ */

const DataContext = createContext<DataContextValue | null>(null)

/**
 * 【React 19 - use hook】读取数据上下文
 *
 * use() 是 React 19 新增的 API,可替代 useContext:
 * - 可在条件语句和循环中调用(useContext 不行)
 * - 可直接读取 Promise(配合 Suspense)
 * - 读取 Context 时行为与 useContext 一致
 */
export function useData(): DataContextValue {
  const ctx = use(DataContext)
  if (!ctx) throw new Error('useData 必须在 DataProvider 内部使用')
  return ctx
}

/* ================================================================
 *  Provider 组件
 * ================================================================ */

interface DataProviderProps {
  children: ReactNode
}

export function DataProvider({ children }: DataProviderProps) {
  const [weather, setWeather] = useState<WeatherData | null>(null)
  const [airQuality, setAirQuality] = useState<AirQualityData | null>(null)
  const [loading, setLoading] = useState(true)

  /* ---------- SSE 订阅 ---------- */
  useEffect(() => {
    let es: EventSource | null = null
    let retryTimer: ReturnType<typeof setTimeout> | null = null
    let retryDelay = 1000
    let cancelled = false

    const connect = (): void => {
      if (cancelled) return
      es = new EventSource(`${API_BASE}/api/stream`)

      es.onopen = () => {
        retryDelay = 1000
      }

      es.addEventListener('weather', (ev: MessageEvent) => {
        try {
          setWeather(JSON.parse(ev.data))
          setLoading(false)
        } catch (err) {
          console.error('[SSE] 解析 weather 事件失败:', err)
        }
      })

      es.addEventListener('air-quality', (ev: MessageEvent) => {
        try {
          setAirQuality(JSON.parse(ev.data))
          setLoading(false)
        } catch (err) {
          console.error('[SSE] 解析 air-quality 事件失败:', err)
        }
      })

      es.onerror = () => {
        es?.close()
        es = null
        if (cancelled) return
        retryTimer = setTimeout(connect, retryDelay)
        retryDelay = Math.min(retryDelay * 2, 10_000)
      }
    }

    connect()

    const onVisibility = (): void => {
      if (document.visibilityState === 'visible') {
        es?.close()
        es = null
        if (retryTimer) clearTimeout(retryTimer)
        retryDelay = 1000
        connect()
      }
    }
    document.addEventListener('visibilitychange', onVisibility)

    return () => {
      cancelled = true
      if (retryTimer) clearTimeout(retryTimer)
      es?.close()
      document.removeEventListener('visibilitychange', onVisibility)
    }
  }, [])

  /* ---------- REST 兜底(首屏) ---------- */
  useEffect(() => {
    const fetchInitial = async (): Promise<void> => {
      try {
        const [w, a] = await Promise.allSettled([
          axios.get(`${API_BASE}/api/weather`),
          axios.get(`${API_BASE}/api/air-quality`),
        ])
        if (w.status === 'fulfilled' && w.value.data.success) setWeather(w.value.data.data)
        if (a.status === 'fulfilled' && a.value.data.success) setAirQuality(a.value.data.data)
        if (w.status === 'rejected') console.warn('首屏气象数据暂不可用,等待 SSE 推送')
        if (a.status === 'rejected') console.warn('首屏空气质量数据暂不可用,等待 SSE 推送')
      } catch (err) {
        console.warn('首屏数据兜底异常:', err)
      } finally {
        setLoading(false)
      }
    }
    fetchInitial()
  }, [])

  /* ================================================================
   *  刷新数据函数
   * ================================================================ */
  const refreshData = async (): Promise<void> => {
    try {
      setLoading(true)
      const [w, a] = await Promise.all([
        axios.get(`${API_BASE}/api/weather`),
        axios.get(`${API_BASE}/api/air-quality`),
      ])
      if (w.data.success) setWeather(w.data.data)
      if (a.data.success) setAirQuality(a.data.data)
    } catch (err) {
      console.error('刷新数据失败:', err)
    } finally {
      setLoading(false)
    }
  }

  const value: DataContextValue = {
    weather,
    airQuality,
    loading,
    refreshData,
  }

  return <DataContext value={value}>{children}</DataContext>
}
课堂提问:为什么用
use()而不是useContext()?答:
use()是 React 19 的新 API,可以在条件语句和循环中调用(useContext不行),还能直接读取 Promise(配合 Suspense)。
7.2 src/lib/chartTheme.ts:ECharts 6 主题
ts
/**
 * ECharts 6 主题与色板
 * 现代深色科技风
 */

// 调色板(柔和现代色,用于图表数据)
export const palette = {
  // 主品牌色
  primary: '#00e0ff',      // 主青色
  secondary: '#d500f9',    // 紫
  success: '#69f0ae',      // 绿
  warning: '#ffab00',      // 琥珀
  danger: '#ff5252',       // 红
  warm: '#ff8a65',         // 暖橘

  // 数据指标色
  temp: '#ff8a65',         // 温度 - 橘
  humid: '#00b0ff',        // 湿度 - 浅蓝
  wind: '#69f0ae',         // 风 - 绿
  pressure: '#ff5252',     // 气压 - 红
  rain: '#448aff',         // 雨 - 蓝
  cloud: '#90a4ae',        // 云 - 灰
  purple: '#d500f9',       // 紫
  aqi: '#00e0ff',          // 空气质量 AQI 青色

  // 文字与背景
  textPrimary: '#f0f3fa',
  textSecondary: '#a3b1cc',
  textMuted: '#6b7a9a',
  textFaint: '#3a4761',
  border: 'rgba(105, 240, 174, 0.12)',
  cardBg: '#060a14',
  bgPage: '#050a1a',
};

/** 16 色风向调色板(玫瑰图用) */
export const windRosePalette = [
  '#69f0ae', '#26c6da', '#00b0ff', '#448aff',
  '#7c4dff', '#d500f9', '#ff4081', '#ff5252',
  '#ff6e40', '#ff8a65', '#ffab00', '#ffd54f',
  '#dce775', '#aed581', '#81c784', '#4db6ac',
];

/** 柔和面积渐变(垂直) */
export const areaGradient = (color: string) => ({
  type: 'linear',
  x: 0, y: 0, x2: 0, y2: 1,
  colorStops: [
    { offset: 0, color: color + 'cc' },
    { offset: 0.5, color: color + '55' },
    { offset: 1, color: color + '08' },
  ],
});

/** AQI 颜色映射(基于中国 AQI 标准 0-300) */
export function aqiColor(aqi: number): string {
  if (aqi <= 50) return '#69f0ae';     // 优 - 绿
  if (aqi <= 100) return '#ffeb3b';    // 良 - 黄
  if (aqi <= 150) return '#ffab00';    // 轻度污染 - 琥珀
  if (aqi <= 200) return '#ff6e40';    // 中度污染 - 橘
  if (aqi <= 300) return '#ff5252';    // 重度污染 - 红
  return '#b71c1c';                    // 严重污染 - 暗红
}

/** AQI 等级文字 */
export function aqiLevel(aqi: number): string {
  if (aqi <= 50) return '优';
  if (aqi <= 100) return '良';
  if (aqi <= 150) return '轻度污染';
  if (aqi <= 200) return '中度污染';
  if (aqi <= 300) return '重度污染';
  return '严重污染';
}

export const chartTheme = {
  backgroundColor: 'transparent',

  // 全局文字
  textStyle: {
    color: palette.textSecondary,
    fontFamily: 'Inter, "Noto Sans SC", sans-serif',
    fontSize: 11,
  },

  // 标题
  title: {
    textStyle: {
      color: palette.textPrimary,
      fontSize: 13,
      fontWeight: 600,
    },
    subtextStyle: {
      color: palette.textMuted,
      fontSize: 11,
    },
  },

  // 提示框(ECharts 6 完全重写)
  tooltip: {
    backgroundColor: 'rgba(6, 10, 20, 0.92)',
    borderColor: palette.cardBorder,
    borderWidth: 1,
    textStyle: { color: palette.textPrimary, fontSize: 12 },
    extraCssText: 'box-shadow: 0 4px 20px rgba(0,0,0,.6); border-radius: 6px; backdrop-filter: blur(8px);',
  },

  // 图例
  legend: {
    textStyle: { color: palette.textSecondary, fontSize: 10 },
    itemWidth: 10,
    itemHeight: 6,
    itemGap: 12,
  },

  // 类目轴
  categoryAxis: {
    axisLine: { lineStyle: { color: 'rgba(255,255,255,0.08)' } },
    axisTick: { show: false },
    axisLabel: { color: palette.textMuted, fontSize: 10 },
    splitLine: { show: false },
  },

  // 数值轴
  valueAxis: {
    axisLine: { show: false },
    axisTick: { show: false },
    axisLabel: { color: palette.textMuted, fontSize: 10 },
    splitLine: { lineStyle: { color: 'rgba(255,255,255,0.04)', type: 'dashed' } },
  },
};
第 8 章 前端:ECharts 6 可视化组件开发
8.1 src/components/EChartsWrapper/ChartCanvas.tsx:自定义 ECharts 6 包装
教学说明:由于
echarts-for-react与 ECharts 6 不兼容,我们手写一个更轻量的组件。
tsx
/**
 * 自定义 ECharts 6 React 组件
 * - 不依赖 echarts-for-react(与 ECharts 6 不兼容)
 * - 使用 ResizeObserver 确保容器有尺寸才渲染
 * - 使用 ECharts 6 的 tree-shaking 模块导入
 * - 支持 option 变化时更新图表
 */

import { useEffect, useRef, useState, type ReactElement } from 'react';
import * as echarts from 'echarts/core';
import { LineChart, BarChart, ScatterChart, RadarChart } from 'echarts/charts';
import {
  GridComponent,
  TooltipComponent,
  TitleComponent,
  LegendComponent,
  PolarComponent,
  RadarComponent,
  MarkLineComponent,
  MarkPointComponent,
  DataZoomComponent,
} from 'echarts/components';
import { CanvasRenderer } from 'echarts/renderers';
import type { EChartsCoreOption } from 'echarts/core';

// 注册 ECharts 6 模块(树摇优化)
echarts.use([
  LineChart,
  BarChart,
  ScatterChart,
  RadarChart,
  GridComponent,
  TooltipComponent,
  TitleComponent,
  LegendComponent,
  PolarComponent,
  RadarComponent,
  MarkLineComponent,
  MarkPointComponent,
  DataZoomComponent,
  CanvasRenderer,
]);

interface ChartCanvasProps {
  option: EChartsCoreOption;
  className?: string;
  style?: React.CSSProperties;
  opts?: {
    renderer?: 'canvas' | 'svg';
  };
}

export default function ChartCanvas({
  option,
  className = '',
  style,
  opts,
}: ChartCanvasProps): ReactElement | null {
  const containerRef = useRef<HTMLDivElement>(null);
  const chartRef = useRef<echarts.ECharts | null>(null);
  const [hasSize, setHasSize] = useState(false);

  // 监听尺寸变化
  useEffect(() => {
    const el = containerRef.current;
    if (!el) return undefined;

    const checkSize = () => {
      if (el.clientWidth > 0 && el.clientHeight > 0) {
        setHasSize(true);
      }
    };
    checkSize();

    const observer = new ResizeObserver((entries) => {
      for (const entry of entries) {
        const { width, height } = entry.contentRect;
        if (width > 0 && height > 0) {
          setHasSize(true);
          // 容器尺寸变化时自动 resize
          chartRef.current?.resize();
        }
      }
    });
    observer.observe(el);
    return () => observer.disconnect();
  }, []);

  // 初始化 / 更新图表
  useEffect(() => {
    if (!hasSize) return undefined;
    const el = containerRef.current;
    if (!el) return undefined;

    if (!chartRef.current) {
      chartRef.current = echarts.init(el, undefined, {
        renderer: opts?.renderer || 'canvas',
      });
    }

    chartRef.current.setOption(option, { notMerge: true });

    // 处理窗口大小变化
    const handleResize = () => chartRef.current?.resize();
    window.addEventListener('resize', handleResize);

    return () => {
      window.removeEventListener('resize', handleResize);
      chartRef.current?.dispose();
      chartRef.current = null;
    };
  }, [hasSize, option, opts?.renderer]);

  return (
    <div
      ref={containerRef}
      className={className}
      style={{ width: '100%', height: '100%', minHeight: '1px', ...style }}
    />
  );
}
课堂提问:为什么用
ResizeObserver而不是直接渲染?答:ECharts 需要容器有明确尺寸才能正确计算布局。
ResizeObserver确保容器有尺寸后才初始化图表,避免渲染异常。
8.2 Header:src/components/Header/Header.tsx
要点:
- 中间标题固定居中,左右两侧各设固定宽度;
- 时间用
YYYY-MM-DD HH:mm:SS,加tabular-nums防宽度抖动。
tsx
/**
 * 顶部导航- 深色科技 * 含渐变描+ 动态脉冲时 */

import { useEffect, useState } from 'react';
import { RefreshCw, Cloud, Search, Activity } from 'lucide-react';
import { useData } from '@/context/DataContext';

export default function Header() {
  const [currentTime, setCurrentTime] = useState(new Date());
  const { refreshData, loading } = useData();

  useEffect(() => {
    const timer = setInterval(() => setCurrentTime(new Date()), 1000);
    return () => clearInterval(timer);
  }, []);

  const pad = (n: number) => String(n).padStart(2, '0');
  const formatDate = (d: Date) =>
    `${d.getFullYear()}-${pad(d.getMonth() + 1)}-${pad(d.getDate())}  ${pad(d.getHours())}:${pad(d.getMinutes())}:${pad(d.getSeconds())}`;
  const weekDay = ['周日', '周一', '周二', '周三', '周四', '周五', '周六'][currentTime.getDay()];

  return (
    <header
      className="header-glow h-16 px-6 flex items-center justify-between shrink-0"
      style={{
        background: 'linear-gradient(180deg, rgba(19, 28, 51, 0.6) 0%, rgba(12, 20, 38, 0.4) 100%)',
        backdropFilter: 'blur(8px)',
      }}
    >
      {/* 左侧:品+ 城市 */}
      <div className="flex items-center gap-4">
        <div className="flex items-center gap-2.5">
          <div
            className="w-10 h-10 rounded-lg flex items-center justify-center relative"
            style={{
              background: 'linear-gradient(135deg, var(--brand-1), var(--brand-2))',
              boxShadow: '0 0 16px -2px var(--brand-1), inset 0 0 8px rgba(255, 255, 255, 0.15)',
            }}
          >
            <Cloud size={20} color="white" strokeWidth={2.4} />
            <div
              className="absolute -top-0.5 -right-0.5 w-2 h-2 rounded-full"
              style={{ background: 'var(--brand-4)', boxShadow: '0 0 6px var(--brand-4)' }}
            />
          </div>
          <div>
            <div className="font-display text-[15px] font-semibold gradient-text">
              乌兰察布气象监测
            </div>
            <div className="text-[11px] flex items-center gap-1" style={{ color: 'var(--text-muted)' }}>
              <Activity size={9} />
              Ulanqab Weather Analytics
            </div>
          </div>
        </div>
        <div className="h-8 w-px" style={{ background: 'var(--border-medium)' }} />
        <div className="flex items-center gap-2">
          <span className="text-[13px] font-medium" style={{ color: 'var(--text-secondary)' }}>乌兰察布市</span>
          <span className="dot dot-active" />
          <span className="text-[11px] tracking-wider uppercase" style={{ color: 'var(--brand-4)' }}>实时在线</span>
        </div>
      </div>

      {/* 中央:搜索 / 标签 */}
      <div className="flex items-center gap-2">
        <div
          className="flex items-center gap-2 px-3 py-1.5 rounded-md"
          style={{
            background: 'var(--bg-subtle)',
            border: '1px solid var(--border-light)',
          }}
        >
          <Search size={13} color="var(--text-muted)" />
          <span className="text-[12px]" style={{ color: 'var(--text-muted)' }}>搜索指标 / 区域 / 时间段</span>
          <span
            className="text-[10px] px-1.5 py-0.5 rounded ml-4 font-data"
            style={{
              background: 'var(--bg-card-2)',
              color: 'var(--text-muted)',
              border: '1px solid var(--border-light)',
            }}
          >
            K
          </span>
        </div>
      </div>

      {/* 右侧:时+ 操作 */}
      <div className="flex items-center gap-3">
        <div className="text-right">
          <div
            className="font-data text-[14px] font-medium text-glow"
            style={{ color: 'var(--text-primary)' }}
          >
            {formatDate(currentTime)}
          </div>
          <div className="text-[10px] tracking-wider" style={{ color: 'var(--text-muted)' }}>
            {weekDay} · CST
          </div>
        </div>
        <div className="h-8 w-px" style={{ background: 'var(--border-medium)' }} />
        <button
          type="button"
          onClick={(e) => { e.preventDefault(); e.stopPropagation(); void refreshData(); }}
          disabled={loading}
          className="btn btn-primary"
          title="刷新数据"
        >
          <RefreshCw size={13} className={loading ? 'animate-spin' : ''} />
          <span>{loading ? '刷新中' : '刷新数据'}</span>
        </button>
      </div>
    </header>
  );
}
8.3 Footer:src/components/Footer/Footer.tsx
tsx
/**
 * 底部信息- 深色科技 * 含扫描线动画 + 数据时间状 */

interface FooterProps {
  weatherUpdatedAt?: string;
  airQualityUpdatedAt?: string;
}

export default function Footer({ weatherUpdatedAt, airQualityUpdatedAt }: FooterProps) {
  const pad = (n: number) => String(n).padStart(2, '0');
  const formatTime = (isoString?: string) => {
    if (!isoString) return '--:--:--';
    const d = new Date(isoString);
    return `${pad(d.getHours())}:${pad(d.getMinutes())}:${pad(d.getSeconds())}`;
  };

  return (
    <footer
      className="scan-line h-10 px-6 flex items-center justify-between text-[12px] shrink-0"
      style={{
        background: 'linear-gradient(180deg, rgba(12, 20, 38, 0.4) 0%, rgba(6, 10, 20, 0.8) 100%)',
        borderTop: '1px solid var(--border-light)',
        color: 'var(--text-muted)',
        position: 'relative',
      }}
    >
      <div className="flex items-center gap-3 relative z-10">
        <span className="tracking-wider uppercase text-[10px]" style={{ color: 'var(--text-faint)' }}>数据源</span>
        <span className="font-display font-medium" style={{ color: 'var(--text-secondary)' }}>Open-Meteo</span>
        <span style={{ color: 'var(--text-faint)' }}>·</span>
        <span>ECMWF</span>
        <span style={{ color: 'var(--text-faint)' }}>·</span>
        <span>中国气象局</span>
      </div>

      <div className="flex items-center gap-5 font-data relative z-10">
        <div className="flex items-center gap-1.5">
          <span className="dot" style={{ background: 'var(--color-temp)', boxShadow: '0 0 6px var(--color-temp)' }} />
          <span className="text-[11px] tracking-wider uppercase" style={{ color: 'var(--text-faint)' }}>气象</span>
          <span style={{ color: 'var(--text-primary)' }}>{formatTime(weatherUpdatedAt)}</span>
        </div>
        <div className="flex items-center gap-1.5">
          <span className="dot" style={{ background: 'var(--color-humid)', boxShadow: '0 0 6px var(--color-humid)' }} />
          <span className="text-[11px] tracking-wider uppercase" style={{ color: 'var(--text-faint)' }}>空气</span>
          <span style={{ color: 'var(--text-primary)' }}>{formatTime(airQualityUpdatedAt)}</span>
        </div>
        <div className="flex items-center gap-1.5">
          <span className="dot" style={{ background: 'var(--color-wind)', boxShadow: '0 0 6px var(--color-wind)' }} />
          <span className="text-[11px] tracking-wider uppercase" style={{ color: 'var(--text-faint)' }}>SSE</span>
          <span style={{ color: 'var(--text-primary)' }}>已连</span>
        </div>
      </div>
    </footer>
  );
}
8.4 WeatherCards:核心指标卡片组
tsx
/**
 * 核心气象指标卡片- 深色科技 */

import type { WeatherData } from '../../../api/services/weatherService';
import { palette } from '@/lib/chartTheme';
import { Thermometer, Droplets, Wind, Gauge } from 'lucide-react';

interface WeatherCardsProps {
  data: WeatherData | null;
  loading: boolean;
}

interface KpiProps {
  icon: React.ReactNode;
  label: string;
  value: string | number;
  unit: string;
  color: string;   // 主色 (hex 6-char)
  accent: string;  // --accent 用的 var (e.g. 'var(--color-temp)')
  sub?: string;
  loading: boolean;
}

function KpiCard({ icon, label, value, unit, color, accent, sub, loading }: KpiProps) {
  if (loading) {
    return (
      <div className="kpi" style={{ '--accent': accent } as React.CSSProperties}>
        <div className="h-3 w-16 rounded animate-pulse" style={{ background: 'var(--bg-subtle)' }} />
        <div className="h-7 w-24 rounded animate-pulse" style={{ background: 'var(--bg-subtle)' }} />
        <div className="h-2.5 w-full rounded animate-pulse" style={{ background: 'var(--bg-subtle)' }} />
      </div>
    );
  }

  return (
    <div className="kpi" style={{ '--accent': accent } as React.CSSProperties}>
      <div className="flex items-center justify-between">
        <div className="kpi-label" style={{ color }}>{label}</div>
        <div
          className="w-7 h-7 rounded-md flex items-center justify-center"
          style={{
            background: `${color}22`,  // 13% alpha (8-char hex, valid on 6-char hex input)
            color,
            boxShadow: `inset 0 0 12px ${color}33`,
          }}
        >
          {icon}
        </div>
      </div>
      <div>
        <span className="kpi-value text-glow" style={{ color }}>{value}</span>
        <span className="kpi-unit">{unit}</span>
      </div>
      {sub && <div className="kpi-trend">{sub}</div>}
    </div>
  );
}

export default function WeatherCards({ data, loading }: WeatherCardsProps) {
  const humidity = data?.current.humidity ?? 0;
  const temp = data?.current.temperature ?? 0;
  const comfort = humidity > 70 ? '潮湿' : humidity < 30 ? '干燥' : '适宜';

  return (
    <div className="grid grid-cols-2 gap-3 h-full">
      <KpiCard
        icon={<Thermometer size={14} />}
        label="实时气温"
        value={data?.current.temperature ?? '--'}
        unit="°C"
        color={palette.temp}
        accent="var(--color-temp)"
        sub={`体感 ${Math.round(temp * 1.05)}°C`}
        loading={loading}
      />
      <KpiCard
        icon={<Droplets size={14} />}
        label="相对湿度"
        value={data?.current.humidity ?? '--'}
        unit="%"
        color={palette.humid}
        accent="var(--color-humid)"
        sub={`舒适度 · ${comfort}`}
        loading={loading}
      />
      <KpiCard
        icon={<Wind size={14} />}
        label="风速"
        value={data?.current.windSpeed ?? '--'}
        unit="km/h"
        color={palette.wind}
        accent="var(--color-wind)"
        sub={`风向 ${data?.current.windDirection ?? '--'}°`}
        loading={loading}
      />
      <KpiCard
        icon={<Gauge size={14} />}
        label="气压"
        value={data?.current.pressure ?? '--'}
        unit="hPa"
        color={palette.press}
        accent="var(--color-press)"
        sub={`降水 ${data?.current.precipitation ?? 0} mm`}
        loading={loading}
      />
    </div>
  );
}
8.5 AirQualityPanel:空气质量监测面板
tsx
/**
 * 空气质量面板 - 深色科技 * 突出 AQI 圆形进度+ 4 个次级指(PM2.5/PM10/NO2/O3)
 */

import { useData } from '@/context/DataContext';
import { aqiColor, aqiLevel, palette } from '@/lib/chartTheme';

interface AirQualityPanelProps {
  loading: boolean;
}

interface MetricProps {
  label: string;
  value: number;
  unit: string;
  color: string;
  sub?: string;
  loading: boolean;
}

function MiniMetric({ label, value, unit, color, sub, loading }: MetricProps) {
  if (loading) {
    return (
      <div className="rounded-md p-2 animate-pulse"
        style={{ background: 'var(--bg-subtle)', border: '1px solid var(--border-light)', height: 64 }} />
    );
  }
  return (
    <div
      className="rounded-md px-2.5 py-2 flex flex-col gap-0.5"
      style={{
        background: 'var(--bg-card-2)',
        border: '1px solid var(--border-light)',
      }}
    >
      <div className="text-[10px] tracking-wider uppercase font-medium" style={{ color: palette.textMuted }}>
        {label}
      </div>
      <div className="flex items-baseline gap-1">
        <span className="font-data text-[16px] font-semibold text-glow" style={{ color }}>
          {value}
        </span>
        <span className="text-[10px]" style={{ color: palette.textMuted }}>{unit}</span>
      </div>
      {sub && <div className="text-[10px]" style={{ color: palette.textFaint }}>{sub}</div>}
    </div>
  );
}

export default function AirQualityPanel({ loading }: AirQualityPanelProps) {
  const { airQuality } = useData();
  const aqi = airQuality?.current.aqi ?? 0;
  const level = aqiLevel(aqi);
  const color = aqiColor(aqi);

  // 圆形进度 AQI 0-300 映射0-1
  const aqiRatio = Math.min(aqi / 300, 1);
  const RING_R = 42;
  const RING_C = 2 * Math.PI * RING_R;
  const ringDash = RING_C * aqiRatio;
  const ringGap = RING_C - ringDash;

  return (
    <div className="card p-4 h-full flex flex-col">
      <div className="section-title mb-3" style={{ '--accent': 'var(--brand-2)' } as React.CSSProperties}>
        空气质量监测
      </div>

      {loading ? (
        <div className="flex-1 flex items-center justify-center">
          <div className="text-[12px]" style={{ color: palette.textMuted }}>加载..</div>
        </div>
      ) : (
        <div className="flex-1 flex flex-col gap-3 min-h-0">
          {/* AQI 圆形进度*/}
          <div
            className="rounded-md flex items-center gap-4 px-4 py-3"
            style={{
              background: 'var(--bg-card-2)',
              border: '1px solid var(--border-light)',
              boxShadow: `inset 0 0 24px -8px ${color}33`,
            }}
          >
            <div className="relative shrink-0" style={{ width: 100, height: 100 }}>
              <svg width="100" height="100" viewBox="0 0 100 100" style={{ transform: 'rotate(-90deg)' }}>
                <circle
                  cx="50" cy="50" r={RING_R}
                  fill="none"
                  stroke="var(--border-medium)"
                  strokeWidth="6"
                />
                <circle
                  cx="50" cy="50" r={RING_R}
                  fill="none"
                  stroke={color}
                  strokeWidth="6"
                  strokeLinecap="round"
                  strokeDasharray={`${ringDash} ${ringGap}`}
                  style={{
                    filter: `drop-shadow(0 0 6px ${color})`,
                    transition: 'stroke-dasharray .8s ease',
                  }}
                />
              </svg>
              <div className="absolute inset-0 flex flex-col items-center justify-center">
                <span
                  className="font-data text-[24px] font-semibold leading-none text-glow"
                  style={{ color }}
                >
                  {aqi || '--'}
                </span>
                <span className="text-[10px] tracking-widest mt-1" style={{ color: palette.textMuted }}>AQI</span>
              </div>
            </div>
            <div className="flex-1 min-w-0">
              <div className="text-[12px] tracking-wider uppercase" style={{ color: palette.textMuted }}>等级</div>
              <div className="text-[20px] font-semibold mt-0.5 text-glow" style={{ color }}>
                {level}
              </div>
              <div className="text-[10px] mt-1 leading-relaxed" style={{ color: palette.textFaint }}>
                来自 Open-Meteo US AQI
              </div>
            </div>
          </div>

          {/* 4 个次级指2x2 */}
          <div className="grid grid-cols-2 gap-2">
            <MiniMetric
              label="PM2.5"
              value={airQuality?.current.pm25 ?? 0}
              unit="μg/m³"
              color={palette.humid}
              loading={loading}
            />
            <MiniMetric
              label="PM10"
              value={airQuality?.current.pm10 ?? 0}
              unit="μg/m³"
              color={palette.purple}
              loading={loading}
            />
            <MiniMetric
              label="NO₂"
              value={airQuality?.current.no2 ?? 0}
              unit="μg/m³"
              color={palette.warm}
              loading={loading}
            />
            <MiniMetric
              label="O₃"
              value={airQuality?.current.o3 ?? 0}
              unit="μg/m³"
              color={palette.wind}
              loading={loading}
            />
          </div>
        </div>
      )}
    </div>
  );
}
8.6 TemperatureChart:24h 温度趋势
tsx
/**
 * 温度趋势折线图 - ECharts 6
 * 数据降级保障:当缺少逐小时温度数据时基于当前值生成
 */

import type { WeatherData } from '../../../api/services/weatherService';
import ChartCanvas from '@/components/EChartsWrapper/ChartCanvas';
import { chartTheme, areaGradient, palette } from '@/lib/chartTheme';

interface TemperatureChartProps {
  data: WeatherData | null;
  loading: boolean;
}

function safeGetTempData(data: WeatherData | null) {
  const rawTimes = data?.hourly.time?.map(t => t.slice(11, 16)) || [];
  const rawTemps = data?.hourly.temperature || [];

  if (rawTemps.length >= 24 && rawTimes.length >= 24) {
    return { times: rawTimes, temps: rawTemps };
  }
  const base = data?.current.temperature ?? 20;
  const times = Array.from({ length: 24 }, (_, i) => `${String(i).padStart(2, '0')}:00`);
  const temps = Array.from({ length: 24 }, (_, i) => {
    const variation = 4 * Math.cos((i - 14) * Math.PI / 12);
    return Math.round((base + variation + (Math.random() - 0.5) * 1.5) * 10) / 10;
  });
  return { times, temps };
}

export default function TemperatureChart({ data, loading }: TemperatureChartProps) {
  const { times, temps } = safeGetTempData(data);

  const option = {
    ...chartTheme,
    grid: { top: 40, right: 24, bottom: 28, left: 48 },
    title: {
      ...chartTheme.title,
      text: '24 小时温度趋势',
      left: 16,
      top: 8,
    },
    tooltip: {
      ...chartTheme.tooltip,
      trigger: 'axis',
      formatter: (params: unknown) => {
        const arr = params as Array<{ axisValue: string; value: number }>
        const p = arr[0]
        return `<div style="font-size:11px;color:${palette.textMuted};margin-bottom:4px">${p.axisValue}</div>
                <div><span style="display:inline-block;width:8px;height:8px;border-radius:50%;background:${palette.temp};box-shadow:0 0 6px ${palette.temp};margin-right:6px"></span>温度 <b style="color:${palette.textPrimary}">${p.value}°C</b></div>`;
      },
    },
    xAxis: {
      type: 'category' as const,
      data: times,
      boundaryGap: false,
      ...chartTheme.categoryAxis,
    },
    yAxis: {
      type: 'value' as const,
      name: '°C',
      nameTextStyle: { color: palette.textFaint, fontSize: 10, padding: [0, 30, 0, 0] },
      min: (v: { min: number; max: number }) => Math.floor(v.min - 3),
      max: (v: { min: number; max: number }) => Math.ceil(v.max + 3),
      ...chartTheme.valueAxis,
    },
    series: [{
      name: '温度',
      type: 'line' as const,
      smooth: true,
      symbol: 'circle' as const,
      symbolSize: 5,
      showSymbol: false,
      data: temps,
      lineStyle: { width: 2.5, color: palette.temp, shadowColor: `${palette.temp}88`, shadowBlur: 12 },
      itemStyle: { color: palette.temp, borderColor: palette.cardBg, borderWidth: 2 },
      areaStyle: { color: areaGradient(palette.temp) },
      markPoint: {
        symbol: 'circle' as const,
        symbolSize: 30,
        data: [
          { type: 'max' as const, name: '高', itemStyle: { color: palette.temp, shadowColor: palette.temp, shadowBlur: 10 }, label: { color: '#060a14', fontSize: 10, fontWeight: 600 } },
          { type: 'min' as const, name: '低', itemStyle: { color: palette.humid, shadowColor: palette.humid, shadowBlur: 10 }, label: { color: '#060a14', fontSize: 10, fontWeight: 600 } },
        ],
      },
      markLine: {
        silent: true,
        symbol: 'none' as const,
        lineStyle: { color: palette.border, type: 'dashed' as const },
        label: { color: palette.textMuted, fontSize: 10 },
        data: [{ type: 'average' as const, name: '均值' }],
      },
    }],
    animationDuration: 1200,
  };

  if (loading) return <LoadingPlaceholder />;

  return (
    <div className="card p-4 h-full flex flex-col">
      <div className="flex-1 min-h-0">
        <ChartCanvas option={option} />
      </div>
    </div>
  );
}

function LoadingPlaceholder() {
  return (
    <div className="card p-4 h-full flex items-center justify-center">
      <div className="text-[12px]" style={{ color: 'var(--text-muted)' }}>加载中...</div>
    </div>
  );
}
8.7 PrecipitationChart:逐小时降水量
tsx
/**
 * 逐小时降水量 - ECharts 6
 * 数据降级保障:缺少数据时基于当前值生成
 */

import type { TooltipFormatterCallback } from 'echarts/types/dist/shared.d.ts'
import type { WeatherData } from '../../../api/services/weatherService'
import ChartCanvas from '@/components/EChartsWrapper/ChartCanvas'
import { chartTheme, areaGradient, palette } from '@/lib/chartTheme'

interface PrecipitationChartProps {
  data: WeatherData | null
  loading: boolean
}

function safeGetPrecipData(data: WeatherData | null) {
  const rawTimes = data?.hourly.time?.map(t => t.slice(11, 16)) || []
  const rawPrecip = data?.hourly.precipitation || []

  if (rawPrecip.length >= 24 && rawTimes.length >= 24) {
    return { times: rawTimes, precip: rawPrecip }
  }
  const base = data?.current.precipitation ?? 0
  const times = Array.from({ length: 24 }, (_, index) => `${String(index).padStart(2, '0')}:00`)
  const precip = Array.from({ length: 24 }, () => {
    if (Math.random() < 0.7) return 0
    return Math.round((base + Math.random() * 3) * 10) / 10
  })
  return { times, precip }
}

export default function PrecipitationChart({ data, loading }: PrecipitationChartProps) {
  const { times, precip } = safeGetPrecipData(data)

  if (loading) return <LoadingPlaceholder />

  const option = {
    ...chartTheme,
    grid: { top: 40, right: 16, bottom: 28, left: 48 },
    title: {
      ...chartTheme.title,
      text: '逐小时降水量',
      left: 16,
      top: 8,
    },
    tooltip: {
      ...chartTheme.tooltip,
      trigger: 'axis',
      formatter: ((params: unknown) => {
        const arr = params as Array<{ axisValue: string; value: number }>
        const p = arr[0]
        return `<div style="font-size:11px;color:${palette.textMuted};margin-bottom:4px">${p.axisValue}</div>
                <div><span style="display:inline-block;width:8px;height:8px;border-radius:50%;background:${palette.rain};box-shadow:0 0 6px ${palette.rain};margin-right:6px"></span>降水量 <b style="color:${palette.textPrimary}">${p.value} mm</b></div>`
      }) as TooltipFormatterCallback<number>,
    },
    xAxis: {
      type: 'category' as const,
      data: times,
      ...chartTheme.categoryAxis,
      axisLabel: { ...chartTheme.categoryAxis.axisLabel, interval: 4 },
    },
    yAxis: {
      type: 'value' as const,
      name: 'mm',
      nameTextStyle: { color: palette.textFaint, fontSize: 10, padding: [0, 25, 0, 0] },
      ...chartTheme.valueAxis,
    },
    series: [{
      name: '降水量',
      type: 'bar' as const,
      barWidth: '50%',
      data: precip,
      itemStyle: {
        borderRadius: [4, 4, 0, 0],
        color: (rawParams: unknown) => {
          const params = rawParams as { value: number }
          const v = params.value
          if (v === 0) return 'rgba(255, 255, 255, 0.04)'
          if (v > 2) return areaGradient(palette.rain)
          return palette.rain
        },
      },
      emphasis: {
        itemStyle: { color: palette.rain, shadowBlur: 8, shadowColor: palette.rain + '66' },
      },
      label: {
        show: true,
        position: 'top' as const,
        formatter: (rawParams: unknown) => {
          const params = rawParams as { value: number }
          return params.value > 0 ? `${params.value}` : ''
        },
        color: palette.textSecondary,
        fontSize: 9,
      },
    }],
    animationDuration: 1500,
  }

  return (
    <div className="card p-4 h-full flex flex-col">
      <div className="flex-1 min-h-0">
        <ChartCanvas option={option} />
      </div>
    </div>
  )
}

function LoadingPlaceholder() {
  return (
    <div className="card p-4 h-full flex items-center justify-center">
      <div className="text-[12px]" style={{ color: 'var(--text-muted)' }}>加载中...</div>
    </div>
  )
}
8.8 TempHumidCombo:温湿度双轴
关键点:
- 双 Y 轴:左温度 °C,右湿度 %;
- 柱状 + 折线叠加。
tsx
/**
 * 温湿度双轴组合图 - ECharts 6
 * 数据降级保障:缺少数据时基于当前值生成
 */

import type { WeatherData } from '../../../api/services/weatherService';
import ChartCanvas from '@/components/EChartsWrapper/ChartCanvas';
import { chartTheme, areaGradient, palette } from '@/lib/chartTheme';

interface TempHumidComboProps {
  data: WeatherData | null;
  loading: boolean;
}

export default function TempHumidCombo({ data, loading }: TempHumidComboProps) {
  const temps = data?.hourly.temperature || [];
  const humidities = data?.hourly.humidity || [];
  const times = data?.hourly.time?.map(t => t.slice(11, 16)) || [];

  const hasRealData = temps.length > 0 && humidities.length > 0;
  const displayTemps = hasRealData ? temps : (() => {
    const base = data?.current.temperature ?? 20;
    return Array.from({ length: 24 }, (_, i) =>
      Math.round((base + Math.cos((i - 14) * Math.PI / 12) * 5 + (Math.random() - 0.5)) * 10) / 10
    );
  })();
  const displayHumids = hasRealData ? humidities : (() => {
    const base = data?.current.humidity ?? 50;
    return Array.from({ length: 24 }, (_, i) =>
      Math.max(20, Math.min(100, Math.round(base + Math.sin(i / 3) * 15 + (Math.random() - 0.5) * 8)))
    );
  })();
  const displayTimes = hasRealData && times.length >= 24
    ? times
    : Array.from({ length: 24 }, (_, i) => `${String(i).padStart(2, '0')}:00`);

  if (loading) return <LoadingPlaceholder />;

  const option = {
    ...chartTheme,
    tooltip: {
      ...chartTheme.tooltip,
      trigger: 'axis',
      formatter: (params: unknown) => {
        const arr = params as Array<{ axisValue: string; seriesName: string; value: number }>
        let s = `<div style="font-size:11px;color:${palette.textMuted};margin-bottom:6px">${arr[0].axisValue}</div>`;
        arr.forEach((p) => {
          const color = p.seriesName === '温度' ? palette.temp : palette.humid;
          const unit = p.seriesName === '温度' ? '°C' : '%';
          s += `<div style="margin:2px 0"><span style="display:inline-block;width:8px;height:8px;border-radius:50%;background:${color};margin-right:6px"></span>${p.seriesName} <b style="color:${palette.textPrimary}">${p.value}${unit}</b></div>`;
        });
        return s;
      },
    },
    legend: {
      ...chartTheme.legend,
      data: ['温度', '湿度'],
      top: 8,
      right: 16,
    },
    grid: { top: 44, right: 48, bottom: 28, left: 44 },
    xAxis: {
      type: 'category' as const,
      data: displayTimes,
      boundaryGap: true,
      ...chartTheme.categoryAxis,
      axisLabel: { ...chartTheme.categoryAxis.axisLabel, interval: 4 },
    },
    yAxis: [
      {
        type: 'value' as const,
        name: '°C',
        nameTextStyle: { color: palette.temp, fontSize: 10, padding: [0, 22, 0, 0] },
        position: 'left' as const,
        axisLine: { show: false },
        axisTick: { show: false },
        axisLabel: { color: palette.textMuted, fontSize: 10 },
        splitLine: { lineStyle: { color: 'rgba(255,255,255,0.04)', type: 'dashed' as const } },
        min: (value: { min: number; max: number }) => Math.floor(value.min - 2),
        max: (value: { min: number; max: number }) => Math.ceil(value.max + 2),
      },
      {
        type: 'value' as const,
        name: '%',
        nameTextStyle: { color: palette.humid, fontSize: 10, padding: [0, 0, 0, 18] },
        position: 'right' as const,
        axisLine: { show: false },
        axisTick: { show: false },
        axisLabel: { color: palette.textMuted, fontSize: 10 },
        splitLine: { show: false },
        min: 0,
        max: 100,
      },
    ],
    series: [
      {
        name: '湿度',
        type: 'bar' as const,
        yAxisIndex: 1,
        barWidth: '50%',
        barMaxWidth: 14,
        itemStyle: {
          borderRadius: [3, 3, 0, 0],
          color: palette.humid,
          opacity: 0.5,
        },
        emphasis: {
          itemStyle: { color: palette.humid, opacity: 0.8 },
        },
        data: displayHumids,
        animationDuration: 1200,
      },
      {
        name: '温度',
        type: 'line' as const,
        yAxisIndex: 0,
        smooth: true,
        symbol: 'circle' as const,
        symbolSize: 5,
        showSymbol: false,
        zlevel: 2,
        data: displayTemps,
        lineStyle: { width: 2.5, color: palette.temp },
        itemStyle: { color: palette.temp, borderColor: palette.cardBg, borderWidth: 2 },
        areaStyle: { color: areaGradient(palette.temp) },
        animationDuration: 1500,
      },
    ],
    animationDuration: 1500,
  };

  return (
    <div className="card p-4 h-full flex flex-col">
      <div className="section-title mb-2" style={{ '--accent': 'var(--color-temp)' } as React.CSSProperties}>
        温湿度双轴监测
      </div>
      <div className="flex-1 min-h-0">
        <ChartCanvas option={option} />
      </div>
    </div>
  );
}

function LoadingPlaceholder() {
  return (
    <div className="card p-4 h-full flex items-center justify-center">
      <div className="text-[12px]" style={{ color: 'var(--text-muted)' }}>加载中...</div>
    </div>
  );
}
8.9 PressureChart:多指标趋势(气压 + 温度 + 湿度)
要点:三 Y 轴,气压主线 + 温度 / 湿度参考线。
tsx
/**
 * 多指标趋势 - ECharts 6
 * 三轴:气压 hPa(左)、温度 °C(中)、湿度 %(右)
 * 数据降级保障:缺少数据时基于当前值生成
 */

import type { WeatherData } from '../../../api/services/weatherService';
import ChartCanvas from '@/components/EChartsWrapper/ChartCanvas';
import { chartTheme, areaGradient, palette } from '@/lib/chartTheme';

interface PressureChartProps {
  data: WeatherData | null;
  loading: boolean;
}

function safeGetPressureData(data: WeatherData | null) {
  const rawTimes = data?.hourly.time?.map(t => t.slice(11, 16)) || [];
  const pressures = data?.hourly.pressure || [];
  const temperatures = data?.hourly.temperature || [];
  const humidities = data?.hourly.humidity || [];

  if (pressures.length >= 24 && rawTimes.length >= 24) {
    return {
      times: rawTimes,
      pressures: pressures.slice(0, 24),
      temperatures: temperatures.length >= 24 ? temperatures.slice(0, 24) : null,
      humidities: humidities.length >= 24 ? humidities.slice(0, 24) : null,
    };
  }

  const base = data?.current.pressure ?? 860;
  const times = Array.from({ length: 24 }, (_, i) => `${String(i).padStart(2, '0')}:00`);
  const pressuresFallback = Array.from({ length: 24 }, () => base + (Math.random() - 0.5) * 4);
  return { times, pressures: pressuresFallback, temperatures: null, humidities: null };
}

export default function PressureChart({ data, loading }: PressureChartProps) {
  const { times, pressures, temperatures, humidities } = safeGetPressureData(data);

  if (loading) return <LoadingPlaceholder />;

  const option = {
    ...chartTheme,
    legend: {
      ...chartTheme.legend,
      data: ['气压', '温度', '湿度'],
      top: 8,
      right: 16,
    },
    grid: { top: 44, right: 48, bottom: 28, left: 44 },
    tooltip: {
      ...chartTheme.tooltip,
      trigger: 'axis',
      axisPointer: { type: 'cross' as const, lineStyle: { color: palette.border } },
    },
    title: {
      ...chartTheme.title,
      text: '多指标趋势',
      left: 16,
      top: 8,
    },
    xAxis: {
      type: 'category' as const,
      data: times,
      boundaryGap: false,
      ...chartTheme.categoryAxis,
      axisLabel: { ...chartTheme.categoryAxis.axisLabel, interval: 4 },
    },
    yAxis: [
      {
        type: 'value' as const,
        name: 'hPa',
        nameTextStyle: { color: palette.pressure, fontSize: 10 },
        position: 'left' as const,
        axisLine: { show: false },
        axisTick: { show: false },
        axisLabel: { color: palette.textMuted, fontSize: 10 },
        splitLine: { lineStyle: { color: 'rgba(255,255,255,0.04)', type: 'dashed' as const } },
        min: (value: { min: number; max: number }) => Math.floor(value.min - 5),
        max: (value: { min: number; max: number }) => Math.ceil(value.max + 5),
      },
      {
        type: 'value' as const,
        position: 'right' as const,
        name: '°C',
        nameTextStyle: { color: palette.temp, fontSize: 10 },
        offset: 0,
        axisLine: { show: false },
        axisTick: { show: false },
        axisLabel: { color: palette.textMuted, fontSize: 10 },
        splitLine: { show: false },
        min: (value: { min: number; max: number }) => Math.floor(value.min - 2),
        max: (value: { min: number; max: number }) => Math.ceil(value.max + 2),
      },
      {
        type: 'value' as const,
        position: 'right' as const,
        name: '%',
        nameTextStyle: { color: palette.humid, fontSize: 10 },
        offset: 45,
        axisLine: { show: false },
        axisTick: { show: false },
        axisLabel: { color: palette.textMuted, fontSize: 10 },
        splitLine: { show: false },
        min: 0,
        max: 100,
      },
    ],
    series: [
      {
        name: '气压',
        type: 'line' as const,
        smooth: true,
        yAxisIndex: 0,
        symbol: 'none' as const,
        data: pressures,
        lineStyle: { width: 2.5, color: palette.pressure },
        areaStyle: { color: areaGradient(palette.pressure) },
        emphasis: { focus: 'series' as const },
      },
      {
        name: '温度',
        type: 'line' as const,
        smooth: true,
        yAxisIndex: 1,
        symbol: 'none' as const,
        data: temperatures,
        lineStyle: { width: 2, color: palette.temp, type: 'dashed' as const },
        emphasis: { focus: 'series' as const },
      },
      {
        name: '湿度',
        type: 'line' as const,
        smooth: true,
        yAxisIndex: 2,
        symbol: 'none' as const,
        data: humidities,
        lineStyle: { width: 2, color: palette.humid, type: 'dotted' as const },
        emphasis: { focus: 'series' as const },
      },
    ],
    animationDuration: 1500,
  };

  return (
    <div className="card p-4 h-full flex flex-col">
      <div className="flex-1 min-h-0">
        <ChartCanvas option={option} />
      </div>
    </div>
  );
}

function LoadingPlaceholder() {
  return (
    <div className="card p-4 h-full flex items-center justify-center">
      <div className="text-[12px]" style={{ color: 'var(--text-muted)' }}>加载中...</div>
    </div>
  );
}
8.10 RadarChart:气象综合雷达图
要点:把不同量纲的指标归一化到 0~100。
tsx
/**
 * 气象综合分析 - ECharts 6
 * 基于真实数据归一化展示多维气象指标
 * 数据降级保障:使用当前值生成合理数据
 */

import type { WeatherData } from '../../../api/services/weatherService';
import ChartCanvas from '@/components/EChartsWrapper/ChartCanvas';
import { palette } from '@/lib/chartTheme';

interface RadarChartProps {
  data: WeatherData | null;
  loading: boolean;
}

function normalizeMetrics(data: WeatherData | null) {
  if (!data) {
    return [50, 50, 50, 50, 30, 50];
  }
  const temp = ((data.current.temperature + 20) / 60) * 100;
  const humidity = data.current.humidity;
  const wind = (data.current.windSpeed / 20) * 100;
  const pressure = ((data.current.pressure - 850) / 30) * 100;
  const rain = (data.current.precipitation / 10) * 100;
  const windDir = (data.current.windDirection / 360) * 100;
  return [
    Math.max(0, Math.min(100, temp)),
    Math.max(0, Math.min(100, humidity)),
    Math.max(0, Math.min(100, wind)),
    Math.max(0, Math.min(100, pressure)),
    Math.max(0, Math.min(100, rain)),
    Math.max(0, Math.min(100, windDir)),
  ];
}

export default function RadarChart({ data, loading }: RadarChartProps) {
  if (loading) return <LoadingPlaceholder />;

  const values = normalizeMetrics(data);

  const option = {
    backgroundColor: 'transparent',
    textStyle: { color: palette.textSecondary, fontSize: 11 },
    title: {
      text: '气象综合分析',
      left: 16,
      top: 8,
      textStyle: { color: palette.textPrimary, fontSize: 13, fontWeight: 600 },
    },
    tooltip: {
      backgroundColor: 'rgba(6, 10, 20, 0.92)',
      borderColor: palette.cardBorder,
      borderWidth: 1,
      textStyle: { color: palette.textPrimary, fontSize: 12 },
      extraCssText: 'box-shadow: 0 4px 20px rgba(0,0,0,.6); border-radius: 6px;',
      trigger: 'item',
      confine: true,
    },
    legend: {
      data: ['当前气象状态'],
      top: 8,
      right: 16,
      textStyle: { color: palette.textSecondary, fontSize: 10 },
      itemWidth: 10,
      itemHeight: 6,
    },
    radar: {
      indicator: [
        { name: '温度', max: 100 },
        { name: '湿度', max: 100 },
        { name: '风速', max: 100 },
        { name: '气压', max: 100 },
        { name: '降水', max: 100 },
        { name: '风向', max: 100 },
      ],
      shape: 'polygon' as const,
      center: ['50%', '56%'],
      radius: '62%',
      splitNumber: 4,
      axisName: { color: palette.textSecondary, fontSize: 10, fontWeight: 500 },
      splitArea: { areaStyle: { color: ['rgba(0, 224, 255, 0.02)', 'rgba(0, 224, 255, 0.04)'] } },
      axisLine: { lineStyle: { color: palette.border } },
      splitLine: { lineStyle: { color: palette.border } },
    },
    series: [
      {
        type: 'radar' as const,
        data: [
          {
            value: values,
            name: '当前气象状态',
            symbol: 'circle' as const,
            symbolSize: 6,
            lineStyle: { width: 2.5, color: palette.primary, shadowColor: palette.primary, shadowBlur: 10 },
            areaStyle: { color: 'rgba(0, 224, 255, 0.18)' },
            itemStyle: { color: palette.primary, borderColor: palette.cardBg, borderWidth: 2 },
          },
        ],
      },
    ],
    animationDuration: 1500,
  };

  return (
    <div className="card p-4 h-full flex flex-col">
      <div className="flex-1 min-h-0">
        <ChartCanvas option={option} />
      </div>
    </div>
  );
}

function LoadingPlaceholder() {
  return (
    <div className="card p-4 h-full flex items-center justify-center">
      <div className="text-[12px]" style={{ color: 'var(--text-muted)' }}>加载中...</div>
    </div>
  );
}
8.11 WindRoseChart:风向玫瑰图
要点:16 方位角度,按风速累计 + 极坐标柱状。
tsx
/**
 * 风速风向玫瑰图 - ECharts 6
 * 关键:ECharts 6 polar 坐标必须完整定义 angleAxis + radiusAxis
 * 数据降级保障:当缺少逐小时风数据时基于当前值生成
 */

import type { WeatherData } from '../../../api/services/weatherService';
import ChartCanvas from '@/components/EChartsWrapper/ChartCanvas';
import { palette, windRosePalette } from '@/lib/chartTheme';

interface WindRoseChartProps {
  data: WeatherData | null;
  loading: boolean;
}

// 风向标签(8方位)
const WIND_DIRECTIONS = ['北', '东北', '东', '东南', '南', '西南', '西', '西北'];

function getDirectionIndex(degrees: number): number {
  // 8 方位,每个方位 45 度
  const normalized = ((degrees + 22.5) % 360) / 45;
  return Math.floor(normalized) % 8;
}

function safeGetWindRoseData(data: WeatherData | null): number[] {
  const windDirs = data?.hourly.windDirection;
  const windSpeeds = data?.hourly.windSpeed;

  if (windDirs && windSpeeds && windDirs.length > 0 && windSpeeds.length > 0) {
    const buckets = new Array(8).fill(0);
    const counts = new Array(8).fill(0);
    for (let i = 0; i < windDirs.length; i++) {
      const idx = getDirectionIndex(windDirs[i]);
      buckets[idx] += windSpeeds[i];
      counts[idx]++;
    }
    // 平均风速
    return buckets.map((sum, i) => counts[i] > 0 ? sum / counts[i] : 0);
  }

  const currentSpeed = data?.current.windSpeed ?? 5;
  return Array.from({ length: 8 }, (_, i) => {
    const offset = Math.abs(i - getDirectionIndex(data?.current.windDirection ?? 0));
    return Math.max(0, currentSpeed * (1 - offset * 0.15) * (0.5 + Math.random() * 0.5));
  });
}

export default function WindRoseChart({ data, loading }: WindRoseChartProps) {
  const buckets = safeGetWindRoseData(data);
  const maxValue = Math.max(...buckets, 1);

  if (loading) return <LoadingPlaceholder />;

  // ECharts 6 关键修复:polar 必须有 radiusAxis + angleAxis,两个都明确指定 type
  const option = {
    backgroundColor: 'transparent',
    textStyle: { color: palette.textSecondary, fontSize: 11 },
    title: {
      text: '风向风速玫瑰',
      left: 16,
      top: 8,
      textStyle: { color: palette.textPrimary, fontSize: 13, fontWeight: 600 },
    },
    tooltip: {
      backgroundColor: 'rgba(6, 10, 20, 0.92)',
      borderColor: palette.cardBorder,
      borderWidth: 1,
      textStyle: { color: palette.textPrimary, fontSize: 12 },
      extraCssText: 'box-shadow: 0 4px 20px rgba(0,0,0,.6); border-radius: 6px;',
      trigger: 'item',
      formatter: (params: unknown) => {
        const p = params as { dataIndex: number; value: number }
        return `<div style="font-size:11px;color:${palette.textMuted};margin-bottom:4px">${WIND_DIRECTIONS[p.dataIndex]}</div>
                <div><b style="color:${palette.textPrimary}">${Number(p.value).toFixed(1)} km/h</b></div>`
      },
    },
    // 极坐标系统(ECharts 6 要求明确 axis 类型)
    polar: {
      center: ['50%', '56%'],
      radius: '64%',
    },
    angleAxis: {
      type: 'category' as const,
      data: WIND_DIRECTIONS,
      startAngle: 90,
      axisLine: { show: true, lineStyle: { color: palette.border } },
      axisTick: { show: false },
      axisLabel: { color: palette.textMuted, fontSize: 10 },
    },
    radiusAxis: {
      type: 'value' as const,
      min: 0,
      max: Math.ceil(maxValue * 1.2),
      axisLine: { show: false },
      axisTick: { show: false },
      axisLabel: { show: false },
      splitLine: { lineStyle: { color: 'rgba(255,255,255,0.06)', type: 'dashed' as const } },
    },
    series: [{
      name: '风速',
      type: 'bar' as const,
      data: buckets.map((v, i) => ({
        value: v,
        itemStyle: {
          color: windRosePalette[i],
          shadowColor: windRosePalette[i] + '66',
          shadowBlur: 6,
        },
      })),
      coordinateSystem: 'polar' as const,
      roundCap: true,
      barWidth: '60%',
      emphasis: {
        itemStyle: { shadowBlur: 12, shadowColor: palette.primary + '66' },
      },
    }],
    animationDuration: 1200,
  };

  return (
    <div className="card p-4 h-full flex flex-col">
      <div className="flex-1 min-h-0">
        <ChartCanvas option={option} />
      </div>
    </div>
  );
}

function LoadingPlaceholder() {
  return (
    <div className="card p-4 h-full flex items-center justify-center">
      <div className="text-[12px]" style={{ color: 'var(--text-muted)' }}>加载中...</div>
    </div>
  );
}
8.12 ScatterChart:温湿度相关性散点图
tsx
/**
 * 温湿度相关性散点图 - ECharts 6
 * 数据降级保障:缺少数据时基于当前值生成
 */

import type { WeatherData } from '../../../api/services/weatherService';
import ChartCanvas from '@/components/EChartsWrapper/ChartCanvas';
import { chartTheme, palette } from '@/lib/chartTheme';

interface ScatterChartProps {
  data: WeatherData | null;
  loading: boolean;
}

function safeGetScatterData(data: WeatherData | null) {
  const temps = data?.hourly.temperature || [];
  const humids = data?.hourly.humidity || [];
  if (temps.length > 0 && humids.length > 0) {
    return temps.map((t, i) => [t, humids[i]]);
  }
  const base = data?.current.temperature ?? 20;
  return Array.from({ length: 24 }, () => {
    const t = base + (Math.random() - 0.5) * 6;
    const h = 50 + (Math.random() - 0.5) * 30;
    return [Math.round(t * 10) / 10, Math.round(h)];
  });
}

export default function ScatterChart({ data, loading }: ScatterChartProps) {
  const points = safeGetScatterData(data);

  if (loading) return <LoadingPlaceholder />;

  const option = {
    ...chartTheme,
    grid: { top: 40, right: 16, bottom: 32, left: 44 },
    title: {
      ...chartTheme.title,
      text: '温湿度相关性',
      left: 16,
      top: 8,
    },
    tooltip: {
      ...chartTheme.tooltip,
      trigger: 'item',
      formatter: (params: unknown) => {
        const p = params as { value: [number, number] }
        return `<b style="color:${palette.textPrimary}">${p.value[0]}°C</b>, <b style="color:${palette.textPrimary}">${p.value[1]}%</b>`
      },
    },
    xAxis: {
      type: 'value' as const,
      name: '°C',
      nameTextStyle: { color: palette.textFaint, fontSize: 10, padding: [0, 25, 0, 0] },
      nameLocation: 'end',
      ...chartTheme.valueAxis,
    },
    yAxis: {
      type: 'value' as const,
      name: '%',
      nameTextStyle: { color: palette.textFaint, fontSize: 10, padding: [0, 0, 0, 30] },
      nameLocation: 'end',
      ...chartTheme.valueAxis,
    },
    series: [{
      type: 'scatter' as const,
      data: points,
      symbolSize: 8,
      itemStyle: { color: palette.humid, opacity: 0.65, borderColor: palette.cardBg, borderWidth: 1 },
      emphasis: { itemStyle: { color: palette.primary, opacity: 1, shadowBlur: 10, shadowColor: palette.primary + '88' } },
    }],
    animationDuration: 1200,
  };

  return (
    <div className="card p-4 h-full flex flex-col">
      <div className="flex-1 min-h-0">
        <ChartCanvas option={option} />
      </div>
    </div>
  );
}

function LoadingPlaceholder() {
  return (
    <div className="card p-4 h-full flex items-center justify-center">
      <div className="text-[12px]" style={{ color: 'var(--text-muted)' }}>加载中...</div>
    </div>
  );
}
第 9 章 前端:页面拼装与三栏布局
9.1 src/App.tsx:三栏 + 底部通栏布局
tsx
/**
 * 乌兰察布市实时气象数据可视化大屏 - 深色科技风
 *
 * 三栏指挥中心布局:
 * - Header: 顶部固定导航栏
 * - Main: 三栏 (左 | 中 | 右) + 底部通栏
 *   - 左栏:  4 个 KPI 指标卡 + 风向玫瑰
 *   - 中栏:  温度大图 (上) + 气象综合雷达 (下)
 *   - 右栏:  空气质量面板 (上) + 温湿度双轴 (下)
 * - 底部通栏: 散点图 (左半) + 降水量 (右半)
 * - Footer: 底部信息条
 */

import { DataProvider, useData } from '@/context/DataContext';
import Header from '@/components/Header/Header';
import WeatherCards from '@/components/WeatherCards/WeatherCards';
import TemperatureChart from '@/components/TemperatureChart/TemperatureChart';
import PrecipitationChart from '@/components/PrecipitationChart/PrecipitationChart';
import TempHumidCombo from '@/components/TempHumidCombo/TempHumidCombo';
import RadarChart from '@/components/RadarChart/RadarChart';
import WindRoseChart from '@/components/WindRoseChart/WindRoseChart';
import ScatterChart from '@/components/ScatterChart/ScatterChart';
import PressureChart from '@/components/PressureChart/PressureChart';
import AirQualityPanel from '@/components/AirQualityPanel/AirQualityPanel';
import Footer from '@/components/Footer/Footer';

export default function App() {
  return (
    <DataProvider>
      <AppContent />
    </DataProvider>
  );
}

function AppContent() {
  const { weather, airQuality, loading } = useData();

  return (
    <div className="w-full h-full flex flex-col" style={{ background: 'var(--bg-page)' }}>
      <Header />

      <main
        className="flex-1 p-4 overflow-hidden"
        style={{
          display: 'grid',
          gridTemplateColumns: 'minmax(0, 1fr) minmax(0, 1.4fr) minmax(0, 1fr)',
          gridTemplateRows: 'minmax(0, 1.6fr) minmax(0, 1fr)',
          gridTemplateAreas: `
            "left   center right"
            "bottom bottom bottom"
          `,
          gap: '14px',
          minHeight: 0,
        }}
      >
        {/* ====== 左栏: KPI + 风玫瑰 ====== */}
        <section
          className="min-h-0 flex flex-col"
          style={{
            gridArea: 'left',
            display: 'grid',
            gridTemplateRows: '38% 1fr',
            gap: '14px',
            minHeight: 0,
            overflow: 'hidden',
          }}
        >
          <div className="min-h-0 overflow-hidden">
            <WeatherCards data={weather} loading={loading} />
          </div>
          <div className="min-h-0 overflow-hidden">
            <WindRoseChart data={weather} loading={loading} />
          </div>
        </section>

        {/* ====== 中栏: 温度大图 + 综合雷达 ====== */}
        <section
          className="min-h-0 flex flex-col"
          style={{
            gridArea: 'center',
            display: 'grid',
            gridTemplateRows: 'minmax(0, 1.6fr) minmax(0, 1fr)',
            gap: '14px',
            minHeight: 0,
            overflow: 'hidden',
          }}
        >
          <div className="min-h-0 overflow-hidden">
            <TemperatureChart data={weather} loading={loading} />
          </div>
          <div className="min-h-0 overflow-hidden">
            <RadarChart data={weather} loading={loading} />
          </div>
        </section>

        {/* ====== 右栏: 空气质量 + 温湿度双轴 ====== */}
        <section
          className="min-h-0 flex flex-col"
          style={{
            gridArea: 'right',
            display: 'grid',
            gridTemplateRows: '55% 1fr',
            gap: '14px',
            minHeight: 0,
            overflow: 'hidden',
          }}
        >
          <div className="min-h-0 overflow-hidden">
            <AirQualityPanel loading={loading} />
          </div>
          <div className="min-h-0 overflow-hidden">
            <TempHumidCombo data={weather} loading={loading} />
          </div>
        </section>

        {/* ====== 底部通栏: 气压多指标 + 散点 + 降水 ====== */}
        <section
          className="min-h-0"
          style={{
            gridArea: 'bottom',
            display: 'grid',
            gridTemplateColumns: 'minmax(0, 1.4fr) minmax(0, 1fr) minmax(0, 1fr)',
            gap: '14px',
            minHeight: 0,
            overflow: 'hidden',
          }}
        >
          <div className="min-h-0 overflow-hidden">
            <PressureChart data={weather} loading={loading} />
          </div>
          <div className="min-h-0 overflow-hidden">
            <ScatterChart data={weather} loading={loading} />
          </div>
          <div className="min-h-0 overflow-hidden">
            <PrecipitationChart data={weather} loading={loading} />
          </div>
        </section>
      </main>

      <Footer
        weatherUpdatedAt={weather?.updatedAt}
        airQualityUpdatedAt={airQuality?.updatedAt}
      />
    </div>
  );
}
9.2 数据流总结
DataProvider (Context)
  ├─> SSE 订阅 /api/stream
  ├─> REST 兜底 /api/weather + /api/air-quality
  └─> 提供 { weather, airQuality, loading, refreshData }

useData() Hook
  ├─> Header (状态指示)
  ├─> WeatherCards (KPI 指标)
  ├─> TemperatureChart / PrecipitationChart / TempHumidCombo
  ├─> PressureChart / ScatterChart / RadarChart / WindRoseChart
  ├─> AirQualityPanel (空气质量)
  └─> Footer (更新时间)
第 10 章 启动、调试与常见问题
10.1 启动
bash
npm install
npm run dev
预期日志:
[0] VITE v8.x.x  ready in xxx ms
[0] ➜  Local: http://127.0.0.1:5173/
[1] Server ready on port 3001
[1] 正在初始化数据...
[1] 气象数据刷新成功
[1] 空气质量数据刷新成功
[1] 定时任务已配置: 每3分钟刷新数据
10.2 验证清单
| 检查项 | 操作 | 期望 |
|---|---|---|
| 健康检查 | curl http://localhost:3001/api/health |
success: true |
| 气象 REST | curl http://localhost:3001/api/weather |
success: true,含 current 与 hourly |
| 空气质量 REST | curl http://localhost:3001/api/air-quality |
success: true,含 AQI / PM2.5 等 |
| SSE 推送 | curl -N http://localhost:3001/api/stream |
立刻看到 event: weather / event: air-quality |
| 浏览器 Network | Filter: EventStream | 出现 stream 请求持续接收 |
10.3 常见问题
Q1:EADDRINUSE: address already in use :::3001
A:另一个进程占用了 3001。Windows:
powershell
Get-NetTCPConnection -LocalPort 3001 | ForEach-Object { Stop-Process -Id $_.OwningProcess -Force }Q2:前端 5173 打开是空白页
A:大概率后端没起来,F12 看控制台是否报 Failed to fetch /api/...。先确认 3001 健康检查返回 200。
Q3:PM2.5 显示 0
A:Open-Meteo 空气质量接口偶发失败时会回退到「全 0 占位」。可换时段再访问,或在 .env 加代理。
Q4:字体没生效
A:检查 index.css 顶部 Google Fonts 的 @import;或在内网环境替换为本地字体。
Q5:SSE 在某些反代会断
A:服务端每 25s 发送注释行作为心跳;如仍断,可在前端 hook 把重试退避时间调短。
Q6:ECharts 图表不显示
A:检查容器是否有明确尺寸(width: 100%; height: 100%),ChartCanvas 使用 ResizeObserver 确保容器有尺寸才渲染。
附录 A:完整文件清单
.
├── api/
│   ├── app.ts                         # Express 5 应用工厂 + cron + SSE
│   ├── server.ts                      # 本地启动入口
│   ├── index.ts                       # Vercel Serverless 入口
│   ├── routes/
│   │   ├── airQuality.ts              # GET /api/air-quality
│   │   ├── auth.ts                    # 教学扩展:登录 / 注册 / 登出占位
│   │   └── weather.ts                 # GET /api/weather
│   ├── services/
│   │   ├── airQualityService.ts       # 空气质量采集 + 缓存 + 降级
│   │   └── weatherService.ts          # 气象采集 + 缓存 + 字段映射
│   └── sse/
│       └── broadcaster.ts             # SSE 客户端集合 + 心跳 + 广播
├── src/
│   ├── App.tsx                        # 大屏主布局(三栏 + 底部通栏)
│   ├── index.css                      # 设计系统:变量、动画、深色科技风
│   ├── main.tsx                       # React 入口
│   ├── vite-env.d.ts
│   ├── components/
│   │   ├── Footer/Footer.tsx          # 底部信息栏
│   │   ├── Header/Header.tsx          # 顶部标题 + 实时时钟
│   │   ├── AirQualityPanel/           # 新增:空气质量监测面板
│   │   ├── EChartsWrapper/            # 新增:自定义 ECharts 6 包装
│   │   │   └── ChartCanvas.tsx
│   │   ├── PrecipitationChart/PrecipitationChart.tsx
│   │   ├── PressureChart/PressureChart.tsx
│   │   ├── RadarChart/RadarChart.tsx
│   │   ├── ScatterChart/ScatterChart.tsx
│   │   ├── TempHumidCombo/TempHumidCombo.tsx
│   │   ├── TemperatureChart/TemperatureChart.tsx
│   │   ├── WeatherCards/WeatherCards.tsx
│   │   └── WindRoseChart/WindRoseChart.tsx
│   ├── context/                       # 新增:统一数据管理
│   │   └── DataContext.tsx            # React 19 Context + use() hook
│   ├── lib/
│   │   ├── useSse.ts                  # 通用 SSE hook(备用)
│   │   ├── chartTheme.ts              # ECharts 6 主题与色板
│   │   └── utils.ts                   # cn() 合并 className
│   ├── pages/
│   │   └── Home.tsx
│   └── assets/react.svg
├── public/favicon.svg
├── index.html
├── package.json
├── tsconfig.json
├── vite.config.ts
├── eslint.config.js                   # ESLint 9 flat config
└── nodemon.json
附录 B:教学任务卡(课后练习)
- 基础 :把默认端口 3001 改成环境变量
.env读取,并解释为什么这样做。 - 进阶 :增加一个
/api/cities/:lat,:lon接口,根据传入坐标返回该地当前气象,前端做一个城市切换下拉框。 - 挑战 :把 SSE 广播换成 WebSocket(
ws库),实现双向通信(前端可下发「刷新」指令)。 - 拓展 :把所有图表的颜色与设计系统颜色变量(
--brand-*)绑定,演示「主题切换」。 - 实战 :部署到 Vercel,让 Cron 改成 Vercel Cron Jobs(参考
vercel.json)。
教学寄语:本项目是一个真实的「数据 → 接口 → 缓存 → 推送 → 可视化」完整闭环。建议教师按章节演示 + 学生按章节复刻,每章结束让学生用 5 分钟口述数据流走向,从「看得见」到「讲得出」。