背景:可以快速的加载出面和多面的地理数据信息,在测试的时候,有时候需要知道数据具体在那一块,然后进行一些相关内容的判断时候可以用,具体如下:
效果如下:
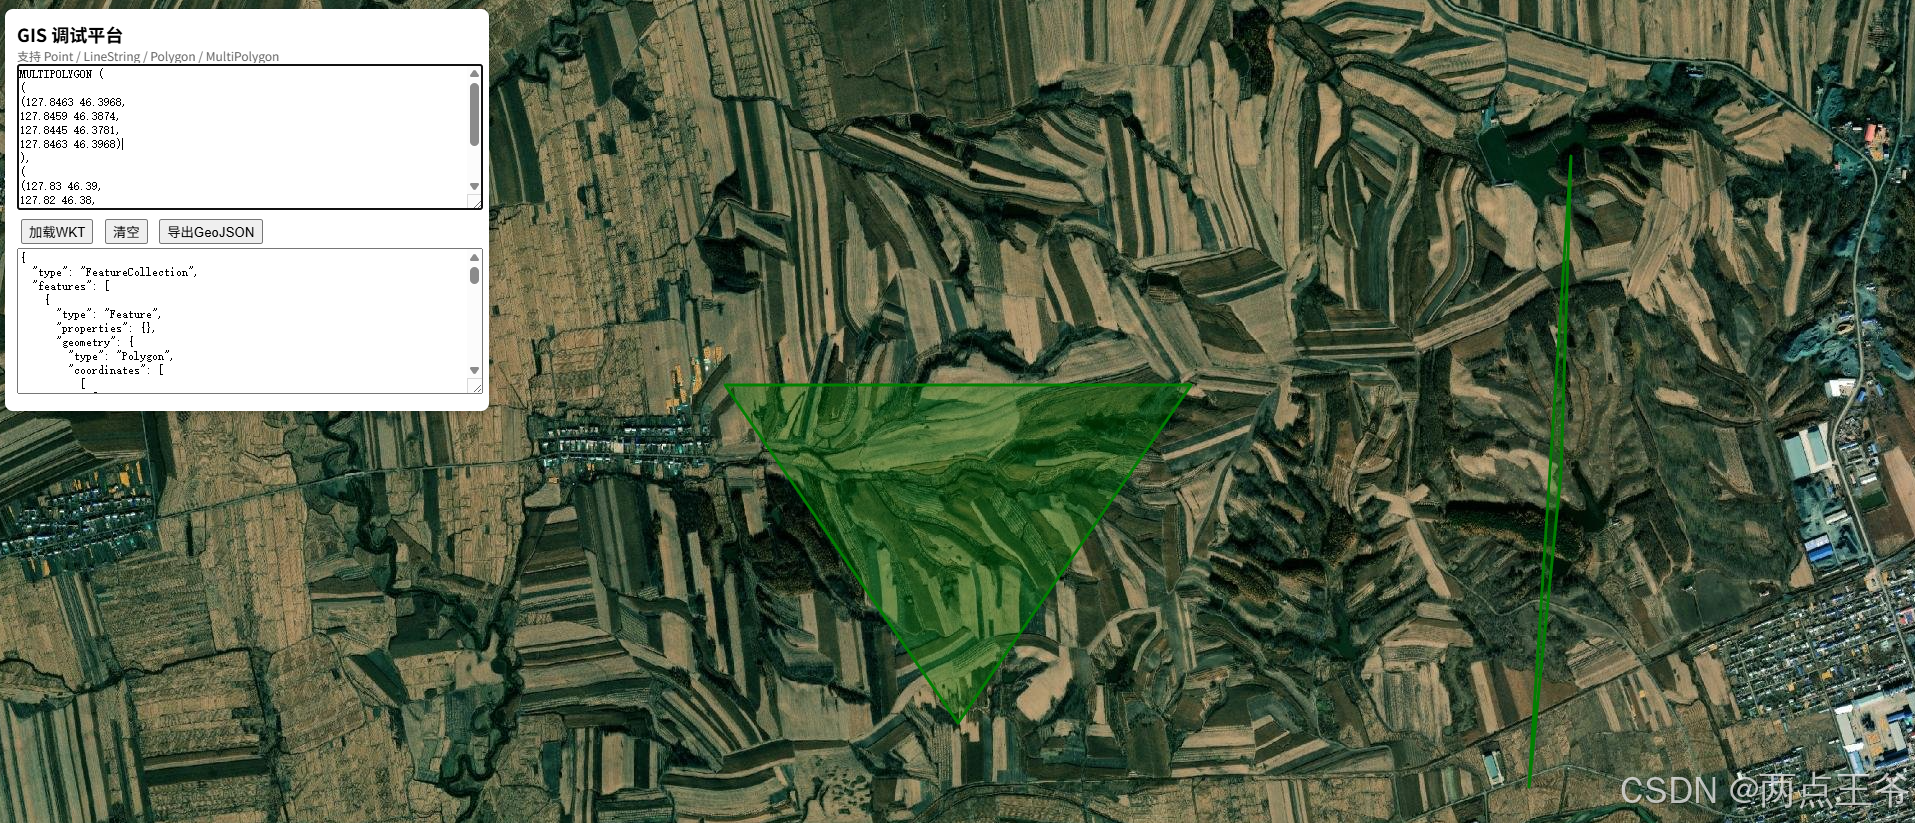
代码具体如下:
html
<!DOCTYPE html>
<html lang="zh">
<head>
<meta charset="UTF-8">
<title>
GIS 调试平台
</title>
<link
rel="stylesheet"
href="https://unpkg.com/leaflet@1.9.4/dist/leaflet.css"
/>
<link
rel="stylesheet"
href="https://unpkg.com/leaflet-draw@1.0.4/dist/leaflet.draw.css"
/>
<style>
html,body{
    margin:0;
    padding:0;
}
#map{
    width:100%;
    height:100vh;
}
.panel{
    position:absolute;
    top:10px;
    left:10px;
    width:460px;
    z-index:9999;
    background:white;
    padding:12px;
    border-radius:8px;
    box-shadow:
    0 2px 10px rgba(0,0,0,.3);
}
textarea{
    width:100%;
    height:140px;
    font-size:12px;
}
button{
    margin:4px;
}
.title{
    font-size:18px;
    font-weight:bold;
}
.small{
    color:#666;
    font-size:12px;
}
</style>
</head>
<body>
    <div id="map"></div>
    <div class="panel">
        <div class="title">
GIS 调试平台
        </div>
        <div class="small">
支持 Point / LineString / Polygon / MultiPolygon
        </div>
<textarea id="input">
MULTIPOLYGON (
(
(127.8463 46.3968,
127.8459 46.3874,
127.8445 46.3781,
127.8463 46.3968)
),
(
(127.83 46.39,
127.82 46.38,
127.81 46.39,
127.83 46.39)
)
)
</textarea>
<br>
<button onclick="loadData()">
加载WKT
</button>
<button onclick="clearAll()">
清空
</button>
<button onclick="exportGeoJSON()">
导出GeoJSON
</button>
<textarea id="output"></textarea>
    </div>
<script src="https://unpkg.com/leaflet@1.9.4/dist/leaflet.js"></script>
<script src="https://unpkg.com/leaflet-draw@1.0.4/dist/leaflet.draw.js"></script>
<script>
/**
 * 初始化地图
 */
const map =
L.map('map')
.setView(
    [30,120],
    5
);
/**
 * ArcGIS影像
 */
L.tileLayer(
'https://server.arcgisonline.com/ArcGIS/rest/services/World_Imagery/MapServer/tile/{z}/{y}/{x}',
{
    maxZoom:19
}
).addTo(map);
/**
 * 数据图层
 */
const drawnItems =
new L.FeatureGroup();
map.addLayer(drawnItems);
/**
 * 绘制工具
 */
const drawControl =
new L.Control.Draw({
edit:{
featureGroup:drawnItems
},
draw:{
polygon:true,
polyline:true,
marker:true,
rectangle:true,
circle:false,
circlemarker:false
}
});
map.addControl(drawControl);
/**
 * 绘制完成
 */
map.on(
L.Draw.Event.CREATED,
function(e){
drawnItems.addLayer(e.layer);
syncOutput();
});
map.on(
"draw:edited",
syncOutput
);
map.on(
"draw:deleted",
syncOutput
);
/**
 * 坐标解析
 */
function parseLine(str){
return str
.trim()
.split(",")
.map(item=>{
let arr =
item
.trim()
.split(/\s+/)
.map(Number);
return [
arr[1],
arr[0]
];
});
}
/**
 * POINT
 */
function loadPoint(wkt){
let body =
wkt
.replace(/^POINT\s*/i,'')
.replace(/[()]/g,'');
let arr =
body
.trim()
.split(/\s+/)
.map(Number);
let marker =
L.marker(
[
arr[1],
arr[0]
]
);
drawnItems.addLayer(marker);
map.setView(
[
arr[1],
arr[0]
],
14
);
}
/**
 * LINESTRING
 */
function loadLine(wkt){
let body =
wkt
.replace(/^LINESTRING\s*/i,'')
.replace(/[()]/g,'');
let line =
L.polyline(
parseLine(body),
{
color:'red',
weight:3
}
);
drawnItems.addLayer(line);
map.fitBounds(
line.getBounds()
);
}
/**
 * POLYGON
 */
function loadPolygon(wkt){
let body =
wkt
.replace(/^POLYGON\s*/i,'')
.replace(/\(\(/,'')
.replace(/\)\)/,'');
let polygon =
L.polygon(
parseLine(body),
{
color:'blue',
fillOpacity:.3
}
);
drawnItems.addLayer(polygon);
map.fitBounds(
polygon.getBounds()
);
}
/**
 * MULTIPOLYGON解析
 */
function extractMultiPolygons(str){
let result=[];
let depth=0;
let current="";
let polys=[];
for(let c of str){
if(c==='('){
depth++;
if(depth===3)
continue;
}
if(c===')'){
depth--;
if(depth===2){
polys.push(current);
current="";
continue;
}
}
if(depth>=3){
current+=c;
}
}
return polys.map(p=>{
return [
p.replace(/\(|\)/g,'')
];
});
}
function loadMultiPolygon(wkt){
let body =
wkt
.replace(/^MULTIPOLYGON\s*/i,'')
.trim();
let polygons =
extractMultiPolygons(body);
let layers=[];
polygons.forEach(p=>{
let polygon =
L.polygon(
parseLine(p[0]),
{
color:'green',
fillOpacity:.3
}
);
drawnItems.addLayer(polygon);
layers.push(polygon);
});
if(layers.length){
map.fitBounds(
L.featureGroup(layers)
.getBounds()
);
}
}
/**
 * 主加载入口
 */
function loadData(){
let wkt =
document
.getElementById("input")
.value
.trim();
drawnItems.clearLayers();
let type =
wkt
.split(/\s|\(/)[0]
.toUpperCase();
try{
switch(type){
case "POINT":
loadPoint(wkt);
break;
case "LINESTRING":
loadLine(wkt);
break;
case "POLYGON":
loadPolygon(wkt);
break;
case "MULTIPOLYGON":
loadMultiPolygon(wkt);
break;
default:
alert(
"暂不支持:"+type
);
}
syncOutput();
}catch(e){
console.error(e);
alert(
"解析失败:"+e.message
);
}
}
/**
 * 输出GeoJSON
 */
function syncOutput(){
let json =
drawnItems.toGeoJSON();
document
.getElementById("output")
.value =
JSON.stringify(
json,
null,
2
);
}
/**
 * 导出文件
 */
function exportGeoJSON(){
let data =
JSON.stringify(
drawnItems.toGeoJSON(),
null,
2
);
let blob =
new Blob(
[data],
{
type:"application/json"
}
);
let url =
URL.createObjectURL(blob);
let a =
document.createElement("a");
a.href=url;
a.download=
"gis-data.geojson";
a.click();
URL.revokeObjectURL(url);
}
function clearAll(){
drawnItems.clearLayers();
syncOutput();
}
</script>
</body>
</html>
导出手绘GEOJSON数据文件,测试页面:
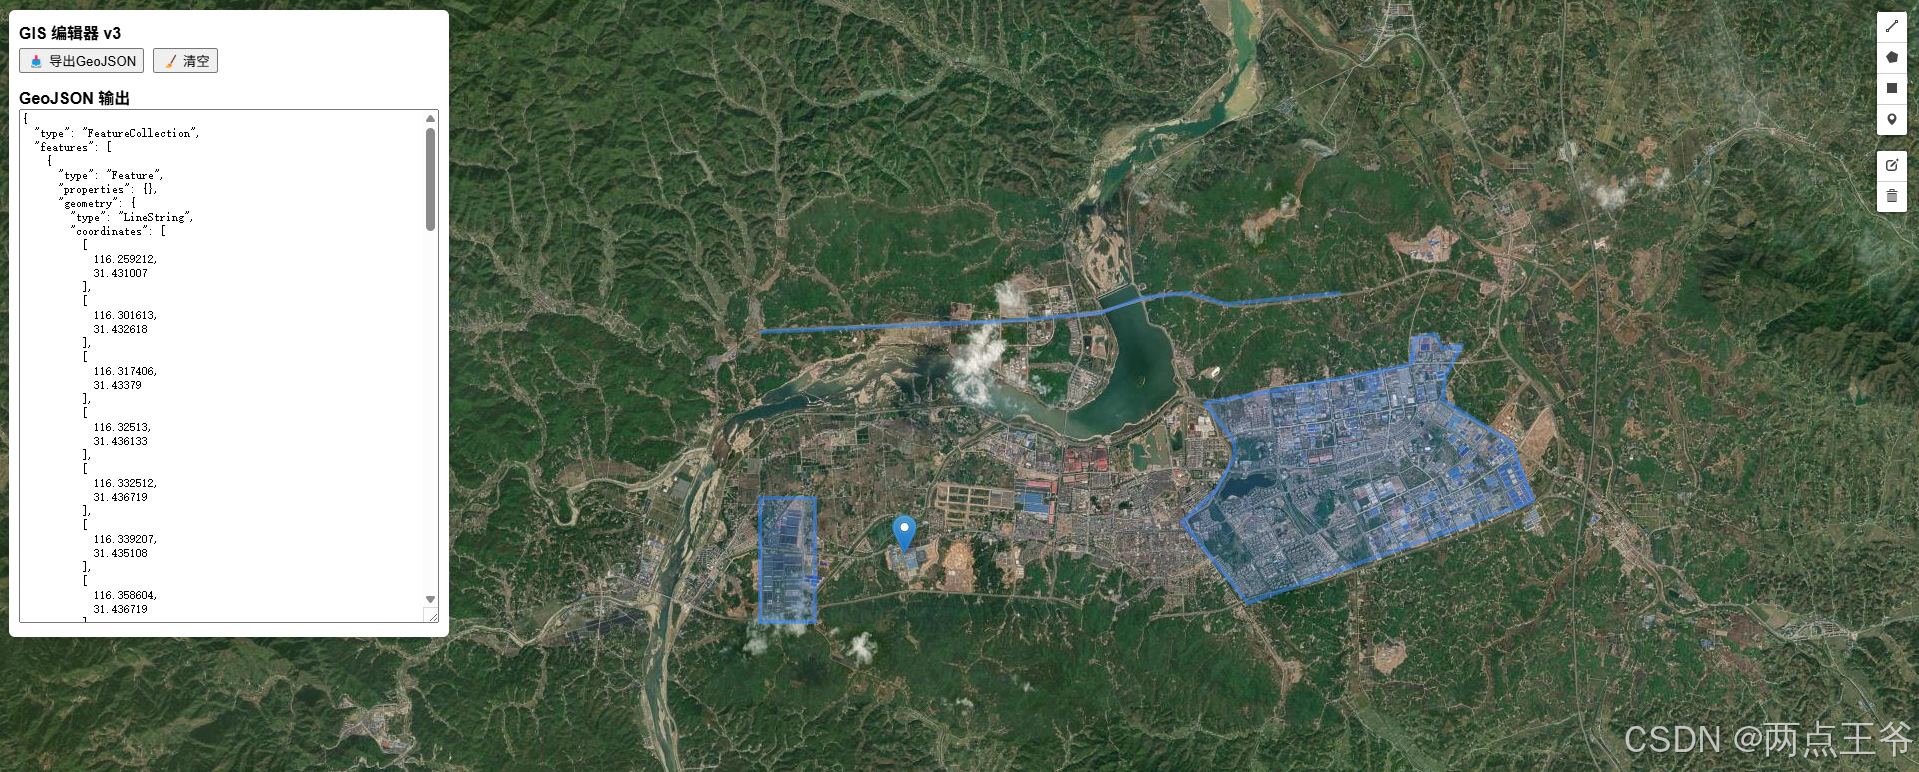
代码如下:
html
<!DOCTYPE html>
<html lang="zh">
<head>
<meta charset="UTF-8" />
<title>GIS 编辑器 v3</title>

<link rel="stylesheet" href="https://unpkg.com/leaflet@1.9.4/dist/leaflet.css"/>
<link rel="stylesheet" href="https://unpkg.com/leaflet-draw@1.0.4/dist/leaflet.draw.css"/>

<style>
body { margin:0; font-family: Arial; }
#map { height: 100vh; }

.panel {
  position: absolute;
  top: 10px;
  left: 10px;
  width: 420px;
  z-index: 9999;
  background: #fff;
  padding: 10px;
  border-radius: 6px;
  box-shadow: 0 2px 10px rgba(0,0,0,.2);
}

button {
  margin: 4px 4px 4px 0;
}

textarea {
  width: 100%;
  height: 120px;
  font-size: 12px;
}
</style>
</head>

<body>

<div id="map"></div>

<div class="panel">
  <b>GIS 编辑器 点、线、面</b>

  <div>
    <button onclick="exportGeoJSON()">📥 导出GeoJSON</button>
    <button onclick="clearAll()">🧹 清空</button>
  </div>

  <div style="margin-top:8px;">
    <b>GeoJSON 输出</b>
    <textarea id="output"></textarea>
  </div>
</div>

<script src="https://unpkg.com/leaflet@1.9.4/dist/leaflet.js"></script>
<script src="https://unpkg.com/leaflet-draw@1.0.4/dist/leaflet.draw.js"></script>

<script>

/* =========================
   1. 初始化地图
========================= */
const map = L.map('map').setView([30, 120], 5);

L.tileLayer(
  'https://server.arcgisonline.com/ArcGIS/rest/services/World_Imagery/MapServer/tile/{z}/{y}/{x}',
  { maxZoom: 19 }
).addTo(map);

/* =========================
   2. 图层管理
========================= */
const drawnItems = new L.FeatureGroup();
map.addLayer(drawnItems);

/* =========================
   3. 绘制工具(核心)
========================= */
const drawControl = new L.Control.Draw({
  position: 'topright',
  edit: {
    featureGroup: drawnItems,
    remove: true
  },
  draw: {
    polygon: {
      allowIntersection: false,
      showArea: true
    },
    polyline: true,
    rectangle: true,
    marker: true,
    circle: false,
    circlemarker: false
  }
});

map.addControl(drawControl);

/* =========================
   4. 绘制完成事件
========================= */
map.on(L.Draw.Event.CREATED, function (event) {
  const layer = event.layer;

  drawnItems.addLayer(layer);

  syncOutput();
});

map.on('draw:edited', syncOutput);
map.on('draw:deleted', syncOutput);

/* =========================
   5. GeoJSON 输出同步
========================= */
function syncOutput(){
  const geojson = drawnItems.toGeoJSON();

  document.getElementById("output").value =
    JSON.stringify(geojson, null, 2);
}

/* =========================
   6. 导出 GeoJSON 文件
========================= */
function exportGeoJSON(){

  const data = drawnItems.toGeoJSON();

  const blob = new Blob(
    [JSON.stringify(data, null, 2)],
    { type: "application/json" }
  );

  const url = URL.createObjectURL(blob);

  const a = document.createElement("a");
  a.href = url;
  a.download = "gis-draw.geojson";
  a.click();

  URL.revokeObjectURL(url);
}

/* =========================
   7. 清空
========================= */
function clearAll(){
  drawnItems.clearLayers();
  syncOutput();
}

/* =========================
   8. 初始化输出
========================= */
syncOutput();

</script>

</body>
</html>
好了,至此就可以实现快速加载点线面数据和导出数据文件了!
加载GEOJSON文件数据内容
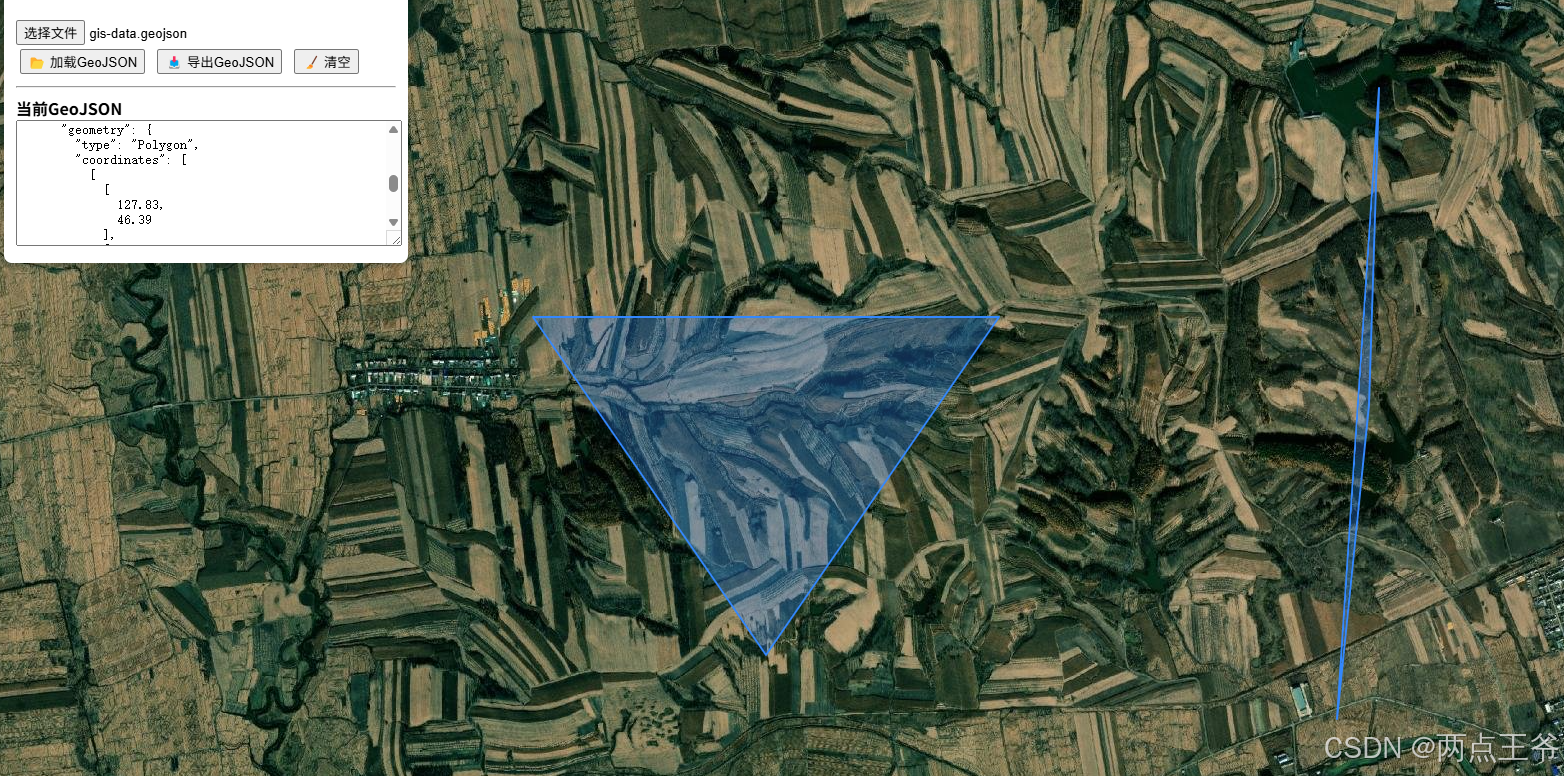
html
<!DOCTYPE html>
<html lang="zh">
<head>
<meta charset="UTF-8">
<title>WebGIS Editor 加载GeoJSON文件</title>
<link rel="stylesheet"
 href="https://unpkg.com/leaflet@1.9.4/dist/leaflet.css">
<link rel="stylesheet"
 href="https://unpkg.com/leaflet-draw@1.0.4/dist/leaflet.draw.css">
<style>
html,body{
    margin:0;
    height:100%;
}
#map{
    width:100%;
    height:100%;
}
.panel{
    position:absolute;
    top:10px;
    left:10px;
    width:380px;
    background:white;
    padding:12px;
    z-index:9999;
    border-radius:8px;
    box-shadow:
    0 2px 10px rgba(0,0,0,.25);
}
button{
    margin:4px;
}
textarea{
    width:100%;
    height:120px;
}
</style>
</head>
<body>
    <div id="map"></div>
    <div class="panel">
        <h3>
 WebGIS 编辑器 v4
        </h3>
<input
 type="file"
 id="fileInput"
 accept=".geojson,.json"
/>
<br>
<button onclick="loadFile()">
📂 加载GeoJSON
</button>
<button onclick="exportGeoJSON()">
📥 导出GeoJSON
</button>
<button onclick="clearLayer()">
🧹 清空
</button>
        <hr>
<b>
当前GeoJSON
</b>
<textarea id="output"></textarea>
        </div>
<script src="https://unpkg.com/leaflet@1.9.4/dist/leaflet.js"></script>
<script src="https://unpkg.com/leaflet-draw@1.0.4/dist/leaflet.draw.js"></script>
<script>
/***********************************
 * 1. 初始化地图
 ***********************************/
const map =
L.map('map')
.setView(
    [30,120],
    5
);
L.tileLayer(
'https://server.arcgisonline.com/ArcGIS/rest/services/World_Imagery/MapServer/tile/{z}/{y}/{x}',
{
    maxZoom:19
})
.addTo(map);
/***********************************
 * 2. 图层管理
 ***********************************/
const drawnItems =
new L.FeatureGroup();
map.addLayer(
    drawnItems
);
/***********************************
 * 3. 绘制工具
 ***********************************/
const drawControl =
new L.Control.Draw({
    edit:{
        featureGroup:drawnItems
    },
    draw:{
        marker:true,
        polyline:true,
        polygon:{
            allowIntersection:false,
            showArea:true
        },
        rectangle:true,
        circle:false,
        circlemarker:false
    }
});
map.addControl(drawControl);
/***********************************
 * 4. 手绘完成
 ***********************************/
map.on(
L.Draw.Event.CREATED,
function(e){
    let layer=e.layer;
    drawnItems.addLayer(layer);
    syncGeoJSON();
}
);
map.on(
"draw:edited",
syncGeoJSON
);
map.on(
"draw:deleted",
syncGeoJSON
);
/***********************************
 * 5. 加载GeoJSON文件
 ***********************************/
function loadFile(){
const file =
document
.getElementById("fileInput")
.files[0];
if(!file){
alert(
"请选择geojson文件"
);
return;
}
const reader =
new FileReader();
reader.onload=function(e){
try{
let json =
JSON.parse(
e.target.result
);
let layer =
L.geoJSON(
json,
{
style:function(){
return {
color:"#3388ff",
weight:2,
fillOpacity:0.3
}
},
pointToLayer:function(
feature,
latlng
){
return L.marker(latlng);
},
onEachFeature:function(
feature,
layer
){
// 保存属性
layer.feature =
feature;
}
}
);
layer.eachLayer(
function(l){
drawnItems.addLayer(l);
}
);
map.fitBounds(
layer.getBounds()
);
syncGeoJSON();
}
catch(err){
alert(
"GeoJSON解析失败"
);
console.error(err);
}
};
reader.readAsText(file);
}
/***********************************
 * 6. 输出GeoJSON
 ***********************************/
function syncGeoJSON(){
let json =
drawnItems.toGeoJSON();
document
.getElementById("output")
.value =
JSON.stringify(
json,
null,
2
);
}
/***********************************
 * 7. 导出GeoJSON
 ***********************************/
function exportGeoJSON(){
let data =
drawnItems.toGeoJSON();
let blob =
new Blob(
[
JSON.stringify(
data,
null,
2
)
],
{
type:
'application/json'
}
);
let url =
URL.createObjectURL(blob);
let a =
document.createElement("a");
a.href=url;
a.download=
"export.geojson";
a.click();
URL.revokeObjectURL(url);
}
/***********************************
 * 8. 清空
 ***********************************/
function clearLayer(){
drawnItems.clearLayers();
syncGeoJSON();
}
syncGeoJSON();
</script>
    </body>
</html>