- 使用windows自带的wpr.exe(Windows Performance Recorder)抓取当前性能占用数据,powershell开始和结束抓
bash
PS C:\WINDOWS\system32> wpr.exe -start GeneralProfile -file
mode
PS C:\WINDOWS\system32> wpr.exe -stop "$env:USERPROFILE\Des
ktop\CPU0.etl"
Press Ctrl+C to cancel the stop operation.
100% [>>>>>>>>>>>>>>>>>>>>>>>>>>>>>>>>>>>>>>>>>>>>>>>>>>>>
>>>>>>>>]
The trace was successfully saved.
This trace has dropped 199113 events. Please record this tr
ace again.- 使用windows自带工具wpa(Windows Performance Toolkit)工具分析.etl文件
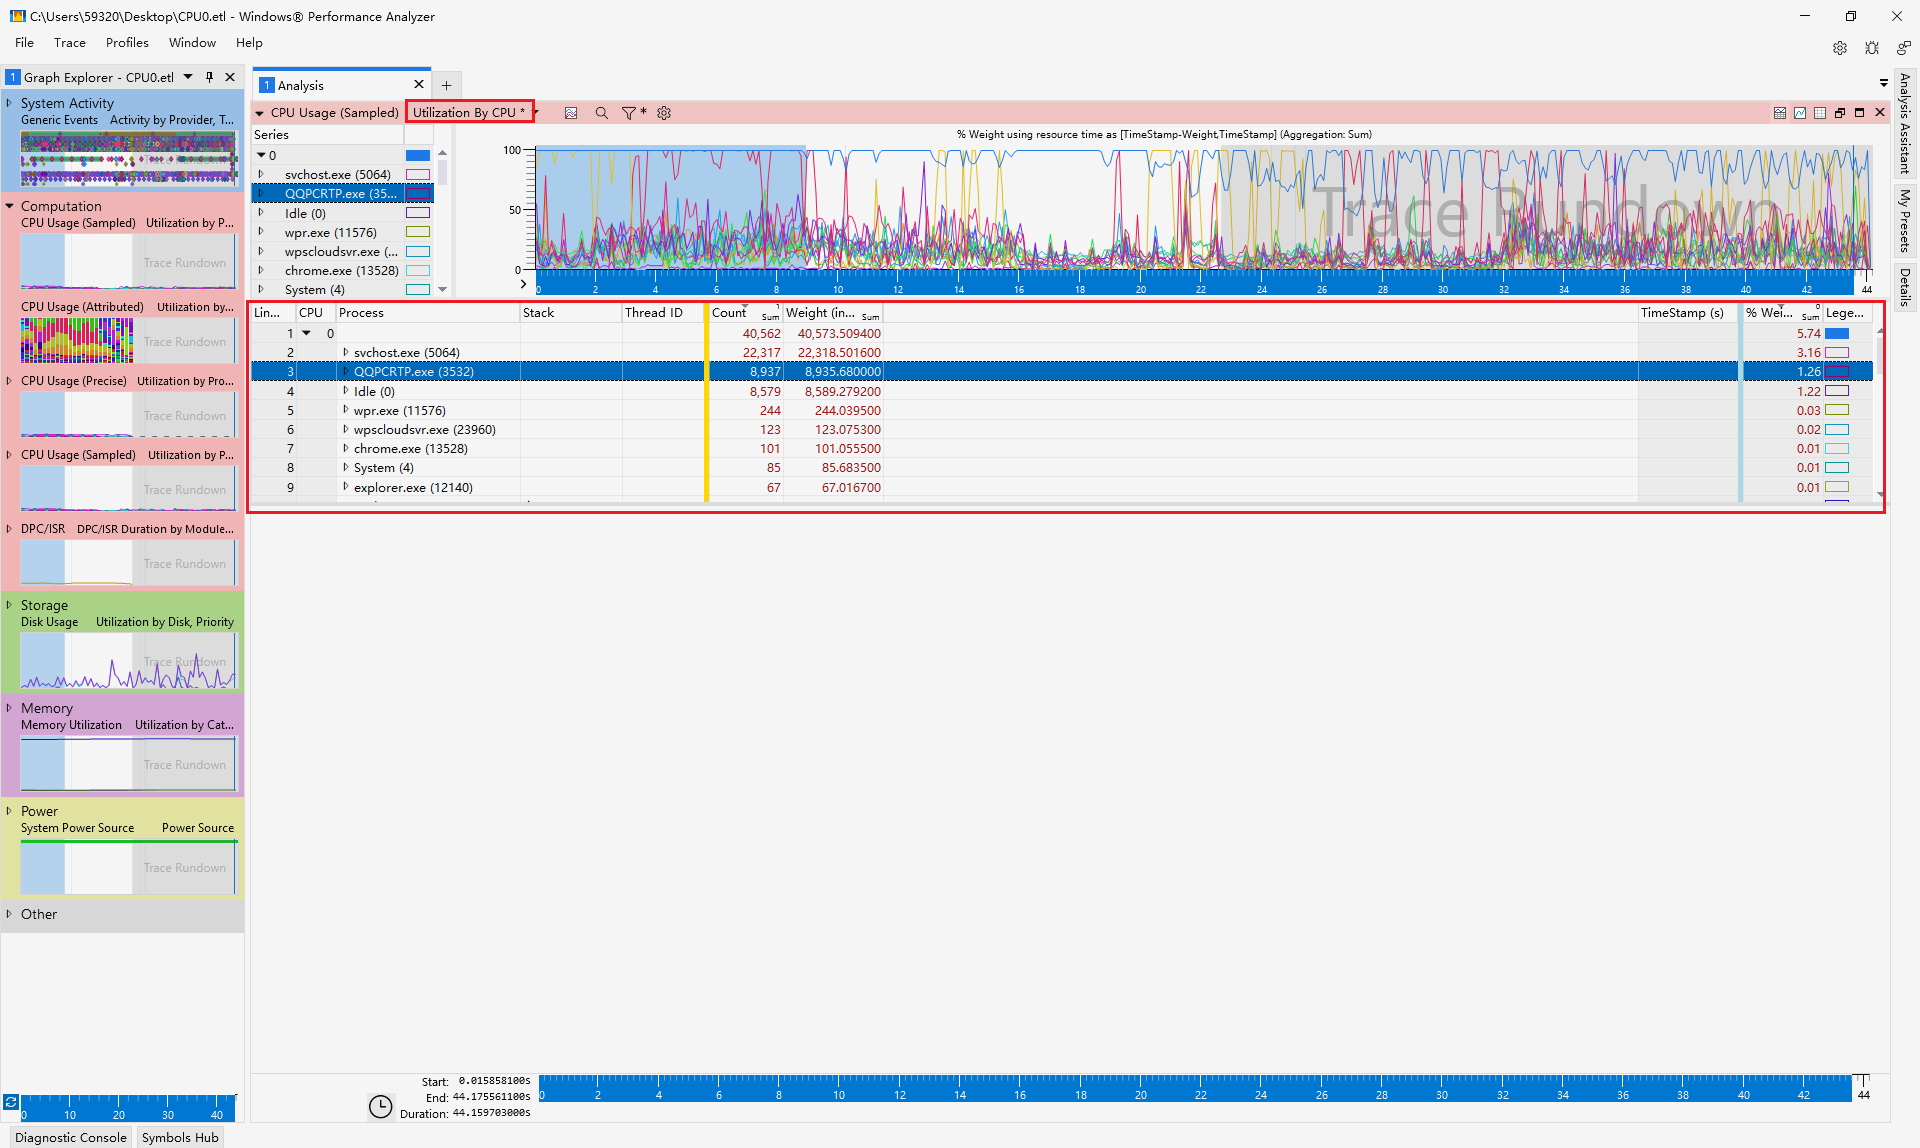
备注:我是win11 25H2系统,默认带了wpr和wpa工具,工具路径为:C:\Program Files (x86)\Windows Kits\10\Windows Performance Toolkit,如果你的系统没有这两个工具,可以使用Windows ADK和Windows SDK安装这两个工具。