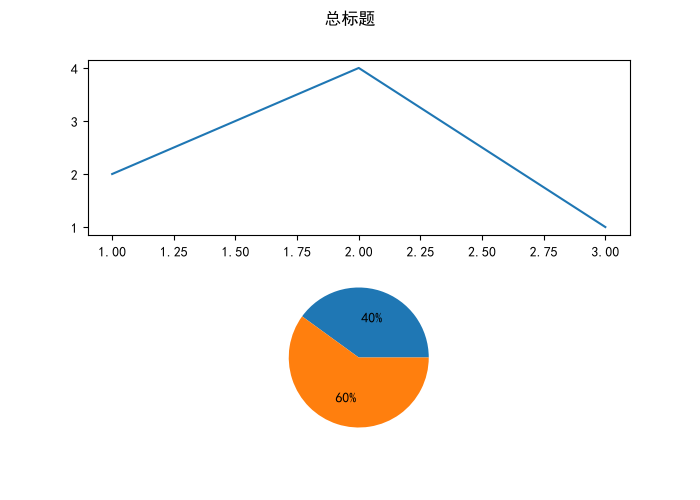
一、Matplotlib 画布 Figure
Figure(画布):最外层容器,相当于画纸 ,承载所有子图 Axes、标题、图例。一张画布可以放多个子图(Axes)。
Axes:绘图区域(子图),真正画折线 / 柱状 / 饼图的地方,一张画布可以有多个 Axes。
plt.figure () 常用参数
| 参数 | 含义 |
|---|---|
figsize=(宽,高) |
画布大小,单位:英寸,例figsize=(8,4) |
facecolor |
画布背景色(整个画纸底色) |
dpi |
分辨率,数值越大图片越清晰,保存图片生效 |
画布常用方法(fig 对象调用)
fig.savefig("test.png"):保存整张画布图片fig.suptitle("总标题"):画布最上方大标题(全局标题,区别 ax.set_title 子图标题)fig.add_subplot(行,列,序号):在画布新增绘图区域fig.add_axes([left,bottom,width,height]):自定义位置添加子图
核心概念区分(高频考题)
- Figure 画布:整张画纸,可以放多张图,设置画布背景、总标题、保存图片
- Axes 子图 / 坐标系:画纸上一小块绘图区域,ax.plot/ax.bar/ax.pie 都画在 Axes 上
- Axis:坐标轴(x 轴、y 轴刻度),属于 Axes 内部
一句话记忆:Figure 是画布(画纸),Axes 是画纸上的一个个绘图框
创建画布
python
import matplotlib.pyplot as plt
plt.rcParams["font.family"] = ["SimHei"]
plt.rcParams["axes.unicode_minus"] = False

# 1. 创建画布 Figure
fig = plt.figure(figsize=(8, 6), facecolor="#f6f6f6", dpi=100)

# 2. 用 add_axes 创建多个子图(自定义位置和大小)
# [左, 下, 宽度, 高度]
ax1 = fig.add_axes([0.1, 0.55, 0.35, 0.35])
ax2 = fig.add_axes([0.55, 0.55, 0.35, 0.35])
ax3 = fig.add_axes([0.3, 0.1, 0.4, 0.35])

# 在各个axes绘图
ax1.plot([1,2,3],[2,5,3])
ax1.set_title("子图1:折线图")

ax2.bar(["A","B","C"],[12,25,18])
ax2.set_title("子图2:柱状图")

ax3.pie([30,40,30], autopct="%1.0f%%")
ax3.set_title("子图3:饼图")

# 画布总标题
fig.suptitle("画布 + add_axes自定义子图", fontsize=16)

plt.show()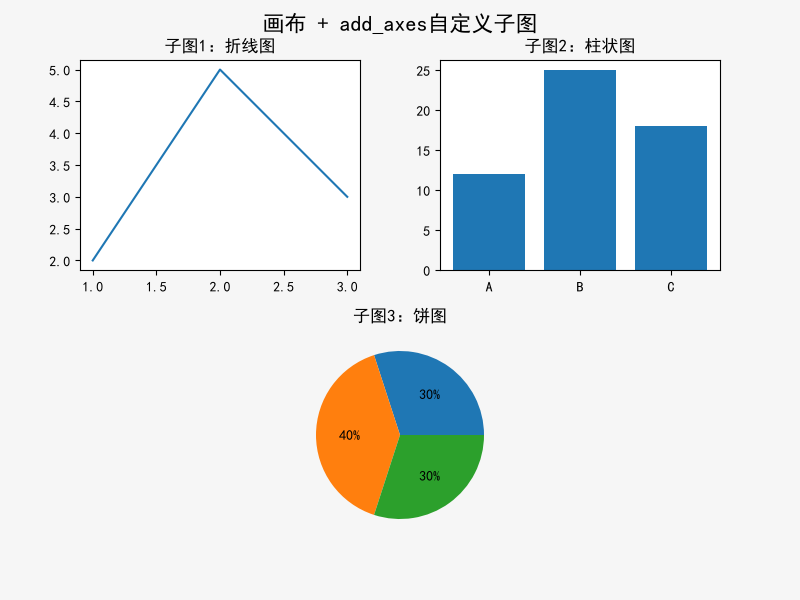
二、Figure 与 Axes(核心考点)
一句话区分
- Figure:画布(画纸),最外层容器,可以包含多个绘图区域
- Axes:子图 / 坐标系,画纸上一块独立绘图区域,真正画图(plot/bar/pie)都画在 Axes 上
注意区分:Axes(绘图区)≠ Axis(坐标轴,x/y 轴刻度)
Axes 常用属性 / 方法(绘图区域)
| 项目 | 作用 |
|---|---|
| ax.plot() / ax.bar() / ax.pie() | 在该区域绘图 |
| ax.set_title() | 子图标题 |
| ax.set_xlabel() / ax.set_ylabel() | 设置 x、y 轴标签 |
| ax.set_xlim() / ax.set_ylim() | 设置坐标轴范围 |
| ax.legend() | 添加图例 |
高频考点对比表
| 对象 | 中文名称 | 核心功能 | 标题方法 |
|---|---|---|---|
| Figure | 画布 | 承载所有子图,设置整张图片属性 | fig.suptitle() |
| Axes | 子图 / 坐标系 | 绘图、设置坐标轴、子图样式 | ax.set_title() |
易混易错
fig.suptitle():整张画布大标题;ax.set_title():单个子图标题,考试必考- 一个 Figure 可以包含多个 Axes;一个 Axes 只能属于一个 Figure
plt.subplots()返回(fig,ax),第一个返回值是画布,第二个是子图
python
import matplotlib.pyplot as plt
plt.rcParams["font.family"] = ["SimHei"]
plt.rcParams["axes.unicode_minus"] = False

# 1. 创建画布Figure
fig = plt.figure(figsize=(10, 7), facecolor="#f7f9fc", dpi=100)

# 2. 创建多个Axes绘图区(全部用add_axes)
ax1 = fig.add_axes([0.05, 0.55, 0.42, 0.4])  #左,下,宽,高
ax2 = fig.add_axes([0.53, 0.55, 0.42, 0.4])
ax3 = fig.add_axes([0.05, 0.08, 0.42, 0.4])
ax4 = fig.add_axes([0.53, 0.08, 0.42, 0.4])

# 在每个Axes绘图
ax1.plot([1,2,3,4], [2,4,1,3], color="#2E86AB", linewidth=2)
ax1.set_title("子图1 折线图")
ax1.set_xlabel("X轴")
ax1.set_ylabel("Y轴")

ax2.bar(["一季度","二季度","三季度"], [15,22,18], color="#A23B72")
ax2.set_title("子图2 柱状图")

ax3.pie([30,20,40,10], autopct="%1.0f%%", textprops={"fontsize":9})
ax3.set_title("子图3 饼图")

ax4.scatter([1,3,5,7], [4,2,6,3], color="#F18F01", s=60)
ax4.set_title("子图4 散点图")

# 画布总标题
fig.suptitle("使用add_axes创建多Axes多子图", fontsize=16)

plt.show()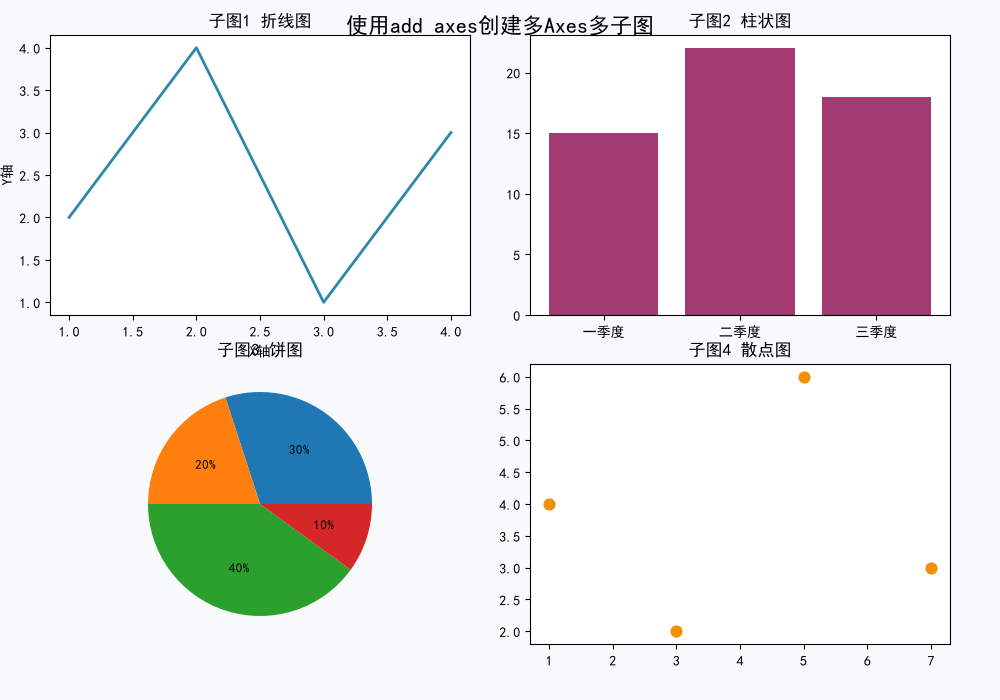
参数回顾
add_axes([left, bottom, width, height])
left:子图左边缘 距离画布最左边的比例 bottom:子图下边缘距离画布最底边的比例 width:子图自身宽度(占画布总宽比例) height:子图自身高度(占画布总高比例) 所有数值范围:0~1,画布左下角是坐标原点
4 个子图参数拆解
ax1 = fig.add_axes([0.05, 0.55, 0.42, 0.4])
ax2 = fig.add_axes([0.53, 0.55, 0.42, 0.4])
ax3 = fig.add_axes([0.05, 0.08, 0.42, 0.4])
ax4 = fig.add_axes([0.53, 0.08, 0.42, 0.4])ax1:0.05, 0.55, 0.42, 0.4
- left=0.05:左边距离画布左边界 5% 画布宽度
- bottom=0.55:下边距离画布底部 55% 画布高度
- width=0.42:子图宽度占画布总宽 42%
- height=0.4:子图高度占画布总高 40% 👉 位置:左上
ax2:0.53, 0.55, 0.42, 0.4
- left=0.53:左边距离画布左边界 53% 画布宽度
- bottom=0.55:下边距离画布底部 55% 画布高度(和 ax1 同一水平线)
- width=0.42,height=0.4,大小和 ax1 完全一样 👉 位置:右上
ax1 最右侧位置:0.05+0.42 = 0.47 ax2 最左侧位置:0.53 中间空隙:0.53 - 0.47 = 0.06(水平间隔 6% 画布宽度)
ax3:0.05, 0.08, 0.42, 0.4
- left=0.05,和 ax1 对齐
- bottom=0.08:下边距离画布底部 8% 画布高度
- width=0.42,height=0.4,大小同 ax1 👉 位置:左下
ax4:0.53, 0.08, 0.42, 0.4
- left=0.53,和 ax2 对齐
- bottom=0.08,和 ax3 同一水平线 👉 位置:右下
整体布局总结
2 行 × 2 列 的布局:
- 第一行(上面两个):ax1 (左上)、ax2 (右上),bottom 都是 0.55,在同一水平高度
- 第二行(下面两个):ax3 (左下)、ax4 (右下),bottom 都是 0.08,在同一水平高度
- 四个子图宽高完全相同,水平方向留有间隙,上下两行之间也有空隙。
计算子图顶部坐标 = bottom + height ax1 顶部:0.55+0.4 = 0.95,距离画布顶部还有 0.05(5%)的空白 ax3 顶部:0.08+0.4 = 0.48 两行之间空隙:0.55 - 0.48 = 0.07(7% 画布高度)
可视化简图(文字版)
画布顶部
┌────────────┐      ┌────────────┐
│    ax1     │      │    ax2     │
└────────────┘      └────────────┘

┌────────────┐      ┌────────────┐
│    ax3     │      │    ax4     │
└────────────┘      └────────────┘
画布底部
python
import matplotlib.pyplot as plt
plt.rcParams["font.family"] = ["SimHei"]
plt.rcParams["axes.unicode_minus"] = False

# 创建画布 Figure
fig = plt.figure(figsize=(7,5),facecolor='#f0f8ff')

# 方式A add_subplot:规则网格创建Axes
ax1 = fig.add_subplot(2,1,1) #2行1列,第1个子图
ax1.plot([1,2,3],[3,1,4])
ax1.set_title("子图1")

# 方式B add_axes:自定义位置创建Axes [left,bottom,w,h]
ax2 = fig.add_axes([0.1,0.1,0.6,0.5])
ax2.bar(["a","b"],[5,8])
ax2.set_title("子图2")

fig.suptitle("画布总标题", fontsize=15)
plt.show()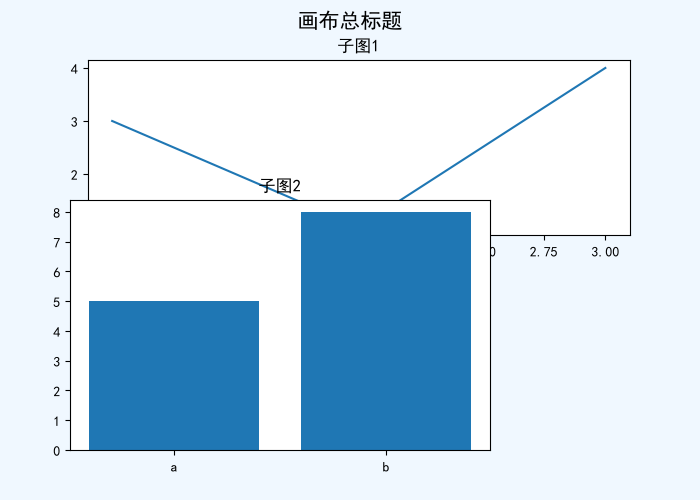
python
import matplotlib.pyplot as plt
plt.rcParams["font.family"] = ["SimHei"]
plt.rcParams["axes.unicode_minus"] = False

# fig是画布,ax是Axes对象(多个子图返回数组)
fig, ax = plt.subplots(2, 1, figsize=(7,5))
ax[0].plot([1,2,3],[2,4,1])
ax[1].pie([40,60],autopct="%1.0f%%")
fig.suptitle("总标题")
plt.show()