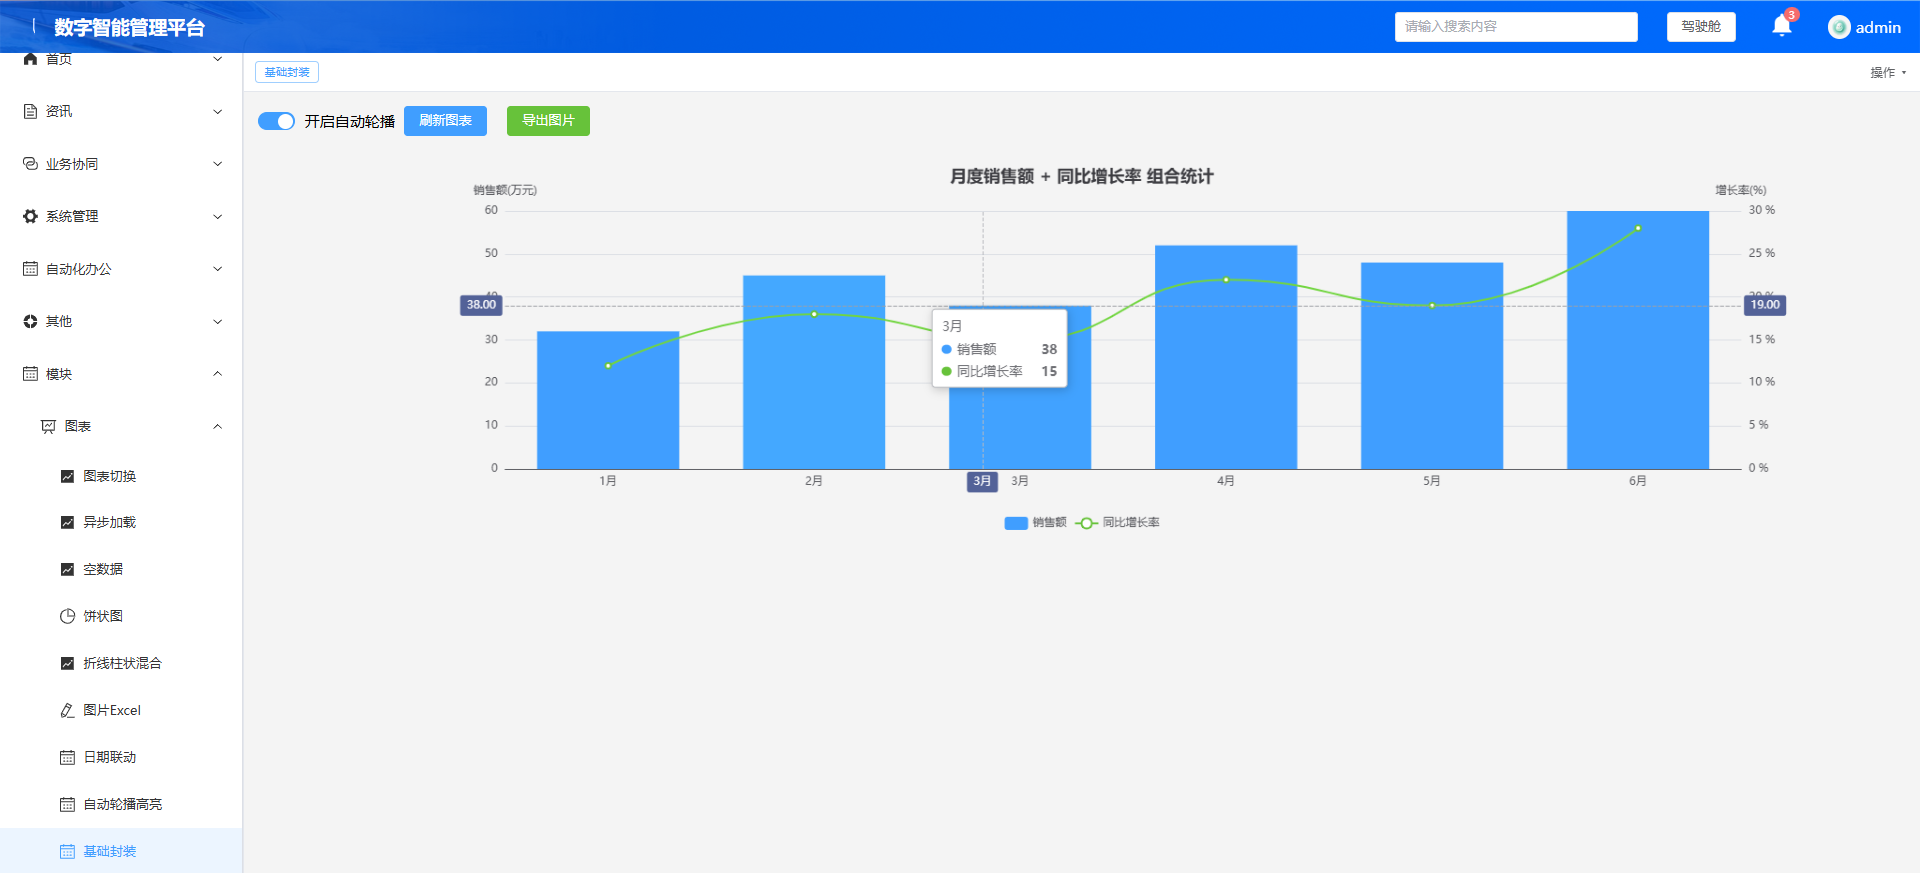
第 11 章:封装通用 BaseEchart 基础图表组件(Vue3 + 若依,全局复用)
本章目标:
将前面所有通用逻辑(实例初始化、resize、销毁、导出图片、自动轮播)抽离成独立可复用组件
BaseEchart.vue之后任何页面,只需要写一行
<BaseEchart />,传入option即可渲染图表,不用重复写 ref、onMounted、定时器清理等重复代码。
1、新建组件 src/components/BaseEchart/index.vue
<template>
  <div
    ref="chartRef"
    class="base-echart"
    :style="{ width: width, height: height }"
    @mouseenter="handleMouseEnter"
    @mouseleave="handleMouseLeave"
  ></div>
</template>

<script setup>
import { ref, watch, onMounted, onUnmounted } from 'vue'
import * as echarts from 'echarts'

const props = defineProps({
  // 图表配置项
  option: {
    type: Object,
    default: () => ({})
  },
  width: {
    type: String,
    default: '100%'
  },
  height: {
    type: String,
    default: '400px'
  },
  // 是否开启自动轮播高亮
  autoPlay: {
    type: Boolean,
    default: false
  },
  // 轮播间隔毫秒
  playInterval: {
    type: Number,
    default: 2000
  }
})

const emit = defineEmits(['chartReady'])

const chartRef = ref(null)
let chartInstance = null
let timer = null
let currentIndex = 0
let dataLen = 0

// 初始化图表
const initChart = () => {
  chartInstance = echarts.init(chartRef.value)
  chartInstance.setOption(props.option, true)
  emit('chartReady', chartInstance)
  // 开启轮播
  if (props.autoPlay) {
    startAutoPlay()
  }
}

// 监听option变化,更新图表
watch(
  () => props.option,
  (newOpt) => {
    if (!chartInstance) return
    chartInstance.setOption(newOpt, true)
    // 重置轮播索引
    if(props.autoPlay){
      clearTimer()
      dataLen = newOpt.series?.[0]?.data?.length || 0
      currentIndex = 0
      startAutoPlay()
    }
  },
  { deep: true }
)

// 窗口自适应
const resizeHandler = () => {
  chartInstance?.resize()
}

// 轮播相关
function startAutoPlay() {
  if(timer) return
  dataLen = props.option.series?.[0]?.data?.length || 0
  if(dataLen ===0) return
  timer = setInterval(()=>{
    chartInstance.dispatchAction({type:'downplay', seriesIndex:0})
    chartInstance.dispatchAction({
      type: 'showTip',
      seriesIndex:0,
      dataIndex: currentIndex
    })
    currentIndex ++
    if(currentIndex >= dataLen) currentIndex = 0
  }, props.playInterval)
}
function clearTimer(){
  if(timer){
    clearInterval(timer)
    timer = null
  }
}
const handleMouseEnter = ()=> clearTimer()
const handleMouseLeave = ()=>{
  if(props.autoPlay) startAutoPlay()
}

// 导出图片方法,暴露给父组件
const getChartImageUrl = () => {
  if(!chartInstance) return null
  return chartInstance.getDataURL({type:'png', pixelRatio:2})
}

onMounted(() => {
  initChart()
  window.addEventListener('resize', resizeHandler)
})

onUnmounted(() => {
  clearTimer()
  chartInstance?.dispose()
  window.removeEventListener('resize', resizeHandler)
})

// 对外暴露方法
defineExpose({
  getChartImageUrl,
  chartInstance
})
</script>

<style scoped>
.base-echart{
  box-sizing: border-box;
}
</style>
2、页面使用示例(父页面,直接调用 BaseEchart 组件)
<template>
  <div class="page-container">
    <div style="margin-bottom:15px;display:flex;gap:10px;align-items:center;">
      <el-switch v-model="autoPlay" @change="onPlayChange" />
      <span>开启自动轮播</span>
      <el-button type="primary" @click="loadData">刷新图表</el-button>
      <el-button type="success" @click="exportImg">导出图片</el-button>
    </div>
    <!-- 一行代码引入图表! -->
    <BaseEchart
      ref="baseChartRef"
      :option="chartOption"
      :auto-play="autoPlay"
      height="420px"
    />
  </div>
</template>

<script setup>
import { ref } from 'vue'
import BaseEchart from '@/components/BaseEchart/index.vue'
import { ElMessage } from 'element-plus'

const baseChartRef = ref(null)
const autoPlay = ref(true)
const chartOption = ref({})

// 构建组合图配置
function buildOption(xData, saleData, rateData) {
  return {
    title: { text: '月度销售额 + 同比增长率 组合统计', left: 'center' },
    tooltip: { trigger: 'axis', axisPointer: { type: 'cross' } },
    legend: { data: ['销售额', '同比增长率'], bottom: 10 },
    xAxis: [{ type: 'category', data: xData }],
    yAxis: [
      { type: 'value', name: '销售额(万元)', min:0 },
      { type: 'value', name: '增长率(%)', position:'right', axisLabel:{formatter:'{value} %'} }
    ],
    series: [
      { name:'销售额', type:'bar', data: saleData, itemStyle:{color:'#409EFF'} },
      { name:'同比增长率', type:'line', yAxisIndex:1, smooth:true, data:rateData, itemStyle:{color:'#67C23A'} }
    ]
  }
}

// 加载数据
const loadData = () => {
  const xData = ['1月','2月','3月','4月','5月','6月']
  const saleData = [32, 45, 38, 52, 48, 60]
  const rateData = [12, 18, 15, 22, 19, 28]
  chartOption.value = buildOption(xData, saleData, rateData)
  ElMessage.success('图表刷新完成')
}

// 轮播开关切换
const onPlayChange = ()=>{
  // 组件内部监听autoPlay自动处理
}

// 导出图片,调用子组件暴露的方法
const exportImg = ()=>{
  const imgUrl = baseChartRef.value.getChartImageUrl()
  if(!imgUrl){
    ElMessage.warning('图表实例不存在')
    return
  }
  const a = document.createElement('a')
  a.href = imgUrl
  a.download = '销售统计图表.png'
  document.body.appendChild(a)
  a.click()
  document.body.removeChild(a)
  ElMessage.success('图片导出成功')
}

loadData()
</script>
第 11 章测试清单
- 在若依项目新建
src/components/BaseEchart/index.vue粘贴组件代码 - 新建页面,粘贴父页面代码
- 逐项测试
✅ 页面渲染组合图表,自动轮播高亮,鼠标悬浮暂停,移开继续
✅ 切换autoPlay开关,轮播启停
✅ 点击导出图片,正常下载 PNG
✅ 修改chartOption,图表自动更新(watch 监听 option)
✅ 路由切换离开页面,自动销毁 echart 实例 + 清除定时器,无内存泄漏
✅ 窗口缩放自适应
核心知识点
defineExpose:子组件向外暴露实例和方法,父组件通过 ref 调用子组件内部函数watch(option,{deep:true}):深度监听配置,数据变更自动刷新图表- 封装后优势:以后做折线、饼图、柱状图,只需要传 option,不用重复写初始化、销毁、resize、定时器逻辑
- 组件解耦:基础渲染逻辑全部封装在 BaseEchart,业务页面只关心数据和 option 配置
后续扩展方向:可以在 BaseEchart 内部内置空态文字、loading、统一样式,所有图表共用一套空态。