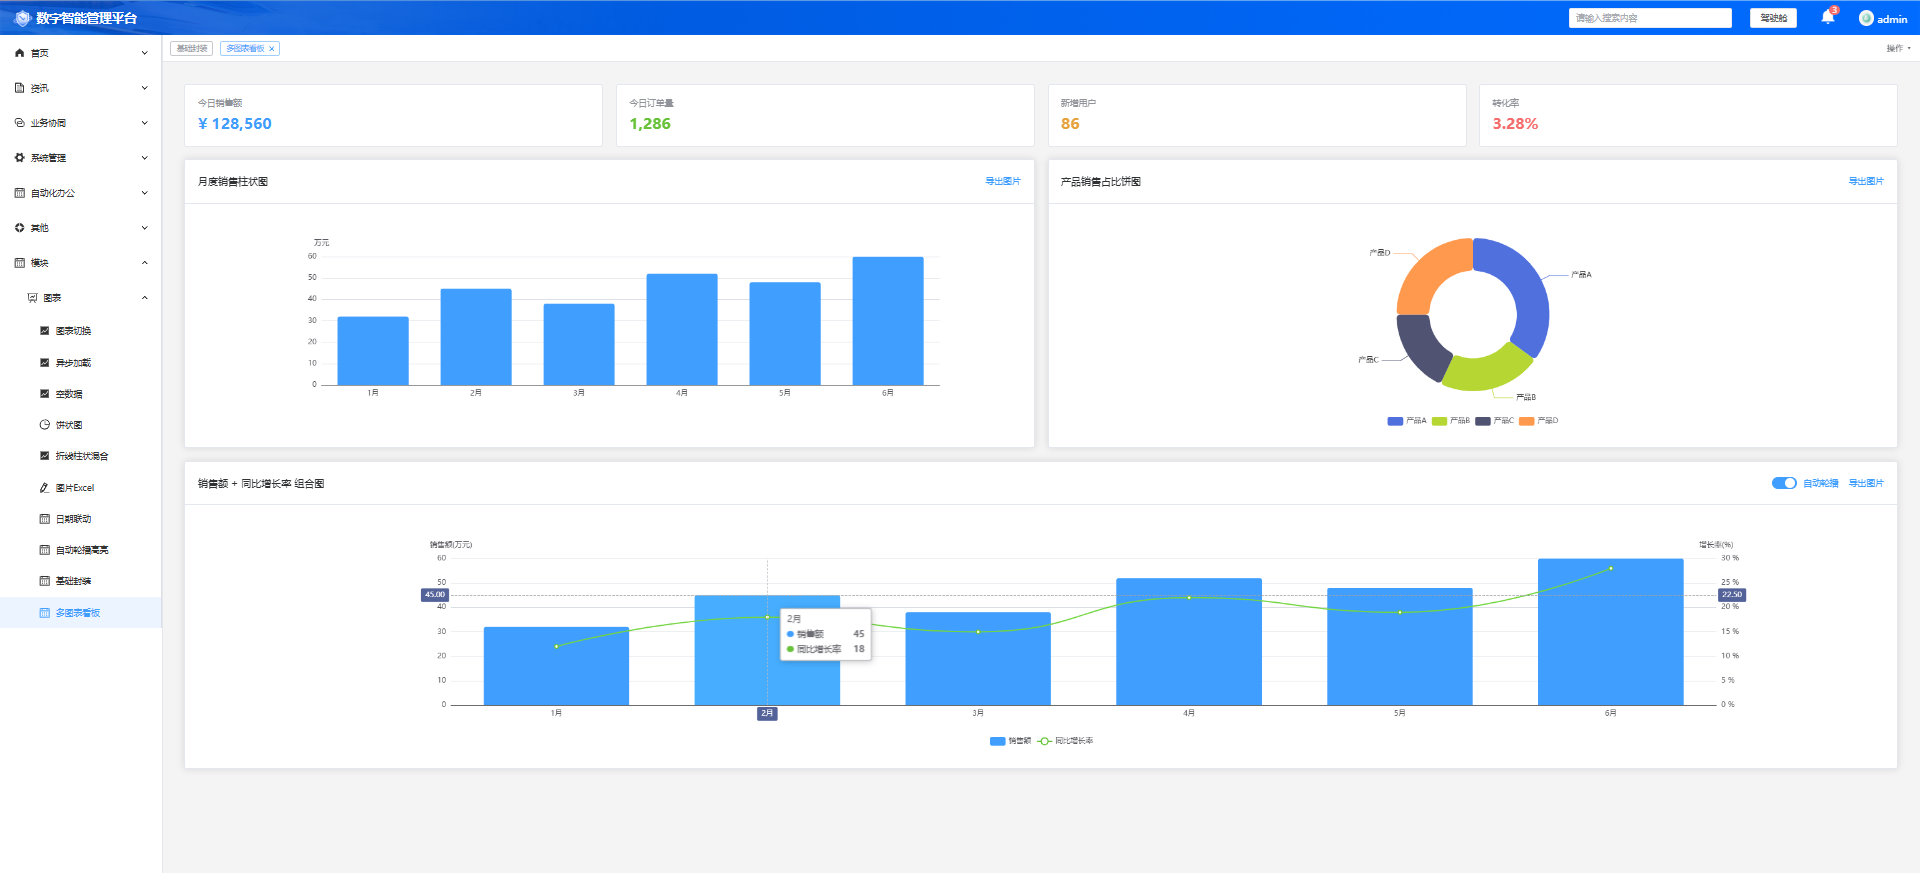
第 12 章:一页多图表看板(多 BaseEchart 组件共存,后台首页大屏效果)
本章目标:在一个页面同时放 3 个独立图表(柱状图、饼图、组合图),用 Element Plus 栅格布局,模拟真实后台首页数据看板。
全部复用我们封装好的
BaseEchart组件,零重复代码。
完整页面代码
<template>
  <div class="dashboard-page" style="padding:20px;">
    <!-- 顶部统计卡片 -->
    <el-row :gutter="20" style="margin-bottom:20px;">
      <el-col :span="6">
        <el-card shadow="hover">
          <div style="font-size:14px;color:#909399;">今日销售额</div>
          <div style="font-size:24px;font-weight:bold;color:#409EFF;margin-top:8px;">¥ 128,560</div>
        </el-card>
      </el-col>
      <el-col :span="6">
        <el-card shadow="hover">
          <div style="font-size:14px;color:#909399;">今日订单量</div>
          <div style="font-size:24px;font-weight:bold;color:#67C23A;margin-top:8px;">1,286</div>
        </el-card>
      </el-col>
      <el-col :span="6">
        <el-card shadow="hover">
          <div style="font-size:14px;color:#909399;">新增用户</div>
          <div style="font-size:24px;font-weight:bold;color:#E6A23C;margin-top:8px;">86</div>
        </el-card>
      </el-col>
      <el-col :span="6">
        <el-card shadow="hover">
          <div style="font-size:14px;color:#909399;">转化率</div>
          <div style="font-size:24px;font-weight:bold;color:#F56C6C;margin-top:8px;">3.28%</div>
        </el-card>
      </el-col>
    </el-row>

    <!-- 第一行:柱状图 + 饼图 -->
    <el-row :gutter="20" style="margin-bottom:20px;">
      <el-col :span="12">
        <el-card>
          <template #header>
            <div style="display:flex;justify-content:space-between;align-items:center;">
              <span>月度销售柱状图</span>
              <el-button type="text" @click="exportBarImg">导出图片</el-button>
            </div>
          </template>
          <BaseEchart
            ref="barChartRef"
            :option="barOption"
            height="350px"
          />
        </el-card>
      </el-col>
      <el-col :span="12">
        <el-card>
          <template #header>
            <div style="display:flex;justify-content:space-between;align-items:center;">
              <span>产品销售占比饼图</span>
              <el-button type="text" @click="exportPieImg">导出图片</el-button>
            </div>
          </template>
          <BaseEchart
            ref="pieChartRef"
            :option="pieOption"
            height="350px"
          />
        </el-card>
      </el-col>
    </el-row>

    <!-- 第二行:组合图(整行宽度) -->
    <el-row>
      <el-col :span="24">
        <el-card>
          <template #header>
            <div style="display:flex;justify-content:space-between;align-items:center;">
              <span>销售额 + 同比增长率 组合图</span>
              <div>
                <el-switch v-model="comboAutoPlay" active-text="自动轮播" style="margin-right:15px;" />
                <el-button type="text" @click="exportComboImg">导出图片</el-button>
              </div>
            </div>
          </template>
          <BaseEchart
            ref="comboChartRef"
            :option="comboOption"
            :auto-play="comboAutoPlay"
            height="380px"
          />
        </el-card>
      </el-col>
    </el-row>
  </div>
</template>

<script setup>
import { ref, onMounted } from 'vue'
import BaseEchart from '@/components/BaseEchart/index.vue'
import { ElMessage } from 'element-plus'

// 三个图表的ref
const barChartRef = ref(null)
const pieChartRef = ref(null)
const comboChartRef = ref(null)
const comboAutoPlay = ref(true)

// 三个图表的option
const barOption = ref({})
const pieOption = ref({})
const comboOption = ref({})

// 柱状图配置
function buildBarOption() {
  return {
    title: { text: '各月销售额', left: 'center', show: false },
    tooltip: { trigger: 'axis' },
    xAxis: {
      type: 'category',
      data: ['1月','2月','3月','4月','5月','6月']
    },
    yAxis: { type: 'value', name: '万元' },
    series: [{
      type: 'bar',
      data: [32, 45, 38, 52, 48, 60],
      itemStyle: { color: '#409EFF', borderRadius: [4,4,0,0] }
    }]
  }
}

// 饼图配置
function buildPieOption() {
  return {
    tooltip: { trigger: 'item', formatter: '{b}: {c}万元 ({d}%)' },
    legend: { bottom: 10, left: 'center' },
    series: [{
      type: 'pie',
      radius: ['40%', '70%'],
      center: ['50%', '45%'],
      data: [
        { name: '产品A', value: 35 },
        { name: '产品B', value: 22 },
        { name: '产品C', value: 18 },
        { name: '产品D', value: 25 }
      ],
      itemStyle: { borderRadius: 6 }
    }]
  }
}

// 组合图配置
function buildComboOption() {
  return {
    tooltip: { trigger: 'axis', axisPointer: { type: 'cross' } },
    legend: { data: ['销售额', '同比增长率'], bottom: 10 },
    xAxis: [{
      type: 'category',
      data: ['1月','2月','3月','4月','5月','6月']
    }],
    yAxis: [
      { type: 'value', name: '销售额(万元)', min: 0 },
      { type: 'value', name: '增长率(%)', position: 'right', axisLabel: { formatter: '{value} %' } }
    ],
    series: [
      {
        name: '销售额',
        type: 'bar',
        data: [32, 45, 38, 52, 48, 60],
        itemStyle: { color: '#409EFF', borderRadius: [4,4,0,0] }
      },
      {
        name: '同比增长率',
        type: 'line',
        yAxisIndex: 1,
        smooth: true,
        data: [12, 18, 15, 22, 19, 28],
        itemStyle: { color: '#67C23A' }
      }
    ]
  }
}

// 导出通用方法
function exportImg(chartRef, name) {
  const url = chartRef.value.getChartImageUrl()
  if (!url) {
    ElMessage.warning('图表未加载')
    return
  }
  const a = document.createElement('a')
  a.href = url
  a.download = `${name}.png`
  document.body.appendChild(a)
  a.click()
  document.body.removeChild(a)
  ElMessage.success('导出成功')
}

const exportBarImg = () => exportImg(barChartRef, '月度销售柱状图')
const exportPieImg = () => exportImg(pieChartRef, '产品占比饼图')
const exportComboImg = () => exportImg(comboChartRef, '销售组合图')

onMounted(() => {
  // 初始化三个图表
  barOption.value = buildBarOption()
  pieOption.value = buildPieOption()
  comboOption.value = buildComboOption()
})
</script>
第 12 章测试清单
- 新建看板页面,粘贴上面代码
- 配置路由进入页面
- 逐项测试:
✅ 页面顶部 4 张统计卡片正常渲染
✅ 第一行左右各一个图表:柱状图、环形饼图,尺寸自适应
✅ 第二行整宽组合图,自动轮播高亮,开关可控制
✅ 每个图表右上角【导出图片】,分别独立下载对应 PNG
✅ 窗口缩放,三个图表全部自适应缩放
✅ 切换若依菜单离开页面,控制台无定时器泄漏、无报错
核心知识点
- 栅格布局 :Element Plus
el-row + el-col,:span分栏,24 栅格体系,后台看板标配 - 多组件共存 :每个
BaseEchart有独立 ref、独立 option、独立生命周期,互不干扰 - 卡片容器 :
el-card包裹图表,标题栏放导出按钮,是若依后台标准布局风格 - 复用导出 :封装统一
exportImg方法,传不同 ref 就能导出不同图表,避免重复代码
这一章做完,你已经具备完整的若依后台图表开发能力:
✅ 单图 / 多图 / 组合图 / 饼图 / 柱状 / 双 Y 轴
✅ 空态兜底、tooltip 自定义、窗口自适应、自动销毁防泄漏
✅ 导出图片、CSV 数据、日期筛选联动、自动轮播
✅ 封装通用组件,一行代码渲染图表