第20章:ECharts 图表主题切换 + 自定义颜色渐变
业务场景:若依本身支持深色 / 浅色主题切换,本节实现 ECharts 图表跟随系统主题切换,同时演示柱状图、折线图渐变填充效果,复用已有
useEcharts封装,无需修改 echartHelper。
页面完整 Vue 代码
<template>
  <div class="chart-container">
    <el-alert title="图表主题切换 + 渐变色彩演示" type="info" style="margin-bottom:10px"/>
    <el-button type="primary" @click="toggleTheme">切换深浅主题</el-button>
    <div
      ref="chartRef"
      style="width:100%;height:400px;border:1px solid #eee;margin-top:10px"
    ></div>

    <el-dialog v-model="dialogVisible" title="点击详情">
      <p>月份:{{ clickData.name }}</p>
      <p>数值:{{ clickData.value }}</p>
    </el-dialog>
  </div>
</template>

<script setup>
import { ref } from 'vue'
import { useEcharts } from '@/composables/echartHelper'
  import * as echarts from 'echarts'
const { chartRef, setChartOption, onChartEvent } = useEcharts()

const dialogVisible = ref(false)
const clickData = ref({ name:'', value:0 })
const isDark = ref(false)

// 生成option,根据主题动态修改文字、背景、渐变
function getChartOption() {
  const textColor = isDark.value ? '#fff' : '#333'
  const bgColor = isDark.value ? '#1f2937' : '#ffffff'

  return {
    backgroundColor: bgColor,
    title: {
      text: '渐变效果演示图表',
      left: 'center',
      textStyle: {
        fontSize:18,
        color: textColor
      }
    },
    tooltip: {
      trigger: 'axis'
    },
    legend: {
      data: ['销售额'],
      bottom: 10,
      textStyle: { color:textColor, fontSize:14 }
    },
    grid: {
      left: '3%',
      right: '4%',
      bottom: '15%',
      containLabel: true
    },
    xAxis: {
      type: 'category',
      data: ['1月','2月','3月','4月','5月','6月'],
      axisLine:{ lineStyle:{color:textColor} },
      axisLabel: { fontSize:13, color:textColor }
    },
    yAxis: {
      type: 'value',
      axisLine:{ lineStyle:{color:textColor} },
      axisLabel: { fontSize:13, color:textColor }
    },
    series: [
      {
        name: '销售额',
        type: 'bar',
        data: [120, 200, 150, 280, 190, 240],
        itemStyle: {
          // 柱状图垂直渐变
          color: new echarts.graphic.LinearGradient(0, 0, 0, 1, [
            { offset: 0, color: '#409EFF' },
            { offset: 1, color: '#a0d6ff' }
          ])
        }
      }
    ]
  }
}

// 初始化渲染
setChartOption(getChartOption())

// 切换主题
const toggleTheme = () => {
  isDark.value = !isDark.value
  setChartOption(getChartOption())
}

// 点击事件
onChartEvent('click', (params)=>{
  clickData.value = {
    name: params.name,
    value: params.value
  }
  dialogVisible.value = true
})
</script>
⚠️ 注意:需要导入 echarts,在 script 顶部增加导入
import * as echarts from 'echarts'✅ 测试步骤
- 保存 vue 文件,刷新页面
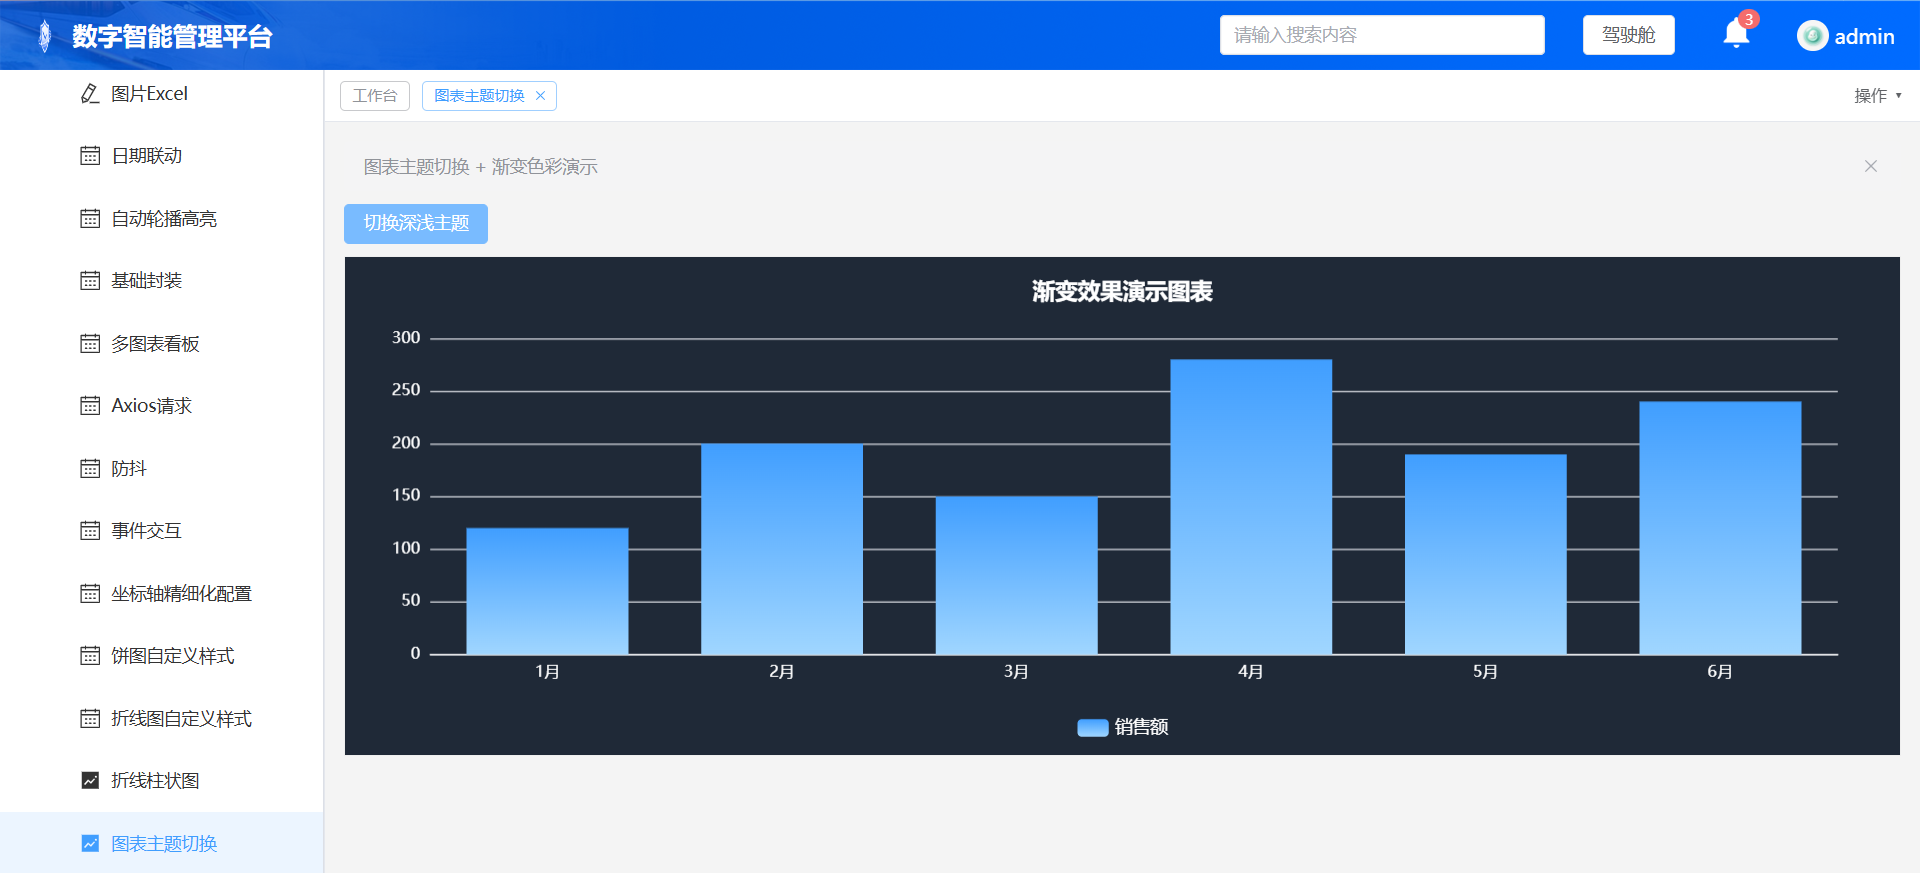
- 图表正常渲染,柱子带有蓝到浅蓝的渐变效果
- 点击【切换深浅主题】按钮:图表背景、文字颜色自动切换深色 / 浅色两套样式
- 悬浮 tooltip 正常,点击柱子弹窗正常
- 窗口缩放防抖 resize 正常,路由切换实例销毁无内存泄漏
拓展知识点
-
echarts.graphic.LinearGradient(x1,y1,x2,y2,数组):0,0,0,1 代表垂直渐变;0,0,1,0 代表水平渐变 -
折线图区域填充渐变,在 series 里面增加
areaStyle配置areaStyle: {
color: new echarts.graphic.LinearGradient(0,0,0,1,[
{offset:0,color:'rgba(64,158,255,0.6)'},
{offset:1,color:'rgba(64,158,255,0.05)'}
])
}