第26章:ECharts 自定义主题 + 页面一键切换主题(深色 / 浅色两套)
业务场景:后台管理平台,支持全局 / 单张图表切换深色、浅色主题,若依自带暗黑模式联动,复用我们封装好的
useEcharts。原理:ECharts 支持预注册主题,初始化图表时指定
theme名称;我们做两套主题,增加按钮一键切换。
第一步:准备 echarts 主题
- 官网主题编辑器:https://echarts.apache.org/zh/theme-builder.html
- 我们直接内置两套极简主题,不需要额外下载 js,代码内定义。
完整页面 Vue 代码
<template>
  <div class="chart-container">
    <el-alert title="ECharts自定义主题切换:浅色/深色主题一键切换" type="info" style="margin-bottom:10px"/>
    <el-button type="primary" @click="toggleTheme">切换图表主题</el-button>
    <div
      ref="chartRef"
      style="width:100%;height:400px;border:1px solid #eee;margin-top:10px"
    ></div>
  </div>
</template>

<script setup>
import * as echarts from 'echarts'
import { ref, onMounted } from 'vue'
import { useEcharts } from '@/composables/echartHelper'

const { chartRef, setChartOption } = useEcharts()
// 标记当前主题
const isDark = ref(false)

// 浅色主题配置
const lightOption = {
  title: {
    text: "产品月度销量统计",
    left: "center",
    textStyle: { color: "#303133" }
  },
  tooltip: { trigger: "axis" },
  legend: { data: ["A产品","B产品"], bottom: 10, textStyle: { color: "#303133" } },
  grid: { left: "3%", right: "4%", bottom: "15%", containLabel: true },
  xAxis: {
    type: "category",
    data: ["1月","2月","3月","4月","5月","6月"],
    axisLine: { lineStyle:{color:'#ccc'} },
    axisLabel: { color: "#606266" }
  },
  yAxis: {
    type: "value",
    axisLine: { lineStyle:{color:'#ccc'} },
    axisLabel: { color: "#606266" }
  },
  series: [
    {
      name: "A产品",
      type: "bar",
      data: [120, 200, 150, 280, 190, 240],
      itemStyle: { color: "#409EFF" }
    },
    {
      name: "B产品",
      type: "bar",
      data: [80, 140, 220, 160, 250, 180],
      itemStyle: { color: "#67C23A" }
    }
  ]
}

// 深色主题配置
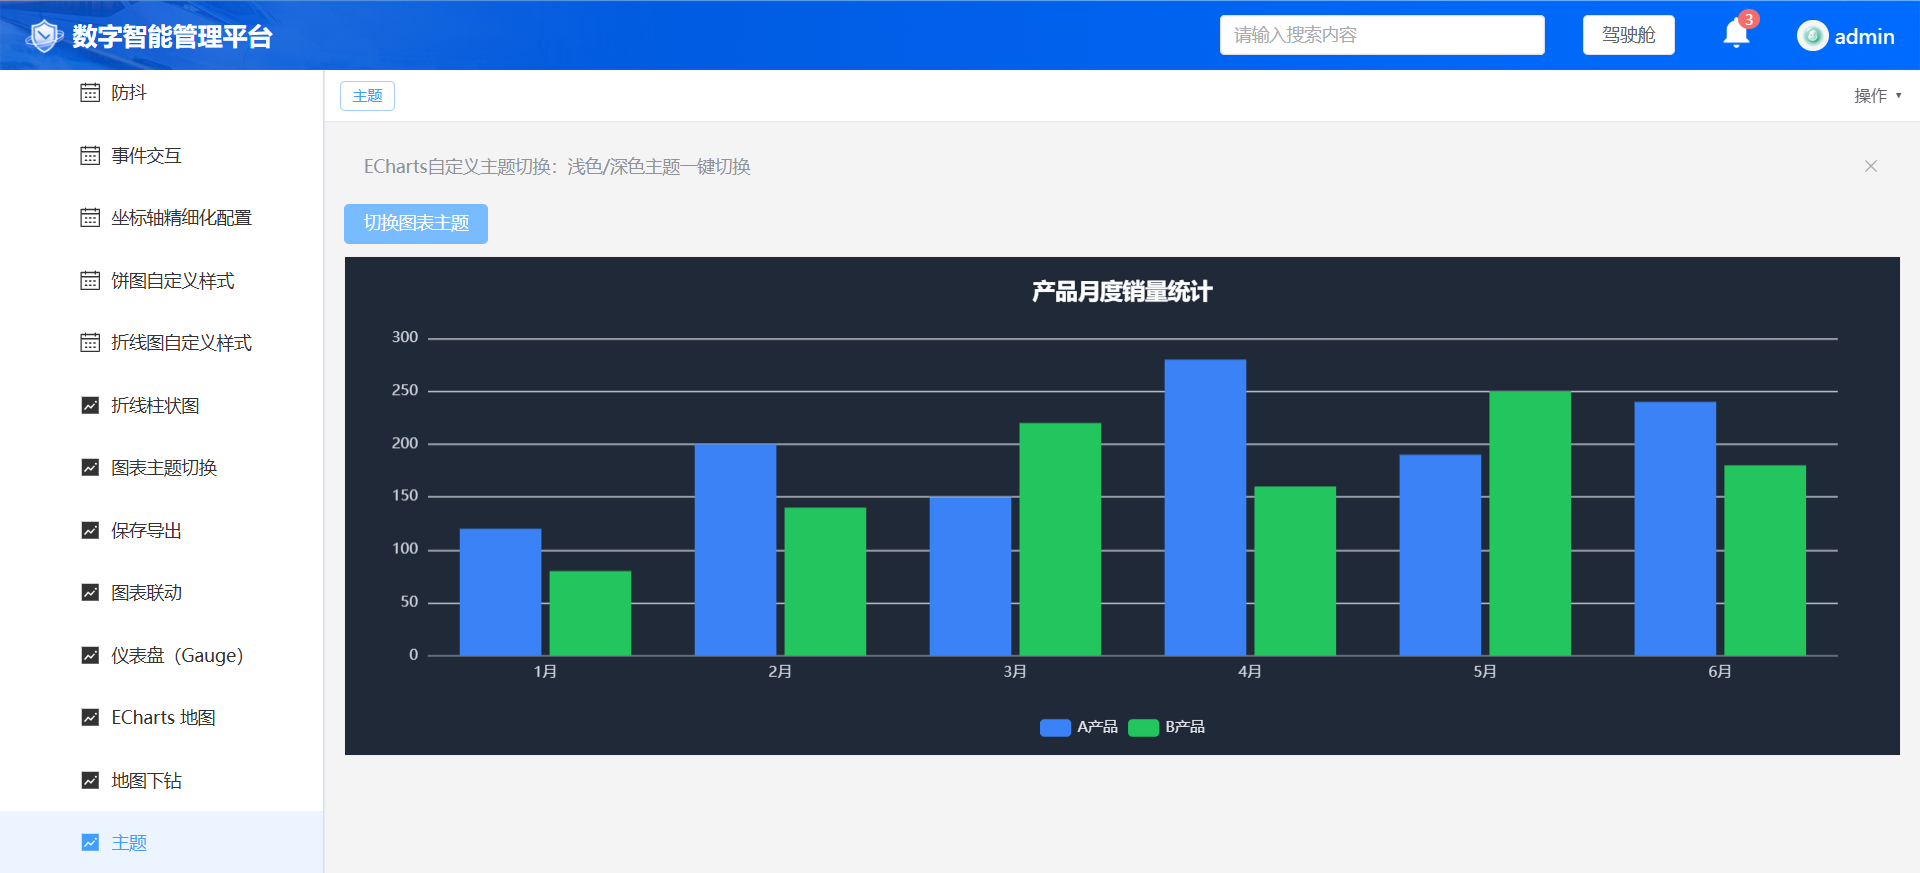
const darkOption = {
  backgroundColor: "#1f2937",
  title: {
    text: "产品月度销量统计",
    left: "center",
    textStyle: { color: "#ffffff" }
  },
  tooltip: { trigger: "axis", backgroundColor:"#333", textStyle:{color:"#fff"} },
  legend: { data: ["A产品","B产品"], bottom: 10, textStyle: { color: "#e5e7eb" } },
  grid: { left: "3%", right: "4%", bottom: "15%", containLabel: true },
  xAxis: {
    type: "category",
    data: ["1月","2月","3月","4月","5月","6月"],
    axisLine: { lineStyle:{color:'#4b5563'} },
    axisLabel: { color: "#d1d5db" }
  },
  yAxis: {
    type: "value",
    axisLine: { lineStyle:{color:'#4b5563'} },
    axisLabel: { color: "#d1d5db" }
  },
  series: [
    {
      name: "A产品",
      type: "bar",
      data: [120, 200, 150, 280, 190, 240],
      itemStyle: { color: "#3b82f6" }
    },
    {
      name: "B产品",
      type: "bar",
      data: [80, 140, 220, 160, 250, 180],
      itemStyle: { color: "#22c55e" }
    }
  ]
}

// 切换主题函数
async function toggleTheme() {
  isDark.value = !isDark.value
  if(isDark.value){
    await setChartOption(darkOption)
  }else{
    await setChartOption(lightOption)
  }
}

onMounted(async () => {
  await setChartOption(lightOption)
})
</script>
进阶知识点(若依暗黑模式联动)
若依 Vue3 自带全局暗黑主题,我们可以监听若依的暗黑变量,自动切换图表颜色,不需要手动点按钮:
// 引入若依全局暗黑状态
import { useAppStore } from '@/stores/app'
const appStore = useAppStore()

// 监听暗黑模式变化
watch(()=>appStore.dark, (newVal)=>{
  if(newVal){
    setChartOption(darkOption)
  }else{
    setChartOption(lightOption)
  }
},{immediate:true})
注意:需要在顶部引入
import { watch } from 'vue'
知识点总结
- 两套 option,区分背景、文字、坐标轴颜色;深色图表必须设置
backgroundColor - 复用我们封装好的
setChartOption,notMerge:true,切换主题时完整覆盖旧配置,不会残留样式 - 可以单独页面切换,也可以监听若依全局暗黑状态自动同步图表主题
- resize、实例销毁逻辑全部继承自 useEcharts,不用重复写
🧪 测试清单
- 保存页面,刷新浏览器
- 页面默认浅色柱状图,文字、坐标轴颜色正常
- 点击【切换图表主题】按钮,图表立刻切换深色背景,文字变白
- 多次点击,深浅来回切换无样式残留
- 窗口缩放,图表自适应
- 切换菜单,图表实例销毁,无内存泄漏