定义option
const option = ref({});
const chart = ref()
option.value = {
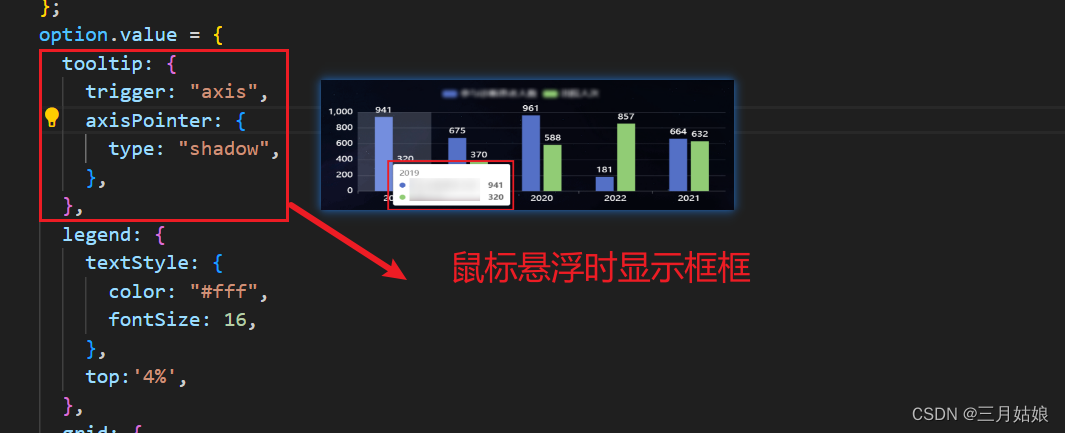
tooltip: {
trigger: "axis",
axisPointer: {
type: "shadow",
},
},
legend: {
textStyle: {
color: "#fff",
fontSize: 16,
},
top:'4%',
},
grid: {
left: "3%",
right: "0%",
bottom: "3%",
containLabel: true,
},
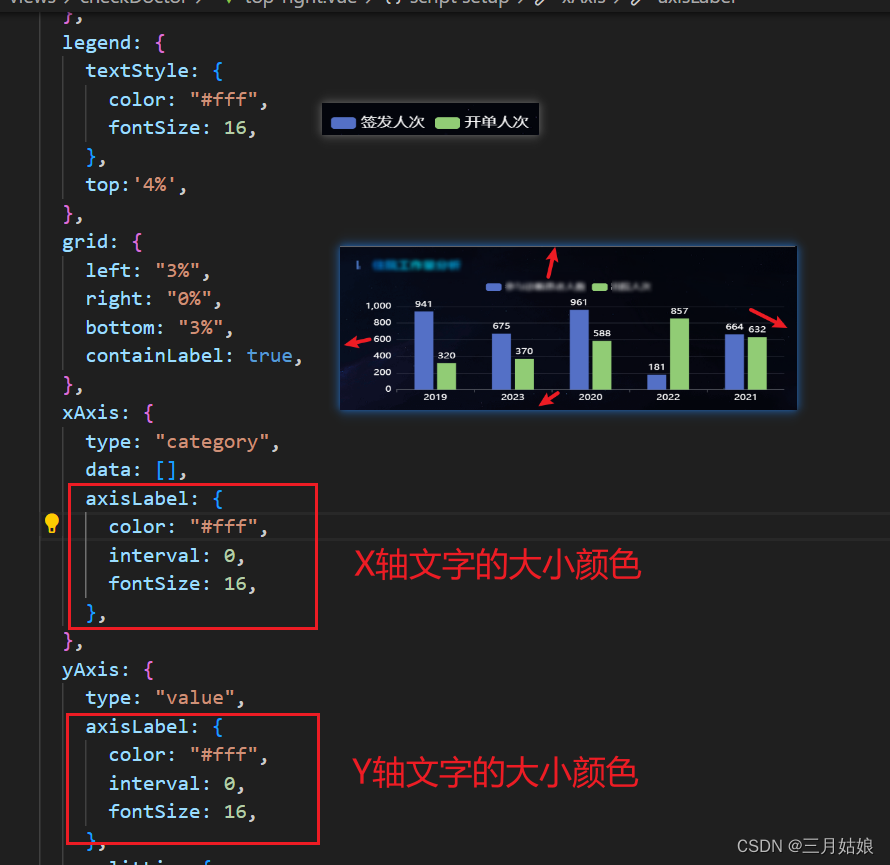
xAxis: {
type: "category",
data: \[\],
axisLabel: {
color: "#fff",
interval: 0,
fontSize: 16,
},
},
yAxis: {
type: "value",
axisLabel: {
color: "#fff",
interval: 0,
fontSize: 16,
},
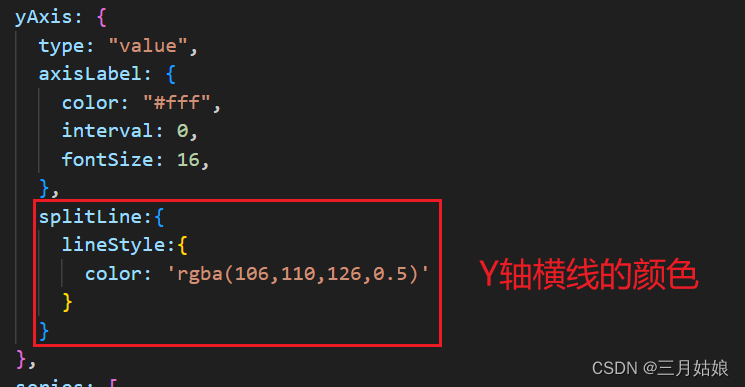
splitLine:{
lineStyle:{
color: 'rgba(106,110,126,0.5)'
}
}
},
series: [
],
};
接口返回数据时的处理方式
if (res.success) {
console.log('res.data.data',res.data.data.length)
if (res.data.data.length > 0) {
let newList = \[\];
newList = res.data.series;
option.value.xAxis.data = res.data.xAxis;
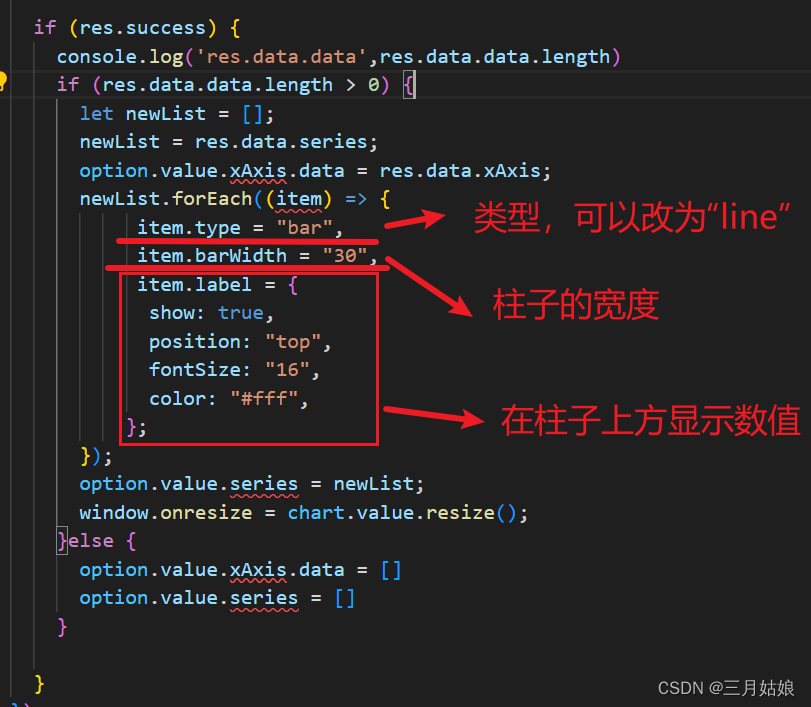
newList.forEach((item) => {
item.type = "bar",
item.barWidth = "30",
item.label = {
show: true,
position: "top",
fontSize: "16",
color: "#fff",
};
});
option.value.series = newList;
window.onresize = chart.value.resize();
}else {
option.value.xAxis.data = \[\]
option.value.series = \[\]
}
}