Qt引入QcustomPlot
首先下载QcustomPlot源代码,https://github.com/qcustomplot/qcustomplot
下载zip文件
运行所下载的项目生成库文件libqcustomplotd2.a文件和qcustomplotd2.dll文件。
在项目中添加printsupport。
并将qcustomplot.h文件和qcustomplot.cpp文件添加到项目,另外将库文件复制到项目中。
在项目ui 中拖出一个widget并提升为QCustomPlot接下来我们引入customplot.h文件进行画图。
cpp
ui->customPlot->xAxis->setVisible(true); // 隐藏X轴
ui->customPlot->yAxis->setVisible(true); // 隐藏Y轴
ui->customPlot->xAxis->setTickLabels(true); // 隐藏X轴的刻度标签
ui->customPlot->yAxis->setTickLabels(true); // 隐藏Y轴的刻度标签
ui->customPlot->legend->setVisible(true);
QSharedPointer<QCPAxisTickerDateTime> timeTicker(new QCPAxisTickerDateTime);
//ui->customPlot->xAxis->setTickLabelType(QCPAxis::ltDateTime);
timeTicker->setDateTimeFormat("yyyy-MM-dd HH:mm:ss"); // 设置时间格式
ui->customPlot->xAxis->setTicker(timeTicker);
ui->customPlot->graph(0)->setData(timee, i);
ui->customPlot->graph(0)->setName("电流曲线");
//ui->customPlot->graph(0)->setWidth(5);
ui->customPlot->graph(1)->setData(timee, v);
ui->customPlot->graph(1)->setName("电压曲线");
ui->customPlot->rescaleAxes();
ui->customPlot->xAxis->setLabel("时间轴");
ui->customPlot->yAxis->setRange(0,150);
ui->customPlot->replot();
QObject::connect(ui->customPlot, &QCustomPlot::mousePress, [&](QMouseEvent *event)
{
// 当前鼠标位置(像素坐标)
int x_pos = event->pos().x();
int y_pos = event->pos().y();
//鼠标坐标转化为CustomPlot内部坐标
int x_val = ui->customPlot->xAxis->pixelToCoord(x_pos);
int y_val = ui->customPlot->yAxis->pixelToCoord(y_pos);
QString str,strToolTip;
str = QString::number(x_val);
strToolTip += "时间: ";
strToolTip += QDateTime::fromTime_t(x_val).toString(
"yyyy-MM-dd hh:mm:ss");
strToolTip += "\n";
int index=keyIndexMap[x_val];
//qDebug()<<x_val<<index;
int y=ui->customPlot->graph(0)->data()->at(index)->value;
str = QString::number(y);
strToolTip += "电流:";
strToolTip += str;
strToolTip += "\n";
//qDebug()<<str;
int y1=ui->customPlot->graph(1)->data()->at(index)->value;
str = QString::number(y1);
strToolTip += "电压:";
strToolTip += str;
strToolTip += "\n";
QToolTip::showText(cursor().pos(), strToolTip, ui->customPlot);
});
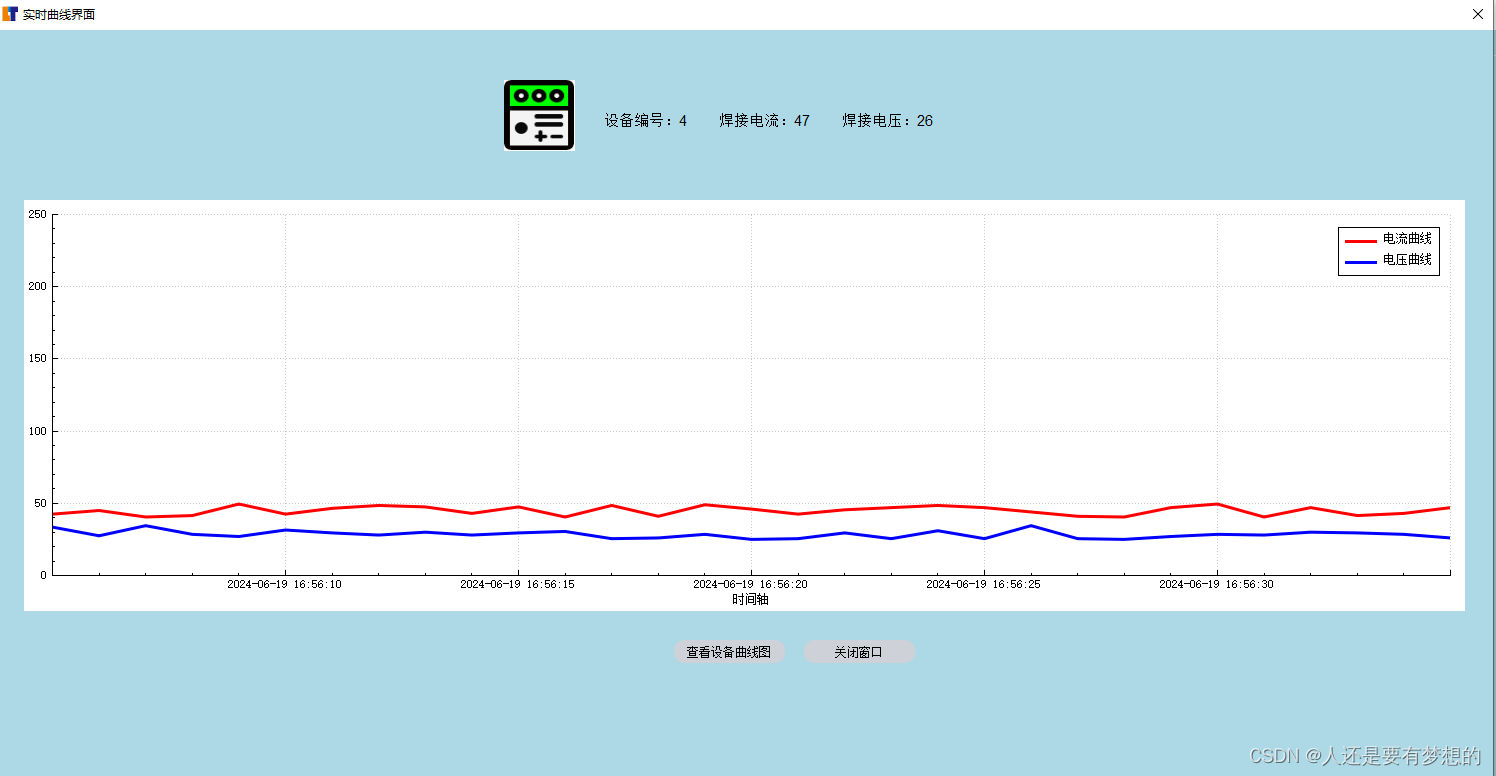
}上面显示的是曲线
timee,i,v是vector数组,timee是
timee[j]=time[j].toTime_t();日期时间转换的毫秒数通过以下代码
QSharedPointer<QCPAxisTickerDateTime> timeTicker(new QCPAxisTickerDateTime); //ui->customPlot->xAxis->setTickLabelType(QCPAxis::ltDateTime); timeTicker->setDateTimeFormat("yyyy-MM-dd HH:mm:ss"); // 设置时间格式 ui->customPlot->xAxis->setTicker(timeTicker);实现在折线图中显示出日期时间。
如何显示实时曲线呢?
cpp
timer=new QTimer(this);
    timer->setTimerType(Qt::PreciseTimer);
    timer->start(1000);
    connect(timer,&QTimer::timeout,this,&Dialog::update);
通过定时器每隔1000ms调用update函数,上面的代码就是update函数中的部分代码。
上面代码也包括了点击按钮出现时间轴和电压,电流的数据。
cpp
QObject::connect(ui->customPlot, &QCustomPlot::mousePress, [&](QMouseEvent *event)
        {

            // 当前鼠标位置(像素坐标)

            int x_pos = event->pos().x();
            int y_pos = event->pos().y();

            //鼠标坐标转化为CustomPlot内部坐标
            int x_val = ui->customPlot->xAxis->pixelToCoord(x_pos);
            int y_val = ui->customPlot->yAxis->pixelToCoord(y_pos);

            QString str,strToolTip;
            str = QString::number(x_val);
            strToolTip += "时间: ";
            strToolTip += QDateTime::fromTime_t(x_val).toString(
                        "yyyy-MM-dd hh:mm:ss");
            strToolTip += "\n";

            int index=keyIndexMap[x_val];
            //qDebug()<<x_val<<index;
            int y=ui->customPlot->graph(0)->data()->at(index)->value;
            str = QString::number(y);
            strToolTip += "电流:";
            strToolTip += str;
            strToolTip += "\n";
            //qDebug()<<str;
            int y1=ui->customPlot->graph(1)->data()->at(index)->value;
            str = QString::number(y1);
            strToolTip += "电压:";
            strToolTip += str;
            strToolTip += "\n";

            QToolTip::showText(cursor().pos(), strToolTip, ui->customPlot);
        });
我们通过lambda公式实现鼠标点击事件。
ui->customPlot->graph(0)->data()->at(index)->valueindex是指曲线图的第几个数据,所以我们需要keyIndexMap将横坐标时间轴转换成整形数据找到是第几个点,进而获取曲线上的数值,俗称为y轴的数值。通过这样转换我们可以通过x轴时间获取y轴的数据,最后通过QToolTip显示到曲线中。
本文只是自己做的项目一个模块,就不给大家更多的代码。本文实现的是,实时曲线图,X轴是时间轴Y轴是电压和电流。
实现图像: