在python机器学习中会遇到各种各样的神经网络图形,以下为例子:
"""======================
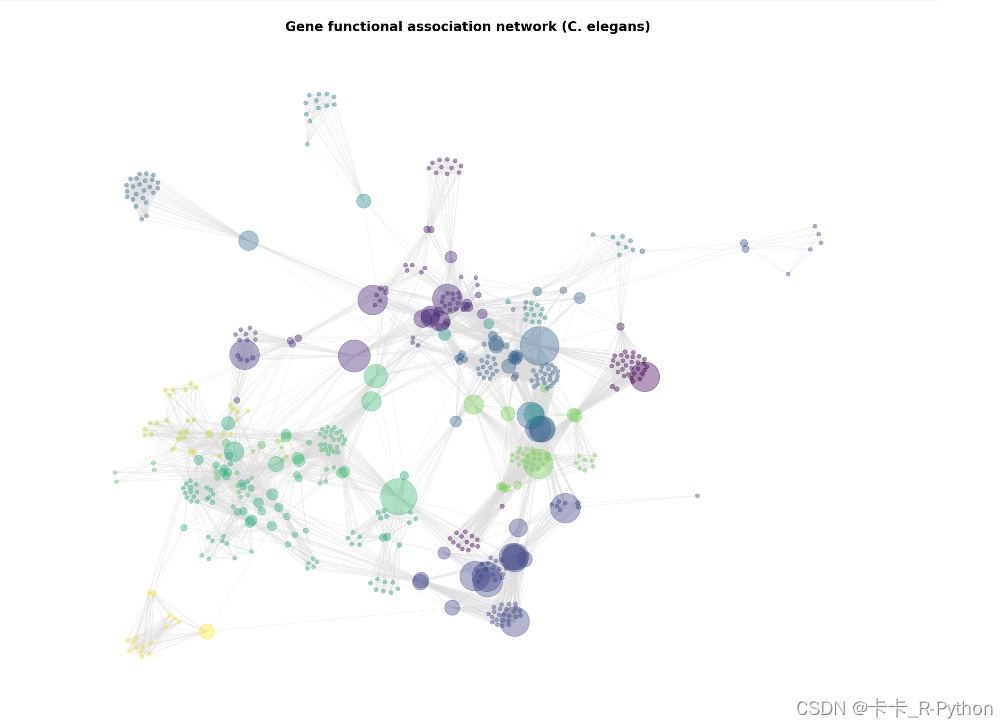
Betweenness Centrality
======================
Betweenness centrality measures of positive gene functional associations
using WormNet v.3-GS.
Data from: https://www.inetbio.org/wormnet/downloadnetwork.php
"""
from random import sample
import networkx as nx
import matplotlib.pyplot as plt
Gold standard data of positive gene functional associations
from https://www.inetbio.org/wormnet/downloadnetwork.php
G = nx.read_edgelist("D:/OneDrive - stu.fynu.edu.cn/Gephi/WormNet.v3.benchmark.txt")
remove randomly selected nodes (to make example fast)
num_to_remove = int(len(G) / 1.5)
nodes = sample(list(G.nodes), num_to_remove)
G.remove_nodes_from(nodes)
remove low-degree nodes
low_degree = n for n, d in G.degree() if d \< 10
G.remove_nodes_from(low_degree)
largest connected component
components = nx.connected_components(G)
largest_component = max(components, key=len)
H = G.subgraph(largest_component)
compute centrality
centrality = nx.betweenness_centrality(H, k=10, endpoints=True)
compute community structure
lpc = nx.community.label_propagation_communities(H)
community_index = {n: i for i, com in enumerate(lpc) for n in com}
draw graph
fig, ax = plt.subplots(figsize=(20, 15))
pos = nx.spring_layout(H, k=0.15, seed=4572321)
node_color = community_index\[n for n in H]
node_size = v \* 20000 for v in centrality.values()
nx.draw_networkx(
H,
pos=pos,
with_labels=False,
node_color=node_color,
node_size=node_size,
edge_color="gainsboro",
alpha=0.4,
)
Title/legend
font = {"color": "k", "fontweight": "bold", "fontsize": 20}
ax.set_title("Gene functional association network (C. elegans)", font)
Change font color for legend
font"color" = "r"
ax.text(
0.80,
0.10,
"",
#"node color = community structure",
horizontalalignment="center",
transform=ax.transAxes,
fontdict=font,
)
ax.text(
0.80,
0.06,
"",
#"node size = betweenness centrality",
horizontalalignment="center",
transform=ax.transAxes,
fontdict=font,
)
Resize figure for label readability
ax.margins(0.1, 0.05)
fig.tight_layout()
plt.axis("off")
plt.savefig("D:/OneDrive - stu.fynu.edu.cn/Gephi/WormNet.v3.benchmark.png")
plt.show()
这样绘制出图形如下: