原创不易,打字不易,截图不易,多多点赞,送人玫瑰,留有余香,财务自由明日实现

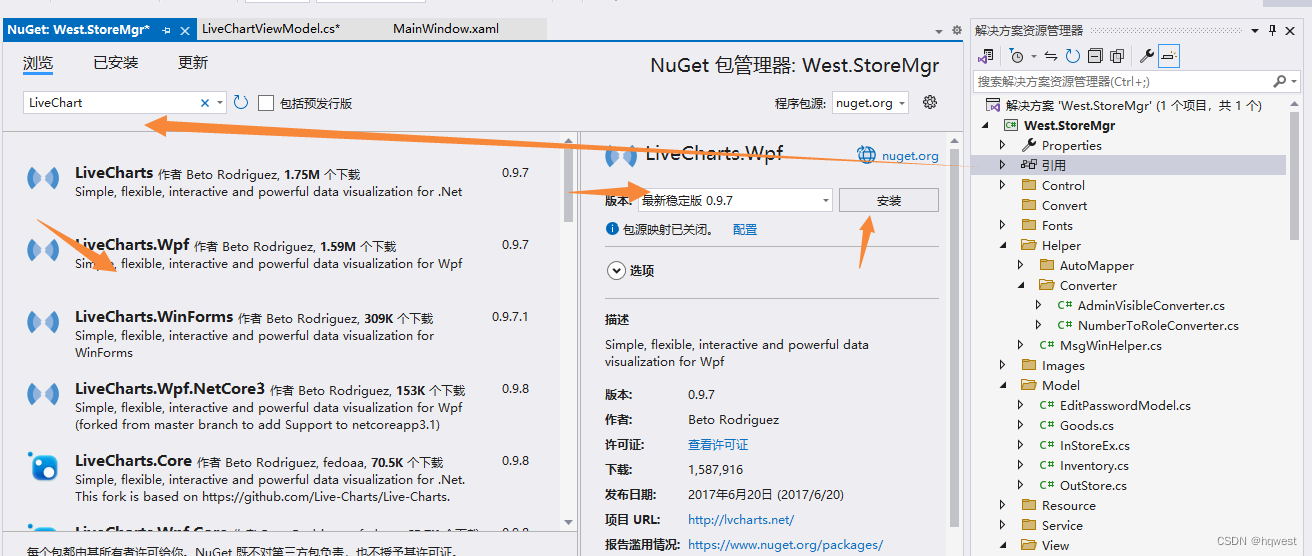
1、引用LiveCharts
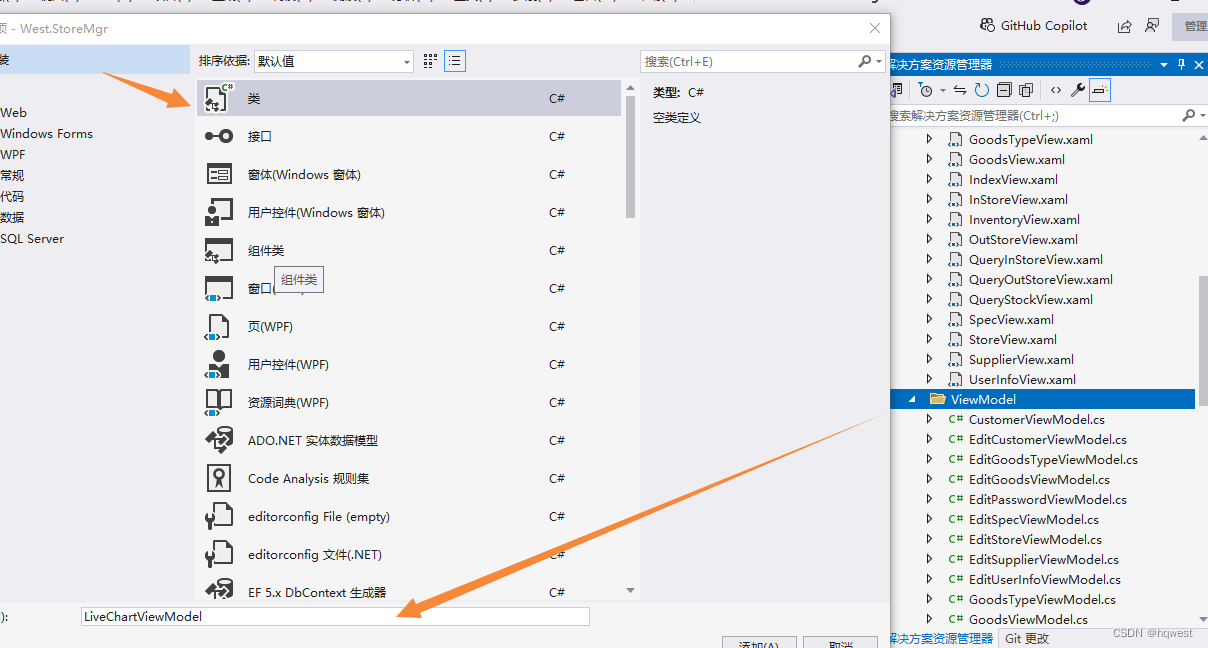
2、创建LiveChartViewModel
cs
using GalaSoft.MvvmLight;
using LiveCharts.Wpf;
using LiveCharts;
using System;
using System.Collections.Generic;
using System.Linq;
using System.Text;
using System.Threading.Tasks;
using GalaSoft.MvvmLight.Command;
using West.StoreMgr.Service;
namespace West.StoreMgr.ViewModel
{
/// <summary>
/// 柱状图viewmodel
/// </summary>
public class LiveChartViewModel : ViewModelBase
{
//物资库存柱状
private IChartValues goodsChartValues = new ChartValues<double>();
public IChartValues GoodsChartValues
{
get { return goodsChartValues; }
set { goodsChartValues = value; RaisePropertyChanged(); }
}
private List<string> goodsLabes = new List<string>();
/// <summary>
/// 物资标签
/// </summary>
public List<string> GoodsLabes
{
get { return goodsLabes; }
set { goodsLabes = value; RaisePropertyChanged(); }
}
//物资入库流水折线
public SeriesCollection GoodsInStoreSeries { get; set; } = new SeriesCollection();
public AxesCollection GoodsInStoreAxis { get; set; } = new AxesCollection();
//物资出库流水折线
public SeriesCollection GoodsOutStoreSeries { get; set; } = new SeriesCollection();
public AxesCollection GoodsOutStoreAxis { get; set; } = new AxesCollection();
//客户出库饼图
public SeriesCollection CustomerPieSeries { get; set; } = new SeriesCollection();
/// <summary>
/// 加载命令
/// </summary>
public RelayCommand LoadCommand
{
get
{
return new RelayCommand(() =>
{
GoodsChartValues.Clear();
GoodsLabes.Clear();
var goodsList = new GoodsService().Select();
var instoreList = new InStoreService().Select();
var outstoreList = new OutStoreService().Select();
var customers = new CustomerService().Select();
goodsList.ForEach(goods =>
{
//物资库存柱状
GoodsChartValues.Add(goods.Quant);
GoodsLabes.Add(goods.Name);
//物资入库流水折线
var instores = instoreList.FindAll(item => item.GoodsSerial == goods.Serial);
var inserise = new LineSeries() { Title = goods.Name, Values = new ChartValues<double>() };
instores.ForEach(item =>
{
inserise.Values.Add(item.Number);
});
GoodsInStoreSeries.Add(inserise);
//物资出库流水折线
var outstores = outstoreList.FindAll(item => item.GoodsSerial == goods.Serial);
var outserise = new LineSeries() { Title = goods.Name, Values = new ChartValues<double>() };
outstores.ForEach(item =>
{
outserise.Values.Add(item.Number);
});
GoodsOutStoreSeries.Add(outserise);
});
CustomerPieSeries.Clear();
customers.ForEach(item =>
{
var list = outstoreList.FindAll(outstore => outstore.CustomerId == item.Id);
var sum = list.Sum(t => t.Number);
var pieSeries = new PieSeries
{
Title = item.Name,
Values = new ChartValues<double>() { sum }
};
CustomerPieSeries.Add(pieSeries);
});
});
}
}
}
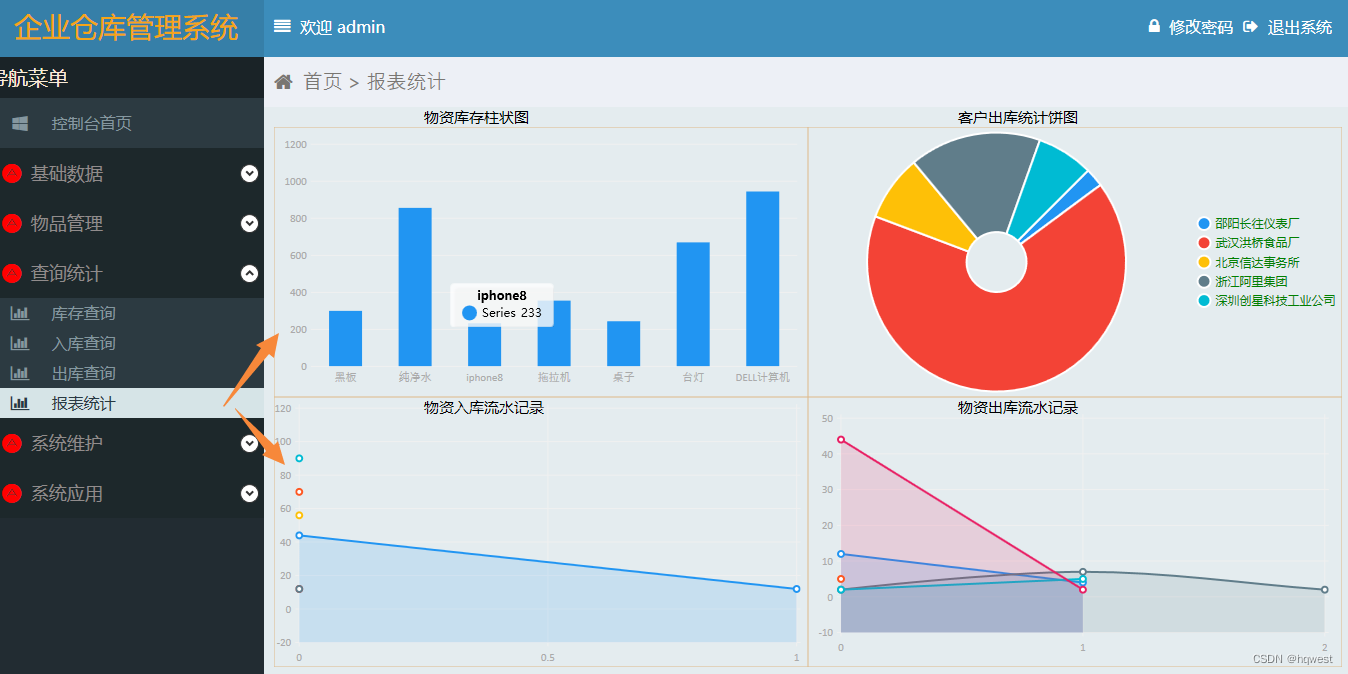
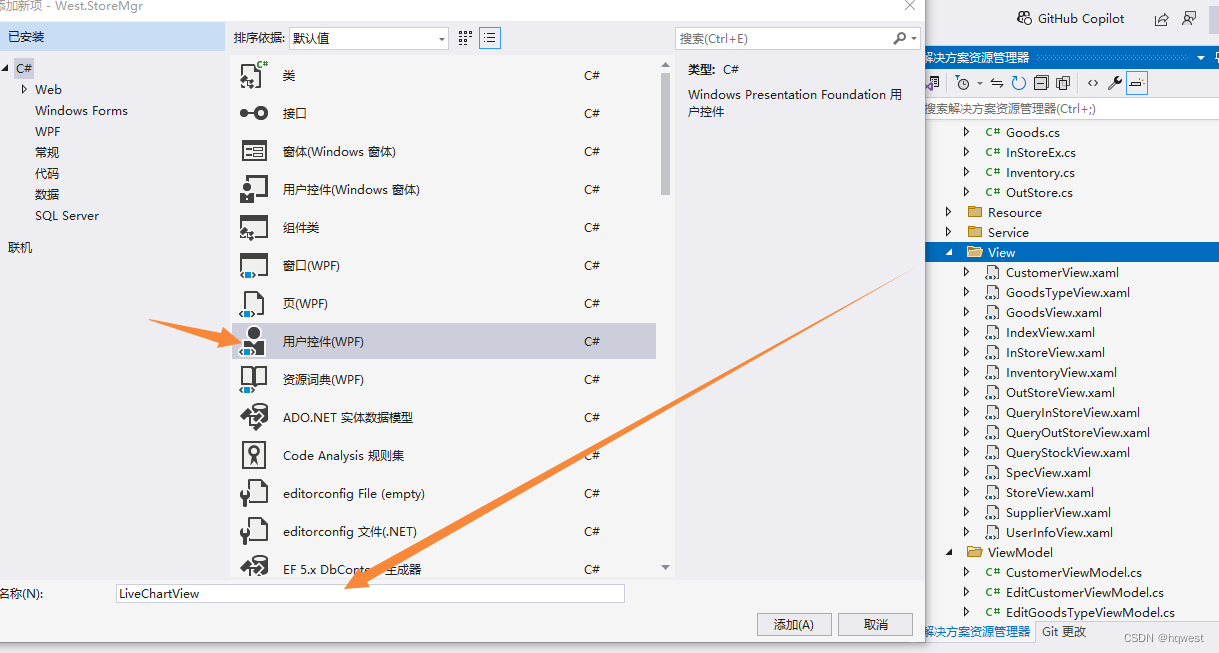
}3、创建LiveChartView用户控件
cs
<UserControl x:Class="West.StoreMgr.View.LiveChartView"
xmlns="http://schemas.microsoft.com/winfx/2006/xaml/presentation"
xmlns:x="http://schemas.microsoft.com/winfx/2006/xaml"
xmlns:mc="http://schemas.openxmlformats.org/markup-compatibility/2006"
xmlns:d="http://schemas.microsoft.com/expression/blend/2008"
xmlns:local="clr-namespace:West.StoreMgr.View"
xmlns:i="http://schemas.microsoft.com/expression/2010/interactivity"
xmlns:wpf="clr-namespace:LiveCharts.Wpf;assembly=LiveCharts.Wpf"
mc:Ignorable="d"
DataContext="{Binding Source={StaticResource Locator},Path=LiveChart}"
d:DesignHeight="450" d:DesignWidth="800">
<i:Interaction.Triggers>
<i:EventTrigger EventName="Loaded">
<i:InvokeCommandAction Command="{Binding LoadCommand}"/>
</i:EventTrigger>
</i:Interaction.Triggers>
<Grid>
<Grid.RowDefinitions>
<RowDefinition Height="50"/>
<RowDefinition Height="auto"/>
<RowDefinition/>
</Grid.RowDefinitions>
<!--标题-->
<StackPanel Background="#EDF0F6" Orientation="Horizontal">
<TextBlock Margin="10 0 0 0" Text="" FontSize="20" FontFamily="/Fonts/#FontAwesome" HorizontalAlignment="Left" VerticalAlignment="Center" Foreground="#797672"/>
<TextBlock Margin="10 0 0 0" Text="首页 > 报表统计" FontSize="20" FontFamily="/Fonts/#FontAwesome" HorizontalAlignment="Left" VerticalAlignment="Center" Foreground="#797672"/>
</StackPanel>
<!--增加-->
<Grid Grid.Row="1" Margin="10">
</Grid>
<!--报表-->
<Grid Grid.Row="2" Margin="10 0 10 10" >
<Grid.ColumnDefinitions>
<ColumnDefinition/>
<ColumnDefinition/>
</Grid.ColumnDefinitions>
<Grid.RowDefinitions>
<RowDefinition/>
<RowDefinition/>
</Grid.RowDefinitions>
<!--物资库存柱状图-->
<TextBlock Text="物资库存柱状图" Grid.Row="0" Grid.Column="0" Margin="150 -20 0 0" FontSize="15" FontFamily="微软雅黑" ></TextBlock>
<Border Grid.Row="0" Grid.Column="0" BorderBrush="BurlyWood" BorderThickness="0.5">
<wpf:CartesianChart Margin="10">
<wpf:CartesianChart.Series>
<wpf:ColumnSeries Values="{Binding GoodsChartValues}"/>
</wpf:CartesianChart.Series>
<wpf:CartesianChart.AxisX>
<wpf:Axis ShowLabels="True" Labels="{Binding GoodsLabes}">
<wpf:Axis.Separator>
<wpf:Separator Step="1" IsEnabled="False"/>
</wpf:Axis.Separator>
</wpf:Axis>
</wpf:CartesianChart.AxisX>
</wpf:CartesianChart>
</Border>
<!--客户出库统计饼图-->
<TextBlock Text="客户出库统计饼图" Grid.Row="0" Grid.Column="1" Margin="150 -20 0 0" FontSize="15" FontFamily="微软雅黑"></TextBlock>
<Border Grid.Row="0" Grid.Column="1" BorderBrush="BurlyWood" BorderThickness="0.5">
<wpf:PieChart LegendLocation="Right" Hoverable="True" InnerRadius="30" Series="{Binding CustomerPieSeries}">
<wpf:PieChart.ChartLegend>
<wpf:DefaultLegend Foreground="Green"/>
</wpf:PieChart.ChartLegend>
</wpf:PieChart>
</Border>
<!--物资入库流水记录-->
<TextBlock Text="物资入库流水记录" Grid.Row="1" Grid.Column="0" Margin="150 0 0 0" FontSize="15" FontFamily="微软雅黑"></TextBlock>
<Border Grid.Row="1" Grid.Column="0" BorderBrush="BurlyWood" BorderThickness="0.5">
<wpf:CartesianChart Series="{Binding GoodsInStoreSeries}" AxisX="{Binding GoodsInStoreAxis}"/>
</Border>
<!--物资出库流水记录-->
<TextBlock Text="物资出库流水记录" Grid.Row="1" Grid.Column="1" Margin="150 0 0 0" FontSize="15" FontFamily="微软雅黑" ></TextBlock>
<Border Grid.Row="1" Grid.Column="1" BorderBrush="BurlyWood" BorderThickness="0.5">
<wpf:CartesianChart Margin="10" Series="{Binding GoodsOutStoreSeries}" AxisX="{Binding GoodsOutStoreAxis}"/>
</Border>
</Grid>
</Grid>
</UserControl>4、运行效果